HAL Id: hal-01334885
https://hal.sorbonne-universite.fr/hal-01334885
Submitted on 20 Jul 2016HAL is a multi-disciplinary open access archive for the deposit and dissemination of sci-entific research documents, whether they are pub-lished or not. The documents may come from teaching and research institutions in France or abroad, or from public or private research centers.
L’archive ouverte pluridisciplinaire HAL, est destinée au dépôt et à la diffusion de documents scientifiques de niveau recherche, publiés ou non, émanant des établissements d’enseignement et de recherche français ou étrangers, des laboratoires publics ou privés.
Impedance study of the influence of chromates on the
properties of waterborne coatings deposited on 2024
aluminium alloy
Anh Son Nguyen, Marco Musiani, Mark E. Orazem, Nadine Pébère, Bernard
Tribollet, Vincent Vivier
To cite this version:
Anh Son Nguyen, Marco Musiani, Mark E. Orazem, Nadine Pébère, Bernard Tribollet, et al.. Impedance study of the influence of chromates on the properties of waterborne coat-ings deposited on 2024 aluminium alloy. Corrosion Science, Elsevier, 2016, 109, pp.174-181. �10.1016/j.corsci.2016.03.030�. �hal-01334885�
1
Impedance study of the influence of chromates on the properties of
waterborne coatings deposited on 2024 aluminium alloy
Anh Son Nguyena, Marco Musianib, Mark E. Orazemc, Nadine Pébèrea,*, Bernard Tribolletd, Vincent Vivierd
a
CIRIMAT, Université de Toulouse, CNRS, INPT, UPS, ENSIACET, 4, allée Emile Monso, BP 44362, 31030 Toulouse cedex 4, France
b Istituto per l’Energetica e le Interfasi, CNR, Corso Stati Uniti 4, 35127 Padova, Italy
c
Department of Chemical Engineering, University of Florida, Gainesville, Florida 32611, USA
d
LISE CNRS, Université Pierre et Marie Curie, 75252, Paris cedex 05, France
* Corresponding author. Phone: 00 33 5 34 32 34 23 Fax: 00 33 5 34 32 34 99
E-mail: Nadine.Pebere@ensiacet.fr (Nadine Pébère)
Manuscript
2 Abstract
Coatings formulated with either SrCrO4 or a mixture of Cr(VI)-free pigments were compared in an impedance study. In addition to classical EIS measurements carried out in the metal/coating/electrolyte configuration, the study involved measurement of the impedance of the coatings in the dry state, both before exposure to the electrolyte (0.5 M NaCl solution) and after a 1-month exposure followed by a 12-month drying. The results were analysed with reference to models that assumed resistivity variations along the coating thickness. The resistivity-position dependence was close to a power law for dry coatings and close to exponential for wet coatings. In the latter, and for short immersion times, the exponential variation was located in the outer coating region, at shorter distances from the coating/solution interface, and then, for longer immersion times (> 1 week), extended to the whole coating thickness. The effect of SrCrO4 leaching on the properties of the coating is discussed. For both coatings, the barrier effect remained high for a 1-month exposure.
3 1. Introduction
In the aeronautic industry, an important challenge today is to develop new efficient coatings with the replacement of hexavalent chromium, as inhibitive pigment, due to future environment legislation. The corrosion protection performance of chromate-free coatings has to be compared to chromated systems, which constitute the “reference”. In the present paper, a comparison is provided for the impedance behaviour of two waterborne coatings with different pigments in their formulation. One of them (henceforth denoted CC) contained SrCrO4. Most results obtained with CC were already described in reference [1], and are recalled in the present work only for the sake of comparison. The other coating (henceforth denoted NCC) contained a mixture of pigments, replacing SrCrO4, and is described here for the first time. Following the same methodology described in [1], the impedance of each coating was measured first under dry conditions, i.e. by contacting the outer coating face with mercury, obtaining an AA2024/coating/Hg system, to assess permittivity and resistivity of the as-prepared coating. Then, the impedance was measured under the ordinary wet conditions,
i.e. in the AA2024/coating/solution configuration, as a function of the immersion time in 0.5
M NaCl solution, for a duration up to 1 month. Finally, after leaving the previously exposed samples to dry during ca.12 months in air, the coating impedance was measured again in the AA2024/coating/Hg configuration, to assess possible permanent changes in the coating properties, induced by the prolonged exposure to the NaCl solution. The results relevant to these dried samples, henceforth called “aged”, are originally presented in this paper for both NCC and CC coatings.
This study was focussed on the use of different models for analysing the impedance data. The analyses highlighted major differences in the time dependence of the barrier properties of CC and NCC, which were ascribed to chromate leaching. Therefore, the amount of chromate
4
released from the CC was determined by UV-visible spectroscopy for various exposure times to 0.5 M NaCl solution.
2. Experimental
The coating samples used and the impedance measurement protocol are presented in this section.
2.1. The coating samples
Both CC and NCC consisted of a two-component water-based paint, manufactured by Mapaero SAS, Pamiers, France, using a polyaminoamide (Versamid® type) as base and a bisphenol A epoxy polymer as hardener, titanium oxide (12 wt. %), talc (11 wt. %) and silica (1 wt. %). In the CC, SrCrO4 (16 wt. %) was added as inhibitive pigment, whereas in the NCC, SrCrO4 was replaced by a mixture of zinc oxide and a phosphosilicate (10 wt. %). The coatings were deposited onto 2024 T3 aluminium alloy plates. The chemical composition in weight percent of the alloy was: Cu: 4.90; Mg: 1.31; Mn: 0.56; Si: 0.08; Fe: 0.26; Zn: 0.10; Ti: 0.01 and Al to balance. The specimens consisted of 125 mm × 80 mm × 1 mm plates machined from a rolled plate. Before painting, the samples were degreased at 60°C (pH = 9) for 15 min, rinsed twice with distilled water, then etched in an acid bath at 52 °C for 10 min, and rinsed again with distilled water. The liquid paints were applied by air spraying. After curing at 60°C, the coatings were 18-22 µm thick.
2.2. Electrochemical impedance measurements
A two-electrode configuration was used in the measurement of the impedance of dry coatings. A cylindrical Plexiglass tube was fixed on top of the coated sample, exposing a surface area of 5.94 cm2, and filled with Hg into which a Cu wire was dipped to create electrical contact.
5
Impedance measurements, carried out using a Solartron 1255 Frequency Response Analyzer and a 1296 Dielectric Interface, were obtained with a 0 V dc bias and a 100 mV peak-to-peak sinusoidal perturbation. Frequency was swept downwards from 105 Hz to 1 Hz, recording 10 points per decade. For this dielectric measurement (AA2024/coating/Hg configuration), the signal to noise ratio worsened below 1 Hz due to the high impedance to be measured (> 1 G). Therefore, frequencies lower than 1 Hz were not investigated in the experiments.
Impedance measurements in the conventional metal/coating/electrolyte configuration were performed in a classical three-electrode cell, realized by fixing a cylindrical Plexiglas tube on top of the coated sample, and filled with a 0.5 M NaCl solution. The working electrode was a 24 cm² portion of the sample. An SCE and a Pt sheet were used as reference and counter electrode, respectively. A Biologic VSP apparatus was used to measure the impedance of the coated samples, for exposure times ranging from 2 hours to ca. 1 month. Measurements were performed under potentiostatic conditions, at the open-circuit potential, with a 30 mV peak-to-peak sinusoidal perturbation. Frequency was swept downwards from 105 Hz to 0.1 Hz, recording 8 points per decade. All data were found to satisfy the Kramers-Kronig relations. A non-commercial software developed at the LISE CNRS, Paris, was used for analysing the impedance data relevant to both dry and wet coatings. The LISE CNRS software allows the use of models consisting of combinations of passive circuit elements and analytical expressions, and the assessment of the best fitted values of the model parameters, but does not provide confidence intervals for them.
To model the dry as-prepared coatings, exhibiting impedances very close to a CPE behaviour, and to determine their physical quantities, the power-law model was regressed to the impedance data, using the following formula [2]
) ( ) ( 0 1 ) 1 ( c c j g Z (1)
6
where , c, c and are adjustable parameters, with the following meaning: CPE
exponent, c permittivity of the dry as-prepared coating, c and , resistivity of the dry
as-prepared coating at the metal/coating and coating/Hg interfaces, respectively. The numerical coefficient g, given as
2.375 1 2.88(1 )
g
tends to unity when approaches unity [2]. Resistivity profiles were calculated from the best-fitted numerical values of these adjustable parameters, according to equation (2):
1 1 c c (2)
where the power-law exponent is given by
1 1 (3)
and = x/ is the dimensionless position along the coating thickness , measured from the metal/coating interface.
The power-law model was previously used in the analysis of the impedance of hybrid sol-gel coatings under wet conditions [3, 4]. Those coatings were significantly less protective than the industrial coatings described in this paper. The model used for analysing the impedances obtained under wet conditions will be described in Section 3.3.
2.3. Chromate leaching experiments and UV-visible analysis
The leaching experiments were performed in similar conditions as those used for the electrochemical measurements. A cylindrical Plexiglas tube was fixed on top of the CC sample and filled with 100 mL of a 0.5 M NaCl solution. 5 mL of the solution were periodically removed and just after 5 mL of a new 0.5 M NaCl solution was added to maintain a constant volume at 100 mL. The tests were carried out for exposure times ranging from 2
7
hours to ca 1 month. The concentrations of released chromate ions were determined by UV-visible spectroscopy using a Shimadzu UV 1800 at = 371 nm. A calibration curve was built by analysing standard strontium chromate solutions. Dilution effects were taken into account.
3. Results and Discussion
3.1. Impedance of NCC and CC under dry conditions: influence of ageing
Figs. 1 and 2 show the impedance measured under dry conditions (i.e. in the AA2024/coating/Hg configuration) for the NCC and CC, respectively. For each system, the samples were characterized as-prepared, before immersion in the 0.5 M NaCl solution and after ageing, i.e. after immersion in the electrolyte during 1000 h, rinsing with deionized water and drying during 12 months, in air, at room temperature. These figures clearly show that ageing caused much stronger changes for CC than for NCC.
For both as-prepared NCC and CC samples, the impedance was close, but not identical, to that of an ideal capacitor. Owing to the quasi-constancy of the phase angle over a five-decade frequency range, the experimental results were analysed with respect to the power-law model corresponding to a strict constant-phase element (CPE) behaviour [2]. For the as-prepared samples, the best fitted curves, shown as continuous lines in Figs. 1 and 2 provide a good agreement between model and data. Table 1 reports the best fitted numerical values of the adjustable parameters , c, c and , for both coatings. These values were used to calculate
the resistivity profiles of the dry as-prepared coatings, shown in Fig. 3, which show constant values (about twice larger for CC than for NCC) throughout most of the coating thickness, and a resistivity decrease (about one order of magnitude) in proximity of the coating/Hg interface, affecting about one tenth of the coatings thickness. Corfias et al. [5] and Le Pen et
al. [6] showed by thermostimulated current measurements on polyurethane-based or on epoxy
8
creating strong electrostatic interactions. These interactions stabilized the structure and enhanced the texturation of the coatings, decreasing the molecular mobility of the polar groups. The modification of the coating microstructure was not observed with neutral fillers [6]. Thus, the difference in the resistivity profiles of CC and NCC observed in Fig. 3 can be explained by the presence/absence of chromates. As a consequence, this structuration might be responsible for a global increase of the barrier properties (decrease of the diffusion rate of the electrolyte through the coating) of CC and thus, the barrier properties of the two coatings are expected to be different during exposure to a 0.5 M NaCl solution.
Table 1 shows that as-prepared CC and NCC had different permittivity value c, ca. 20% lower for CC than for NCC, possibly due to the different chemical nature of the inorganic pigments (which accounted for 16% and 10% of the coating weight, respectively).
After ageing, the impedance of the NCC was qualitatively similar to that of the as-prepared sample, though with a decrease in modulus, and still very close to a CPE behaviour, suggesting that the physical properties of this coating were little affected by the prolonged immersion in NaCl solution, once the NCC was allowed to dry. The best fitted curves obtained by analysing the data with respect to the power-law model are shown as dotted red lines in Fig. 1, and the best fitted numerical values of the adjustable parameters are reported in Table 1. The c value of the NCC was roughly halved after aging, while the value
decreased more significantly. The permittivity c was higher for the aged than for the
as-prepared NCC, which suggests that some water remained trapped in the coating (incomplete drying).
The impedance of the CC underwent profound alteration upon aging, proving that its properties were severely and irreversibly affected by immersion in NaCl solution, most probably due to extensive dissolution of SrCrO4. A greying of the part of the sample in contact with the electrolyte was observed which corroborates the release of chromates from
9
the coating. Loss of part of this chemical, initially present in a 16 wt. % amount in the coating, probably left voids in the polymer matrix, which were filled by the electrolytic solution during immersion. Although most water was removed during drying, some conductive phase may have remained within the aged CC, causing a marked departure from the CPE behaviour of the as-prepared CC and an impedance decrease more evident than for NCC. The aged-CC impedance could not be analysed using the power-law model. However, it is obvious, from the comparison of the impedance data shown in Fig. 2 that the parameters determined for the as-prepared CC (Table 1) were modified during immersion in the electrolyte.
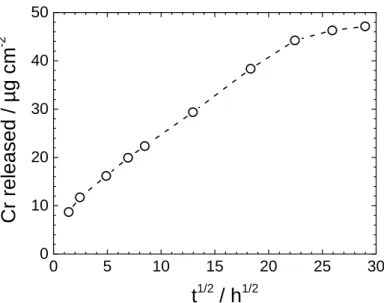
To quantify the release of chromates, the 0.5 M NaCl solution in contact with the CC sample was analysed by UV-visible spectroscopy, after various exposure times. The data are plotted in Fig. 4 as a function of the square root of time. A linear dependence is observed between 6 and 500 h indicating that the release of chromate was mainly controlled by the inhibitor diffusion within the coating. The extrapolation of the straight line to t = 0 would suggest the initial concentration of chromates in the solution to be ca. 8 µg cm-2, while it was actually zero. This result can be explained by a rapid dissolution of the chromates which were close to the outer surface of the coating. For the longest immersion times (t > 500 h), the release of chromates slowed and the chromate concentration approached a plateau. The strontium chromate released at the end of the experiment was 4-5 wt. % of its initial value, i.e. 0.64-0.80 wt. % of the coating mass. Several workers [7-13] investigated the chromate release from polymer matrices and reported that Cr release was high at the very beginning of immersion (some minutes) and slowed down as the immersion time increased. Our results agree with these previous findings. The leaching rate was strongly affected by the binder properties and, to a minor extent, by the solution composition (pH, chloride content), and the temperature [7-11].
10 3.2. Behaviour of CC and NCC under wet conditions
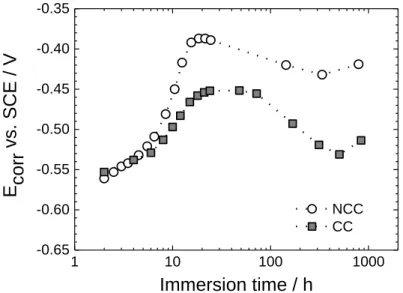
Fig. 5 illustrates the variation of the open-circuit or free-corrosion potential (Ecorr) in a 0.5 M
NaCl solution for the NCC and CC coatings. For both samples, a well-defined Ecorr value
became measurable after ca. 2 h immersion, indicating that water reached the metal surface.
Ecorr increased significantly during the first 24 h of immersion (shift towards less negative
values) and then moved in the opposite direction. For 2 h immersion, the Ecorr value (-0.55
V/SCE) was roughly that of bare AA2024 in aqueous solution of low conductivity. Ecorr was
more negative for CC than for NCC at all immersion times. On the basis of what is known on the action of chromates in solution [14-20] or in protective coatings [21-22], the result can be explained by the action of chromates at the metal/coating interface. The chromates inhibit both partial reactions of the corrosion process. Since the cathodic reaction (oxygen reduction mainly on the intermetallic particles) is that more strongly affected, Ecorr is more negative in
the presence than in the absence of chromates.
Fig. 6 compares the evolution of the impedance diagrams of the NCC and CC coatings, measured at the open circuit potential (Ecorr), for three immersion times in a NaCl 0.5 M
solution. For 10 h of immersion, the impedance modulus was almost identical for the two coatings and only a slight difference could be seen in the phase angle plots. Then, during the first week, the impedance modulus progressively decreased with immersion time. For the NCC, the impedance modulus stabilized between 1-week and 1-month immersions (the relevant plots almost perfectly overlapped). Instead, for the CC, the impedance modulus kept diminishing with immersion time. For both coatings, the phase angles became more strongly frequency dependent at longer immersion times. No well-defined CPE behaviour was observed, under wet conditions, in any frequency range.
11 3.3. Quantitative analysis of the impedance data for the coatings in wet conditions
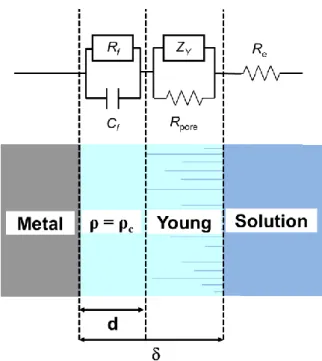
Fig. 7 shows the model employed in the analysis of the impedance under wet conditions. Although it is presented as an equivalent circuit, the impedance model does not comprise only passive elements because ZY is the so-called Young impedance. The basic concepts underlying the Young model were explained in [1] and are briefly recalled here. In the most general case, the coating was assumed to consist of two layers. An inner layer with thickness
d, located next to the metal/coating interface, had and independent of the position, and was modelled with a parallel Rf//Cf combination. Its resistivity was identical to that of the dry
as-prepared coating (c), because it was not yet affected by penetration of ions, in addition to
water. An outer layer had a resistivity profile, caused by inhomogeneous penetration of the electrolytic solution, progressively stronger for approaching 1. Assuming, in this outer layer, an exponential dependence, its impedance was represented by a Young impedance. The whole coating had a uniform permittivity w, no longer identical to that of the as-prepared
coating due to water penetration (either pure or with dissolved ions). The model presented here differs from that described in [1] for the presence of a resistance (Rpore) in parallel with
ZY. The resistance Rpore accounts for the pores extending from = d/ to =1, i.e. crossing
the entire outer layer. Such a resistance was not considered in [1] because its inclusion in the model had no effect on the best-fitted parameters obtained with the CC samples. In other words, even if included, Rpore was too large to influence the overall impedance and could not
be determined, at least in the 1 Hz – 65 kHz range considered in [1] (0.1 Hz in the present work). The overall impedance of the circuit shown in Fig. 7 is given by the series combination of the impedances of the two layers and the electrolyte resistance Re, i.e.
e w d w w pore c w c R j e j j R j d Z 1 1 0 0 / ) ( 0 0 0 0 1 1 ln 1 ) 1 ( (4)
12
The first term of the right hand side, corresponding to the inner layer, is proportional to d and therefore vanishes when the resistivity becomes position dependent across the whole coating thickness. The second term accounts for the parallel combination of the Young impedance and Rpore. Once d becomes zero, this term represents the impedance of the entire coating. he
coating resistivity at the metal/coating interface is denoted by 0, which may or may not be
equal to c.
3.4. Comparison between NCC and CC
Equation (4) was regressed to experimental data recorded in the 0.1 Hz < f < 65 kHz frequency range, using , w, Rpore and d as adjustable parameters relevant to the coatings. The
best-fitted curves are shown in Fig. 6 as dotted lines, demonstrating good agreement between data and model. Fig. 8 compares the profiles calculated according to equation (4) using
the best fitted parameters and d, the resistivity c of the as-prepared coatings, and ,
defined as the resistivity of the coating at the interface with the NaCl solution, given by:
) exp( 0 (5)
For increasing immersion times, the profiles of the NCC showed:
(i) a marked decrease of , which, already after 10 h, was five orders of magnitude lower than for the dry, as-prepared sample,
(ii) progressive disappearance of the inner layer, reduced to about one third of the coating thickness after 10 h, and to virtually zero after 1 week, and
(iii) stabilization of the properties of the coating for immersion times longer than 1 week. For CC, the resistivity profiles were very close to those presented in [1] even though the analysed frequency domain was larger in the present work. This result shows that the increased frequency domain and the introduction of Rpore in the model did not affect the
13
impedance analysis significantly. In contrast, impedance data obtained for the NCC could not be satisfactorily reproduced without including Rpore in the model, whatever the analysed
frequency range.
The profiles show lower values for CC than for NCC, particularly for immersion times longer than one week. Moreover, at the metal coating/interface the CC resistivity value 0 was
ten times lower than that of the dry coating (c). By taking into account the impedance result
obtained for aged CC sample, measured under dry conditions (Fig. 2) and the chemical analysis of the solution which showed the progressive release of chromates (Fig. 4), it can be concluded that SrCrO4 leaching affected the resistivity profile throughout the whole coating thickness. The dissolution of chromates could also decrease the coating resistivity. For both coatings, the development of a resistivity profile, more marked than that observed with the dry coating was attributed to an inhomogeneous uptake of the electrolyte [1]. More particularly, as reported in [1, 4], the penetration of water and ions occurred on different time scales, in agreement with previous studies [23-27]. The water penetrated fast into the coating and affected permittivity more strongly than resistivity. Na+ and Cl- ions diffused more slowly and affected exclusively resistivity [1].
Fig. 9 shows the dependence of the zero-frequency limit of the Young impedance, ZY(0), (a)
and of Rpore (b) on immersion time, for NCC and CC. As the immersion progressed, ZY(0)
decreased for both coatings, but the decrease rate was higher for CC (which had initially a higher ZY(0) value) than for NCC. Thus, the two plots in Fig. 9a crossed each other. At the
end of the immersion test, ZY(0) was almost an order of magnitude higher for the NCC than
for the CC. The observed difference is mainly ascribed to the release of chromates.
Fig. 9b shows that Rpore values were quasi-independent of time for the both coatings, and
markedly lower for NCC than for CC (after 1 month immersion, Rpore values were 4 × 10⁸
14
enhanced the barrier properties of the coating, in comparison with neutral fillers, in agreement with previous findings [5, 6]. Studying the impedance of free-standing films, Le Pen et al. [6] showed that the barrier properties of a chromated system exposed to a 0.5 M NaCl solution remained higher than those of coatings without chromates. As previously discussed for the dry coatings, chromates caused hardening of the coating, i.e. they decreased the molecular mobility of the binder, thanks to their high polarity that enhanced the interactions with the polymer chains [5, 6]. Thus, the higher values of Rpore for CC compared to NCC can be
attributed to an enhancement of the texturation of the coating in the presence of chromated ions.
Fig. 10 compares the profiles calculated for NCC and CC, at an immersion time of 1
week. For each coating, three curves are shown. The squares represent the resistivity associated to the Young impedance (Y) i.e. the resistivity due to the inhomogeneous
penetration of water and salts. The circles represent the resistivity due to through pores (pore),
obtained from Rpore according to:
pore
pore
R
(6)
where Rpore refers to the unit surface and the whole coating thickness is considered because,
after 1 week, d was reduced to 0. The black solid line represents the total resistivity, given by:
1 1 1 pore Y (7)
For NCC (Fig. 10a), the Y and pore profiles cross each other. The resulting profile
is close to pore in an inner layer extending from = 0 to = 0.25, and close to Yin the
remaining outer part of the coating. At the metal/coating interface, the total resistivity profile was controlled by the presence of Rpore. For CC (Fig. 10b), Y is smaller than pore through the
15
metal/coating interface. Therefore, the Y and profiles are close to each other.
Comparison of the plots in Fig. 10 shows that pore had little effect on the CC resistivity, but
significantly affected the resistivity profile of the NCC.
The profiles of both coatings are directly compared in Fig. 11 where, in addition to the curves relevant to 1 week immersion, those obtained for 1 month immersion are shown (the two NCC curves overlap). The NCC resistivity is lower than that of the CC in the inner, more resistive part of the coating, and is higher than that of the CC in the remaining, less resistive part which, though thicker, contributes to the overall impedance to a lesser extent.
Taken together, Figs. 9, 10 and 11 show that data analysis leads to a decomposition of the overall impedance of NCC and CC into contributions that are significantly different for the two coatings. Since Fig. 6 shows comparable experimental plots for NCC and CC at 10 h and 1 week immersion times, doubts might arise on the reliability of a model that produces different descriptions for experimentally similar systems. However, the experiments carried out on aged coatings in the AA2024/coating/Hg configuration did show that NCC maintained its properties after prolonged exposure (Fig. 1); whereas, CC became significantly less resistive (Fig. 2). These results validate the variation of ZY(0) vs. immersion time shown in
Fig. 9a and, consequently, the profiles calculated therefrom.
Fig. 12 presents the immersion-time dependence of the zero-frequency limit of the impedances (Ztotal) of NCC and CC, calculated according to equation (4), with correction of
Re. It is seen that the two curves are close to each other, although they correspond to
significantly different combinations of the ZY and Rpore contributions. For immersion times > 1
week, Ztotal values agree perfectly well with the value of the impedance modulus in the low
frequency range (Fig. 6). Thus, these curves underscore that similar global impedances may arise from combinations of different elements (resistances, impedances).
16
Finally, it is interesting to point out that for CC, even if the leaching of chromates induced changes in the microstructure of the coating (resistivity decrease), the barrier properties remained high due to structuring effect of these species. For the NCC, the barrier properties were also high, and, after 1-month immersion, the substrate was not corroded.
4. Conclusions
The analysis of the impedance behaviour of chromated and unchromated water-borne coatings for AA2024 required the use of different models for results obtained in the dry state or in the classical metal/coating/electrolyte configuration. The impedance of as-prepared dry coatings was sufficiently close to a CPE behaviour that the “power-law model” [2] applied. The same model was suitable also for aged Cr(VI)-free coatings, but not for aged samples loaded with SrCrO4, since their impedance markedly differed from that of a CPE. Modelling the impedance of wet coatings required assuming the existence of two layers: (i) next to the metal, an inner layer with homogeneous resistivity, the thickness of which became negligible when exposure was prolonged, and (ii) an outer layer with an exponential resistivity profile, caused by inhomogeneous penetration of the NaCl solution. A parallel combination of a Young impedance and a resistance of through pores (Rpore) accounted for the impedance of
the outer layer. Although the overall impedances of NCC and CC coatings were rather close to each other, data analysis showed that they resulted from different contributions. Rpore was
almost independent of immersion time and ca. 10 times larger for CC than for NCC. The Young impedance was initially larger but then decreased at a higher rate for CC than for NCC, to become ca. 10 times lower after one month. The observed behaviour for CC was ascribed to the leaching of SrCrO4, which was confirmed by the chemical analysis of the solution.
17
Acknowledgments
The authors gratefully acknowledge the company MAPAERO (Pamiers, France) for the preparation of the coated samples and more particularly Pauline Côte and Pierre-Jean Lathière for fruitful discussion on coating technologies. The PhD thesis of Nguyen Anh Son was prepared in the framework of the associated international laboratory “Functional Composite Materials (FOCOMAT)” between France and Vietnam.
References
[1] A.S. Nguyen, M. Musiani, M.E. Orazem, N. Pébère, B. Tribollet, V. Vivier, EIS analysis of the distributed resistivity of coatings in dry and wet conditions, Electrochim. Acta. 179 (2015) 452-459.
[2] B. Hirschorn, M. E. Orazem, B. Tribollet, V. Vivier, I. Frateur, M. Musiani, Constant-Phase-Element Behavior Caused by Resistivity Distributions in Films: 1. Theory, J. Electrochem. Soc. 157 (2010) C452-C457.
[3] S. Amand, M. Musiani, M.E. Orazem, N. Pébère, B. Tribollet, V. Vivier, Constant-phase-element behavior caused by inhomogeneous water uptake in anti-corrosion coatings, Electrochim. Acta 87 (2013) 693-700.
[4] M. Musiani, M.E. Orazem, N. Pébère, B. Tribollet, V. Vivier, Determination of resistivity profiles in anti-corrosion coatings from constant-phase-element parameters, Prog. Org. Coat. 77 (2014) 2076-2083.
[5] C. Corfias, N. Pébère, C. Lacabanne, Characterization of a thin protective coating on galvanized steel by electrochemical impedance spectroscopy and a thermostimulated current method, Corros. Sci. 4 (1999) 1539-1555.
[6] C. Le Pen, C. Lacabanne, N. Pébère, Structure of waterborne coatings by electrochemical impedance spectroscopy and a thermostimulated current method: influence of the polymer fillers, Prog. Org. Coat. 39 (2000) 167-175.
[7] T. Proseck, D. Thierry, A model for the release of chromate from organic coatings, Prog. Org. Coat. 49 (2004) 209-217.
18
[8] E. Akiyama, A.J. Markworth, J.K. McCoy, G.S. Frankel, L. Xia, R.L. McCreery, Storage and release of soluble hexavalent chromium from chromate conversion coatings on Al Alloys. Kinetics of Release, J. Electrochem. Soc. 150 (2003) B83-B91.
[9] F.H. Scholes, S.A. Furman, A.E. Hughes, T. Nikpour, N. Wright, P.R. Curtis, C.M. Macrae, S. Intem, A.J. Hill, Chromate leaching from inhibited primers – Part I. Characterisation of leaching, Prog. Org. Coat. 56 (2006) 23-32.
[10] S.A. Furman, F.H. Scholes, A.E. Hughes, D. Lau, Chromate leaching from inhibited primers – Part II. Modelling of leaching, Prog. Org. Coat. 56 (2006) 33-38.
[11] S. Sellaiyan, A.E. Hughes, S.V. Smith, A. Uedono, J. Sullivan, S. Buckman, Leaching properties of chromate-containing epoxy films using radiotracers, PALS and SEM, Prog. Org. Coat. 77 (2014) 257-267.
[12] A.E. Hughes, A. Trinchi, F.F. Chen Y.S. Yang, I.S. Cole, S. Sellaiyan, J. Carr, P.D. Lee, G.C. Thompson, T.Q. Xiao, The application of multiscale quasi 4D CT to the study of SrCrO4 distributions and the development of porous networks in epoxy-based primer coatings, Prog. Org. Coat. 77 (2014) 1946-1956.
[13] R. Oltra, F. Peltier, Influence of mass transport on the competition between corrosion and passivation by inhibitor release after coating breakdown, Prog. Org. Coat. 92 (2016) 44-53.
[14] M.W. Kendig, A.J. Davenport, H.S. Isaacs, The mechanism of corrosion inhibition by chromate conversion coatings from x-ray absorption and near edge spectroscopy (XANES), Corros. Sci. 34 (1993) 41-49.
[15] J.D. Ramsey, R.L. McCreery, In situ Raman microscopy of chromate effects on corrosion pits in aluminum alloy, J. Electrochem. Soc. 146 (1999) 4076-4081.
[16] M. Kendig, S. Jeanjaquet, R. Addison, J. Waldrop, Role of hexavalent chromium in the inhibition of corrosion of aluminum alloys, Surf. Coat. Technol. 140 (2001) 58-66.
19
[17] A. Kolics, A.S. Besing, A. Wieckowski, Interaction of Chromate Ions with Surface Intermetallics on Aluminum Alloy 2024-T3 in NaCl Solutions, J. Electrochem. Soc. 148 (2001) B322-B331.
[18] J.D. Ramsey, L. Xia, M.W. Kendig, R.L. McCreery, Raman spectroscopic analysis of the speciation of dilute chromate solutions, Corros. Sci. 43 (2001) 1557-1572.
[19] M.W. Kendig, R.G. Buccheit, Corrosion inhibition of aluminum and aluminum alloys by soluble chromates, chromate coatings and chromate-free coatings, Corrosion 59 (2003) 379-400.
[20] J.D. Ramsey, R.L. McCreery, Raman microscopy of chromate interactions with corroding aluminium alloy 2024-T3, Corros. Sci. 46 (2004) 1729-1739.
[21] S.A. Furman, F.H. Scholes, A.E. Hughes, D.N. Jamieson, C.M. Macrae, A.M. Glenn, Corrosion in artificial defects. II. Chromate reactions, Corros. Sci. 48 (2006) 1827-1847.
[22] A. Trueman, S. Knight, J. Colwell, T. Hashimoto, J. Carr, P. Skeldon, G. Thompson, 3-D tomography by automated in situ block face ultramicrotome imaging using an FEG-SEM to study complex corrosion protective paint coatings, Corros. Sci. 75 (2013) 376-385.
[23] V.B. Mišković-Stanković, D.M. Dražić, M.J. Teodorović, Electrolyte penetration through epoxy coatings electrodeposited on steel, Corros. Sci. 37 (1995) 241-252.
[24] V.B. Mišković-Stanković, D.M. Dražić, Z. Kačarević-Popović, The sorption characteristics of epoxy coatings electrodeposited on steel during exposure to different corrosive agents, Corros. Sci 38 (1996) 1513-1523.
[25] J.M. Hu, J.Q. Zhang, C.N. Cao, Determination of water uptake and diffusion of Cl– ion in epoxy primer on aluminum alloys in NaCl solution by electrochemical impedance spectroscopy, Prog. Org. Coat. 46 (2003) 273-279.
[26] Q. Zhou, Y. Wang, Comparison of clear coating degradation in NaCl solution and pure water, Prog. Org. Coat. 76 (2013) 1674-1682.
20
[27] Y. Dong, Q. Zhou, Relationship between ion transport and the failure behaviour of epoxy resin coatings, Corros. Sci 78 (2014) 22-28.
Table 1. Best-fitted values of the adjustable parameters in Eq. (2) obtained by regressing the power-law model to experimental data for the dry as-prepared coating.
Sample c c ( cm) ( cm) NCC As-prepared 0.981 6.1 5.8 x 10 12 4.0 x 10¹¹ NCC Aged 0.981 7.3 3.3 x 10 12 1.0 x 10⁹ CC As-prepared 0.987 4.9 1.0 x 10 13 1.1 x 10¹² CC Aged a nd nd nd nd
a: The power-law model did not provide a good fit for the aged CC sample. Therefore, best fitted parameters were not determined (nd).
21 Figure captions
Fig. 1. The impedance modulus (a) and phase angle (b) obtained for the dry as-prepared and aged NCC coating (18 μm thick). The experimental data are compared with the regression result with the power-law model according to Eq. (1).
Fig. 2. The impedance modulus (a) and phase angle (b) obtained for the dry as-prepared and aged CC coating (21 µm thick). The experimental data for the as-prepared sample () are compared with the regression result with the power-law model according to Eq. (1).
Fig. 3: Resistivity vs. dimensionless position ( = x/) along the coating thickness calculated according to Eq. (2) for the dry as-prepared NCC and CC coatings.
Fig. 4. Immersion time dependence of the amount of chromium released from a 24 cm2 CC sample in contact with a 0.5 M NaCl solution.
Fig. 5. Corrosion potential (Ecorr) as a function of immersion time in 0.5 M NaCl for the
AA2024 samples protected by NCC and CC.
Fig. 6. Impedance response in Bode format for the AA2024 coated samples (NCC and CC) obtained after 10 h, a week and a month immersion in 0.5 M NaCl. The dashed lines are the best fitted curves calculated according to Eq. (4).
Fig. 7. Schematic representation of the two-layer model. The coating is assumed to consist of an inner layer with uniform resistivity ρ = ρc and an outer layer with the parallel combination
between a resistance of pore and a part which has an exponential dependence of resistivity on position.
Fig. 8. Resistivity profiles through the coatings inferred from the impedance analysis as a function of immersion time in 0.5 M NaCl solution: (a) NCC and (b) CC.
Fig. 9. Comparison of: (a) the zero-frequency limit of the Young impedance (ZY(0)) and (b) Rpore as a function of immersion time for NCC and CC.
Fig. 10. Dependence of the coatings resistivity on the dimensionless position along the coating thickness, for NCC (a) and CC (b) after a week immersion in 0.5 M NaCl. In each part, the contributions of Young impedance and Rpore are compared with the resulting total resistivity profile.
Fig. 11. Dependence of the NCC and CC total resistivity on the dimensionless position along the coating thickness, for two immersion times in 0.5 M NaCl solution indicated on the figure.
22
Fig. 12. Dependence of the zero-frequency limit of the impedance of NCC and CC on immersion-time in 0.5 M NaCl, calculated according to Eq. (4).
Fig. 1. The impedance modulus (a) and phase angle (b) obtained for the dry as-prepared and aged NCC coating (18 μm thick). The experimental data are compared with the regression
result with the power-law model according to Eq. (1).
100 101 102 103 104 105 103 104 105 106 107 108 109 NCC - as-prepared NCC - aged NCC - as-prepared - fitting NCC - aged - fitting
|Z| /
cm
2f / Hz
(a) 100 101 102 103 104 105 78 80 82 84 86 88 90 NCC - as-prepared NCC - aged NCC - as-prepared - fitting NCC - aged - fitting
/
degree
f / Hz
(b) Figure 1Fig. 2. The impedance modulus (a) and phase angle (b) obtained for the dry as-prepared and aged CC coating (21 µm thick). The experimental data for the as-prepared sample () are
compared with the regression result with the power-law model according to Eq. (1).
100 101 102 103 104 105 78 80 82 84 86 88 90 CC - as-prepared CC - aged Power-law model
/
degree
f / Hz
(b) 100 101 102 103 104 105 103 104 105 106 107 108 109 CC - as-prepared CC - aged Power-law model|Z| /
cm
2f / Hz
(a) Figure 2Fig. 3. Resistivity vs. dimensionless position (ξ = x/δ) along the coating thickness calculated according to Eq. (2) for the dry as-prepared NCC and CC coatings.
0.0 0.2 0.4 0.6 0.8 1.0 1011 1012 1013 1014
/
cm
/ dimensionless
NCC CC Mer cu ryCoating
Meta l Figure 3Fig. 4. Immersion time dependence of the amount of chromium released from a 24 cm2 CC sample in contact with a 0.5 M NaCl solution.
0 5 10 15 20 25 30 0 10 20 30 40 50
Cr relea
sed / µg cm
-2t
1/2/ h
1/2 Figure 4Fig. 5. Corrosion potential (Ecorr) as a function of immersion time in 0.5 M NaCl for the
AA2024 samples protected by NCC and CC.
1 10 100 1000 -0.65 -0.60 -0.55 -0.50 -0.45 -0.40 -0.35 E corr vs . SCE / V Immersion time / h NCC CC Figure 5
Fig. 6. Impedance response in Bode format for the AA2024 coated samples (NCC and CC) obtained after 10 h, a week and a month immersion in 0.5 M NaCl.
The dashed lines are the best fitted curves calculated according to Eq. (4).
10-1 100 101 102 103 104 105 103 104 105 106 107 108 109 1010 CC - 10 h CC - 1 week CC - 1 month NCC - 10h NCC - 1 week NCC - 1 month
|Z| /
cm
2f / Hz
(a) 10-1 100 101 102 103 104 105 10 20 30 40 50 60 70 80 90 CC - 10 h CC - 1 week CC - 1 month NCC - 10h NCC - 1 week NCC - 1 month-
/
degree
f / Hz
(b) Figure 6Fig. 7. Schematic representation of the two-layer model.
The coating is assumed to consist of an inner layer with uniform resistivity ρ = ρc and an
outer layer with the parallel combination between a resistance of pore and a part which has an exponential dependence of resistivity on position.
Fig. 8. Resistivity profiles through the coatings inferred from the impedance analysis as a function of immersion time in 0.5 M NaCl solution: (a) NCC and (b) CC.
0.0 0.2 0.4 0.6 0.8 1.0 105 106 107 108 109 1010 1011 1012 1013 1014 Solu tio n
/
cm
/ dimensionless
CC - 10h CC - 1 day CC - 1 week CC - 1 month Dry coating Meta l (b) 0.0 0.2 0.4 0.6 0.8 1.0 105 106 107 108 109 1010 1011 1012 1013 1014 (a)
/
cm
/ dimensionless
NCC - 10h NCC - 1 day NCC - 1 week NCC - 1 month Meta l Solu tio n Dry coating Figure 8Fig. 9. Comparison of: (a) the zero-frequency limit of the Young impedance (ZY(0)) and (b) Rpore as a function of immersion time for NCC and CC.
1 10 100 1000 107 108 109 1010 1011
Z
Y(0) /
cm
2Immersion time / h
NCC CC (a) 1 10 100 1000 107 108 109 1010 1011 (b)R
pore/
cm
2Immersion time / h
NCC CC Figure 9Fig. 10. Dependence of the coatings resistivity on the dimensionless position along the coating thickness, for NCC (a) and CC (b) after a week immersion in 0.5 M NaCl. In each part, the contributions of Young impedance and Rpore are compared with the resulting total
resistivity profile. 0.0 0.2 0.4 0.6 0.8 1.0 105 106 107 108 109 1010 1011 1012 1013 1014 Solu tio n Y - CC pore - CC - CC
/
cm
/ dimensionless
Meta l (b) 0.0 0.2 0.4 0.6 0.8 1.0 105 106 107 108 109 1010 1011 1012 1013 1014 Y - NCC pore - NCC - NCC
/
cm
/ dimensionless
Meta l Solu tio n (a) Figure 10Fig. 11. Dependence of the NCC and CC total resistivity on the dimensionless position along the coating thickness, for two immersion times in 0.5 M NaCl solution indicated on the figure.
0.0 0.2 0.4 0.6 0.8 1.0 105 106 107 108 109 1010 1011 1012 1013 1014
/
cm
/ dimensionless
CC - 1 week CC - 1 month NCC - 1 week NCC - 1 month Meta l Solu tio n Figure 11Fig. 12. Dependence of the zero-frequency limit of the impedance of NCC and CC on immersion-time in 0.5 M NaCl, calculated according to Eq. (4).
1 10 100 1000 107 108 109 1010 1011