HAL Id: inserm-01165000
https://www.hal.inserm.fr/inserm-01165000
Submitted on 18 Jun 2015
HAL is a multi-disciplinary open access
archive for the deposit and dissemination of
sci-entific research documents, whether they are
pub-lished or not. The documents may come from
teaching and research institutions in France or
abroad, or from public or private research centers.
L’archive ouverte pluridisciplinaire HAL, est
destinée au dépôt et à la diffusion de documents
scientifiques de niveau recherche, publiés ou non,
émanant des établissements d’enseignement et de
recherche français ou étrangers, des laboratoires
publics ou privés.
Slow walking speed and cardiovascular death in well
functioning older adults: prospective cohort study.
Julien Dumurgier, Alexis Elbaz, Pierre Ducimetière, Béatrice Tavernier,
Annick Alpérovitch, Christophe Tzourio
To cite this version:
Julien Dumurgier, Alexis Elbaz, Pierre Ducimetière, Béatrice Tavernier, Annick Alpérovitch, et
al..
Slow walking speed and cardiovascular death in well functioning older adults:
prospec-tive cohort study..
British medical journal, British Medical Association, 2008, 339, pp.b4460.
Slow walking speed and cardiovascular death in well
functioning older adults: prospective cohort study
Julien Dumurgier, neurologist,
1,2,3Alexis Elbaz, epidemiologist,
1,2Pierre Ducimetie`re, senior epidemiologist,
4,5Be´atrice Tavernier, geriatrician,
6Annick Alpe´rovitch, senior epidemiologist,
1,2Christophe Tzourio, head of the
Inserm neuroepidemiology unit
1,2ABSTRACT
Objective To study the relation between low walking speed and the risk of death in older people, both overall and with regard to the main causes of death.
Design Prospective cohort study.
Setting Dijon centre (France) of the Three-City study. Participants 3208 men and women aged≥65 living in the community, recruited from 1999 to 2001, and followed for an average of 5.1 years.
Main outcome measures Mortality, overall and according to the main causes of death, by thirds of baseline walking speed (measured at maximum speed over six metres), adjusted for several potential confounders; Kaplan-Meier survival curves by thirds of baseline walking speed. Vital status during follow-up. Causes of death.
Results During 16 414 person years of follow-up, 209 participants died (99 from cancer, 59 from cardiovascular disease, 51 from other causes). Participants in the lowest third of baseline walking speed had an increased risk of death (hazard ratio 1.44, 95% confidence interval 1.03 to 1.99) compared with the upper thirds. Analyses for specific causes of death showed that participants with low walking speed had about a threefold increased risk of cardiovascular death (2.92, 1.46 to 5.84) compared with participants who walked faster. There was no relation with cancer mortality (1.03, 0.65 to 1.70). In stratified analyses, cardiovascular mortality was increased across various strata defined by sex, median age, median body mass index (BMI), and level of physical activity. Conclusion Slow walking speed in older people is strongly associated with an increased risk of cardiovascular mortality.
INTRODUCTION
There is growing interest in using walking speed in ambulatory clinics to readily assess functional status and motor performances in older people, and walking speed has been recommended as a possible “vital sign.”1A few studies in well functioning older people
have shown that decreased walking speed can predict adverse health related events such as falls,2 3disability,4
admissions to hospital,5 6and“persistent lower
extre-mity limitation.”7Lower walking speed has also been
associated with increased all cause mortality,8but it is
unknown whether specific causes of death account for this increased mortality.
As part of a prospective cohort of well functioning older people enrolled in the Three-City (3C) study we studied the prognostic value of walking speed by inves-tigating its relation with mortality overall and accord-ing to main causes of death. Because of recent evidence indicating that vascular risk factors might be associated with decreased motor performances,9 10we had a
spe-cial interest in the relation between walking speed and risk of cardiovascular death.
METHODS
The 3C study is an ongoing cohort study conducted in three French cities (Bordeaux, Dijon, Montpellier). Details of the study and primary outcomes have been previously reported.11Participants aged≥65 and living
in the community were recruited from electoral rolls. The first step of the sampling procedure was to select administrative districts. Eligible inhabitants of the selected districts were invited to participate by a letter and were then contacted by phone until we reached our target number of participants; the acceptance rate was 37%. Data for the present study were obtained in Dijon (n=4931), where investigators were interested in motor function in older people. After baseline exami-nation, follow-up examinations were performed at a mean of 1.8 years (2001-2), 3.6 years (2003-4), and 5. 1 years (2005-6).
Baseline assessments
During a face-to-face interview in participants’ homes in 1999-2001 trained psychologists collected baseline demographic and medical data using standardised questionnaires. Education was defined as a four level variable (no school/primary without diploma, primary with diploma, secondary without a baccalaureate degree, baccalaureate/university degree). Participants were asked about their history of coronary artery dis-ease (myocardial infarction, angina pectoris, coronary revascularisation), peripheral artery disease, stroke, Parkinson’s disease, and recent hip fracture (in the two preceding years). Exertional dyspnoea was self declared, based on the New York Heart Association
1INSERM, U708, F-75013, Paris,
France
2UPMC Univ Paris 06, F-75005,
Paris, France
3CMRR Paris Nord-IDF, GH
Lariboisière – Fernand Widal, F-75010, Paris, France
4INSERM, U780, Villejuif, France 5Université Paris-Sud, France 6CHU de Dijon, Department of
Geriatrics, F-21000, Dijon, France Correspondence to: Alexis Elbaz [email protected]
Cite this as:BMJ 2009;339:b4460
(NYHA) classification. Blood pressure was measured twice during the baseline interview, and the average of these two measurements was used. Hypertension was defined as high blood pressure (systolic blood pressure ≥140 mm Hg or diastolic blood pressure ≥90 mm Hg) or use of antihypertensive medication. Participants were considered to have diabetes if they used anti-diabetic agents or if their fasting glucose concentration was≥7.0 mmol/l. Hypercholesterolaemia was defined as total cholesterol≥6.2 mmol/l or use of lipid lowering drugs. Smoking status was classified as current, past, or never. Weight and height were measured and used to calculate body mass index (BMI). Chronic use of non-steroidal anti-inflammatory drugs (NSAIDs) for joint pain was assessed and considered as a surrogate for rheumatic disease. Baseline physical activity was self reported as a three level variable assessing the daily duration of walking and athletic activities.
Depressive symptoms were assessed with the Center for Epidemiologic Studies Depression Scale (CES-D).12Use of psychotropic drugs (anxiolytics,
hypno-tics, antidepressants) was also assessed. Participants underwent a battery of cognitive tests, including the mini-mental state examination (MMSE). The ability to complete instrumental activities of daily living (Law-ton IADL scale) was assessed. Diagnosis of dementia was established with a three phase procedure: partici-pants were screened using the mini-mental state exam-ination and the Isaac set test; a neurologist then examined those with positive results. The final diagno-sis was established by a panel of independent neurolo-gists using criteria from the Diagnostic and Statistical Manual of Mental Disorders, fourth edition.11
Fasting blood samples were taken and glycaemia, total cholesterol, and homocysteine concentrations were measured at a single laboratory.
Gait assessment
After the baseline home interview, participants aged ≤85 were invited to the study centre in 1999-2001, where we quantitatively evaluated walking speed. Two photoelectric cells connected to a chronometer were placed in a corridor six metres apart. Participants were first asked to walk at their usual speed and were then invited to perform the maximum walking speed test. They were asked to walk down the corridor as fast as possible without running (“Please walk as quickly as you can without running to the end of the corridor”). They could do one trial to check whether they under-stood the instructions before we measured the actual speed. In addition, participants started walking three metres before the start line so that walking speed did not include the acceleration time. Walking speed was defined as the ratio between distance and time. Outcomes
At each follow-up, we contacted participants; when we could not reach them we contacted their relatives and personal physicians to determine their vital status. In case of death we obtained hospital records and infor-mation from personal physicians. A committee
reviewed records to determine immediate and under-lying causes of death, according to ICD-10 (inter-national classification of diseases, 10th revision) codes. The committee was blinded to the results of walking speed measured once in 1999-2001.
We first considered all cause death and then defined three subgroups: cancer, cardiovascular, other causes. Cancer mortality was defined as an immediate cause of death coded by the committee between C00 and C97 and cardiovascular death as an immediate cause of death coded between I00 and I78 (including coronary heart disease, stroke, peripheral vascular disease, and other cardiovascular disease) or R960 (sudden death). Other causes of deaths included infectious diseases, digestive causes, trauma, suicide, and death of undeter-mined cause.
Statistical analyses
We excluded from our analyses participants who had conditions at baseline that were strongly associated with decreased walking speed (Parkinson’s disease, dementia, hip fracture in the previous two years, dis-abling stroke, coronary artery disease). Descriptive sta-tistics were used to describe baseline characteristics by vital status (deceased during follow-up, yes/no) and thirds of walking speed. We compared groups using Student’s t test or analysis of variance (with linear con-trasts) for continuous measures andχ2test or
Cochran-Armitage trend test for proportions. Because walking speed was strongly related to sex, we categorised it into sex dependent thirds to maintain balanced sample sizes in men and women (cut offs were defined by ter-tiles of the distributions in men and women:≤1.50 m/s, 1.51-1.84 m/s, and≥1.85 m/s in men; ≤1.35 m/s, 1.36-1.50 m/s, and >1.36-1.50 m/s women).
We calculated the cumulative incidence of death according to thirds of walking speed with the Kaplan-Meier method and compared it with the log rank test. We also computed the cumulative risk of a given cause of death taking into account other causes of death (competing risk analysis) and found similar estimates to the Kaplan-Meier ones because mortality rates were low, thus showing that competing risks are not an issue for the present analyses. We used Cox proportional hazard models to estimate hazard ratios for death and their 95% confidence intervals. The proportional hazards assumption was checked by computing Schoenfeld residuals. We tested interactions between variables by including interaction terms. Unadjusted and adjusted hazard ratios are presented. Models were initially adjusted for age and sex. We then included in the models additional covariates strongly associated with walking speed (education level, mini-mental state examination, BMI, height, baseline physi-cal activity). In the full model, we adjusted for other covariates associated with walking speed or mortality in univariate analyses (diabetes mellitus, hypertension, use of non-steroidal anti-inflammatory drugs for joint pain, use of psychotropic drugs, alcohol drinking, cigarette smoking, homocysteine concentration, dysli-pidaemia, exertional dyspnoea, peripheral artery
disease, instrumental activities of daily living, depres-sive symptoms). In sensitivity analyses, we considered walking speed as a continuous variable or used other cut points (quartiles, quintiles) to categorise walking speed to assess whether our findings were influenced by the coding of the walking speed variable. Stratified analyses were performed to assess the relation between walking speed and cardiovascular mortality in differ-ent subgroups defined by sex, median age, median BMI, hypertension, smoking, and physical activity level. In sensitivity analyses, participants who reported coronary artery disease at baseline were retained in the analyses.
All P values were two tailed, and P≤0.05 was consid-ered to be significant. All statistical analyses were per-formed with SAS version 9.1 (SAS Institute, Cary, NC, USA).
RESULTS
At baseline, 4399 participants aged 65-85 were seen at the study centre. We excluded from the analyses 722 who had one or more prevalent medical conditions strongly associated with decreased walking speed (477 with coronary artery disease, 211 with stroke, 53 with Parkinson’s disease, 38 with dementia, 12 with hip fracture). Walking speed at baseline was missing for 469 participants, who tended to be older (P<0.001) and with a higher BMI (P<0.001) than the other parti-cipants; there was no difference for other characteris-tics. All cause mortality during follow-up was not significantly higher (P=0.12) in participants without a measure of walking speed compared with those with a measure available. The mean (SD) age of the 3208 par-ticipants included in the study was 73.2 (4.6); 2085 (65%) were women. Vital status was determined for 3200 (99.8%) and missing for 8 (0.2%) at the end of the third follow-up (2005-6). During a mean (SD) fol-low-up of 5.1 (1.0) years, corresponding to 16 414 per-son years, 209 participants died (99 from cancer, 59 from cardiovascular disease, 51 from other causes).
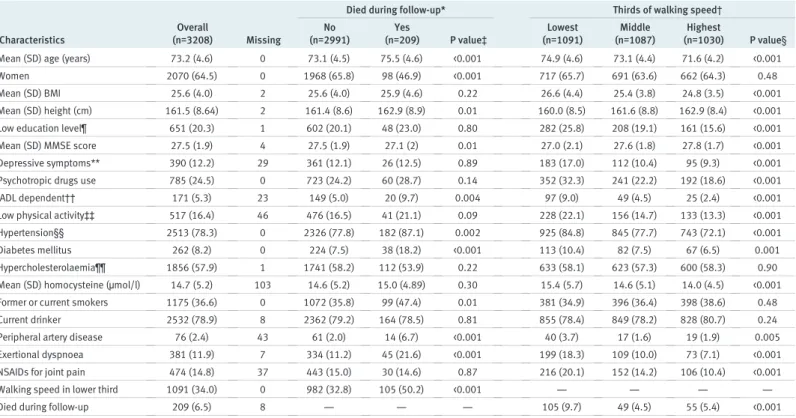
Table 1 summarises participants’ baseline charac-teristics by vital status and thirds of walking speed. Those who died during follow-up were older, taller, more often men, and had a higher prevalence of cardiovascular risk factors (diabetes mellitus, hyper-tension, smoking) compared with survivors. About half of those who died were in the lowest third of walk-ing speed, compared with one third of those who remained alive. Those in the lowest third of walking speed were older, smaller, had higher BMI, and were more likely to have depressive symptoms, less educa-tion, lower mini-mental state examination scores, and lower physical activity levels than those in the upper thirds of walking speed. They were also more likely to have hypertension or diabetes, have exertional dys-pnoea or peripheral artery disease, and die during fol-low-up (table 1). There were no significant differences in baseline characteristics according to causes of mortality (data not shown), except for chronic use of non-steroidal anti-inflammatory drugs, which was
associated with an increased cardiovascular mortality (P=0.03).
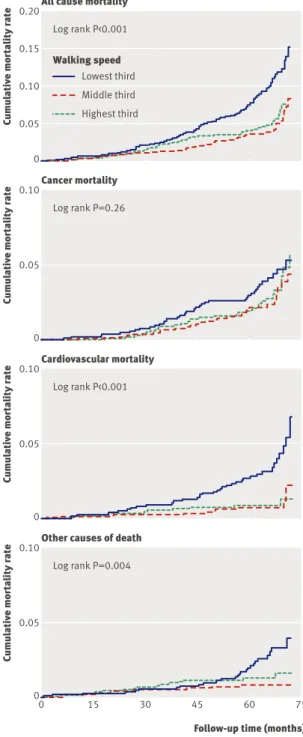
Figure 1 shows the cumulative risk of death (all cause, cancer, cardiovascular, other causes) by thirds of walking speed. There was a significant difference in all cause mortality across thirds of walking speed (log rank, P<0.001). Kaplan-Meier curves began to sepa-rate between 20 and 30 months after baseline and con-tinued to diverge afterwards. The difference in the cumulative risk of death was significant for
Follow-up time (months) All cause mortality
Cumulative mortality rate
0 15 30 45 60 75 0 0.10 0.15 0.20 Log rank P<0.001 0.05 Lowest third Walking speed Middle third Highest third Cancer mortality
Cumulative mortality rate
0 0.05 0.10
Log rank P=0.26
Cardiovascular mortality
Cumulative mortality rate
0 0.05 0.10
Log rank P<0.001
Other causes of death
Cumulative mortality rate
0 0.05 0.10
Log rank P=0.004
Fig 1| Kaplan-Meier estimates of cumulative incidence of death according to thirds of walking speed, overall and by cause of death. Cut offs (tertiles) for definition of thirds of walking speed were≤1.50 m/s, 1.51-1.84 m/s, and ≥1.85 m/s for men and≤1.35 m/s, 1.36-1.50 m/s, and >1.50 m/s for women
cardiovascular deaths (P<0.001) and other causes of death (P=0.004), while there was no significant differ-ence for cancer deaths (P=0.26). In each of these ana-lyses, there was no significant difference in the cumulative incidence of death between the middle and highest thirds of walking speed, and the increased risk of death mainly concerned those in the lowest third of walking speed. Our subsequent results are for the lowest third of walking speed compared with the two upper thirds.
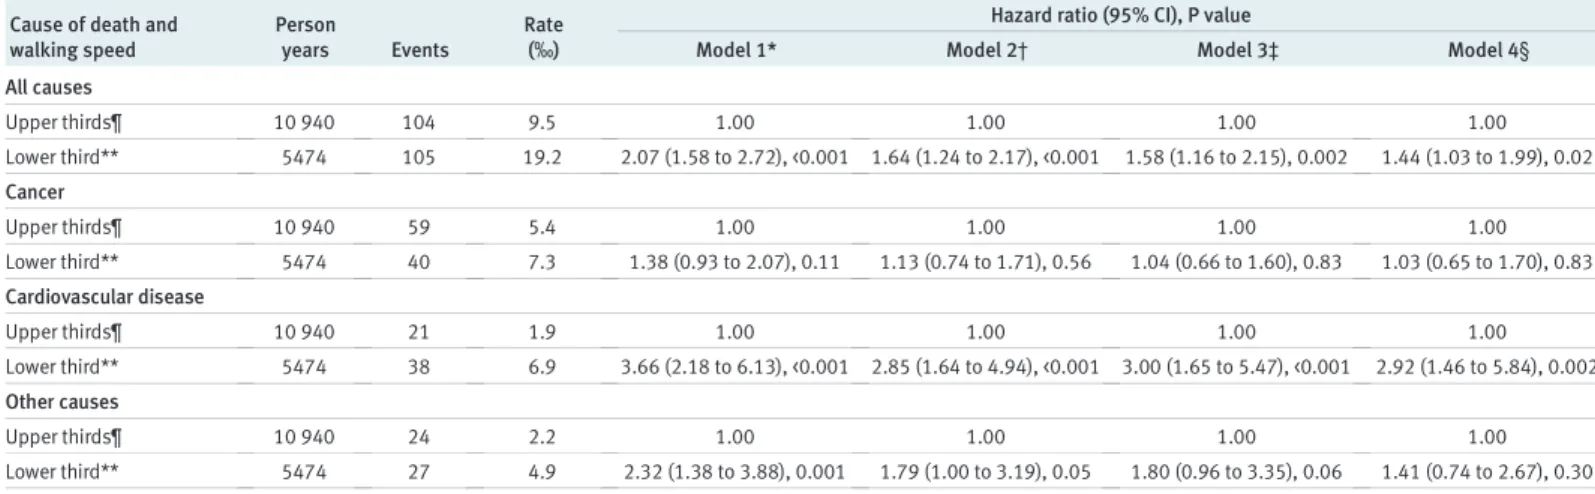
Table 2 shows multivariable analyses of the relation between walking speed and mortality. In analyses adjusted for age and sex (table 2, model 2), participants in the lowest third of walking speed had an increased risk of dying during follow-up (hazard ratio 1.64, 95% confidence interval 1.24 to 2.17) compared with those in the upper thirds; the difference in mortality was sig-nificant for cardiovascular mortality (2.85, 1.64 to 4.94) and other causes of death (1.79, 1.00 to 3.19), while there was no association with deaths from cancer (1.13, 0.74 to 1.71). After adjustment for other covari-ates associated with walking speed, the association remained significant overall and for cardiovascular mortality (table 2, model 3). Further adjustment for baseline vascular risk factors, psychotropic drug use,
exertional dyspnoea, peripheral artery disease, being dependent in at least one instrumental activity of daily living, depressive symptoms, and use of non-steroidal anti-inflammatory drugs for joint pain led to similar results (table 2, model 4). Inclusion of walking speed as a continuous variable or using other cut points (quar-tiles or quin(quar-tiles) led to similar conclusions (data not shown).
Figure 2 shows the results of stratified analyses; in each strata, hazard ratios are adjusted for age, sex, BMI, height, education level, mini-mental state exam-ination, physical activity, diabetes mellitus, hyperten-sion, use of non-steroidal anti-inflammatory drugs for joint pain, psychotropic drug use, alcohol, smoking, dyslipidaemia, exertional dyspnoea, peripheral artery disease, dependence in instrumental activities of daily living, depressive symptoms, and homocysteine level (model 4). In all strata, cardiovascular mortality was higher in the lowest third of walking speed than in the upper thirds (model 4). Interaction tests comparing the hazard ratios across the strata were not significant.
In analyses in which we excluded those who were dependent in at least one instrumental activity of daily living at baseline (171, 5.3%, table 1), the hazard ratio (model 4) was 1.50 (1.08 to 2.08) for overall
Table 1| Baseline characteristics of study sample by vital status and thirds of walking speed. Figures are numbers (percentages) unless stated otherwise
Characteristics
Overall
(n=3208) Missing
Died during follow-up* Thirds of walking speed† No
(n=2991) (n=209)Yes P value‡ (nLowest=1091) (nMiddle=1087) (nHighest=1030) P value§ Mean (SD) age (years) 73.2 (4.6) 0 73.1 (4.5) 75.5 (4.6) <0.001 74.9 (4.6) 73.1 (4.4) 71.6 (4.2) <0.001 Women 2070 (64.5) 0 1968 (65.8) 98 (46.9) <0.001 717 (65.7) 691 (63.6) 662 (64.3) 0.48 Mean (SD) BMI 25.6 (4.0) 2 25.6 (4.0) 25.9 (4.6) 0.22 26.6 (4.4) 25.4 (3.8) 24.8 (3.5) <0.001 Mean (SD) height (cm) 161.5 (8.64) 2 161.4 (8.6) 162.9 (8.9) 0.01 160.0 (8.5) 161.6 (8.8) 162.9 (8.4) <0.001 Low education level¶ 651 (20.3) 1 602 (20.1) 48 (23.0) 0.80 282 (25.8) 208 (19.1) 161 (15.6) <0.001 Mean (SD) MMSE score 27.5 (1.9) 4 27.5 (1.9) 27.1 (2) 0.01 27.0 (2.1) 27.6 (1.8) 27.8 (1.7) <0.001 Depressive symptoms** 390 (12.2) 29 361 (12.1) 26 (12.5) 0.89 183 (17.0) 112 (10.4) 95 (9.3) <0.001 Psychotropic drugs use 785 (24.5) 0 723 (24.2) 60 (28.7) 0.14 352 (32.3) 241 (22.2) 192 (18.6) <0.001 IADL dependent†† 171 (5.3) 23 149 (5.0) 20 (9.7) 0.004 97 (9.0) 49 (4.5) 25 (2.4) <0.001 Low physical activity‡‡ 517 (16.4) 46 476 (16.5) 41 (21.1) 0.09 228 (22.1) 156 (14.7) 133 (13.3) <0.001 Hypertension§§ 2513 (78.3) 0 2326 (77.8) 182 (87.1) 0.002 925 (84.8) 845 (77.7) 743 (72.1) <0.001 Diabetes mellitus 262 (8.2) 0 224 (7.5) 38 (18.2) <0.001 113 (10.4) 82 (7.5) 67 (6.5) 0.001 Hypercholesterolaemia¶¶ 1856 (57.9) 1 1741 (58.2) 112 (53.9) 0.22 633 (58.1) 623 (57.3) 600 (58.3) 0.90 Mean (SD) homocysteine (µmol/l) 14.7 (5.2) 103 14.6 (5.2) 15.0 (4.89) 0.30 15.4 (5.7) 14.6 (5.1) 14.0 (4.5) <0.001 Former or current smokers 1175 (36.6) 0 1072 (35.8) 99 (47.4) 0.01 381 (34.9) 396 (36.4) 398 (38.6) 0.48 Current drinker 2532 (78.9) 8 2362 (79.2) 164 (78.5) 0.81 855 (78.4) 849 (78.2) 828 (80.7) 0.24 Peripheral artery disease 76 (2.4) 43 61 (2.0) 14 (6.7) <0.001 40 (3.7) 17 (1.6) 19 (1.9) 0.005 Exertional dyspnoea 381 (11.9) 7 334 (11.2) 45 (21.6) <0.001 199 (18.3) 109 (10.0) 73 (7.1) <0.001 NSAIDs for joint pain 474 (14.8) 37 443 (15.0) 30 (14.6) 0.87 216 (20.1) 152 (14.2) 106 (10.4) <0.001 Walking speed in lower third 1091 (34.0) 0 982 (32.8) 105 (50.2) <0.001 — — — — Died during follow-up 209 (6.5) 8 — — — 105 (9.7) 49 (4.5) 55 (5.4) <0.001
BMI=body mass index; MMSE=mini-mental state examination, IADL=instrumental activity of daily living; NSAID=non-steroidal anti-inflammatory drug. *Vital status not determined for eight people.
†Cut offs (tertiles): ≤1.50 m/s, 1.50-1.85 m/s, and ≥1.85 m/s for men and ≤1.35 m/s, 1.35-1.50 m/s, and >1.50 m/s for women. ‡χ2test for proportions and Student’s t test for continuous measures.
§Cochran-Armitage trend test for proportions and analysis of variance (linear contrasts) for continuous measures. ¶No school or primary school without diploma.
**Assessed by Center of Epidemiological Studies Depression Scale. ††Dependent for at least one activity of the Lawton IADL scale. ‡‡Defined as walking less than 1 hour/day and no sport activity.
§§Systolic blood pressure ≥140 mm Hg or diastolic blood pressure ≥90 mm Hg or intake of antihypertensive drugs. ¶¶Total cholesterol concentration ≥6.20 mmol/l or intake of lipid lowering drugs.
mortality and 3.13 (1.64 to 5.99) for cardiovascular mortality, while there was no association with other causes of death (1.21, 0.62 to 2.38) and cancer mortal-ity (1.10, 0.68 to 1.79). In sensitivmortal-ity analyses, we included participants who reported coronary artery disease at baseline and had a measurement of walking speed; our findings remained unchanged. Hazard ratios (model 4) were 1.41 (1.05 to 1.89) for overall mortality, 2.48 (1.33 to 4.62) for cardiovascular mor-tality, 1.11 (0.72 to 1.72) for cancer mormor-tality, and 1.34 (0.77 to 2.32) for other causes of death.
DISCUSSION
In this large cohort of older people living in the com-munity we found that lower walking speed at baseline
was associated with increased mortality during a five year follow-up. Participants in the lowest third of walk-ing speed had a 44% increased risk of death compared with those in the upper thirds. With regard to specific causes of death, participants in the lowest third of walk-ing speed had about a threefold increased risk of cardiovascular death, while no relation was found with cancer mortality. This increased risk of cardio-vascular death was seen in both sexes, younger as well as in older participants, those with or without a high risk vascular profile, and those with low or usual physical activity.
Findings in context and possible mechanisms
Few studies have investigated the relation between walking speed and mortality, and their methods were not uniform.13One study found that regular walking
speed below 1 m/s was associated with mortality in older people,7and another study found that a measure
of walking speed alone provided information on mor-tality similar to that provided by a more complex eva-luation of physical performance.8 It was unknown,
however, whether specific causes of death accounted for this increased mortality. Our results show that the increased mortality observed in slow walkers was mostly cardiovascular mortality. Other causes of death tended to be higher in people with lower walking speed, but the relatively low number of events did not allow detailed analyses. Additionally, after adjustment for covariates associated with walking speed or death, the association between walking speed and other causes of death was considerably attenuated. Stratified analyses showed that the excess cardiovascular mortal-ity among people who walked more slowly was observed in different subgroups. The relation between walking speed and mortality was not explained by inclusion of participants who were dependent in at least one instrumental activity of daily living at
Table 2| Relation between walking speed and risk of death, overall and from specific causes
Cause of death and walking speed
Person
years Events
Rate (‰)
Hazard ratio (95% CI), P value
Model 1* Model 2† Model 3‡ Model 4§
All causes Upper thirds¶ 10 940 104 9.5 1.00 1.00 1.00 1.00 Lower third** 5474 105 19.2 2.07 (1.58 to 2.72), <0.001 1.64 (1.24 to 2.17), <0.001 1.58 (1.16 to 2.15), 0.002 1.44 (1.03 to 1.99), 0.02 Cancer Upper thirds¶ 10 940 59 5.4 1.00 1.00 1.00 1.00 Lower third** 5474 40 7.3 1.38 (0.93 to 2.07), 0.11 1.13 (0.74 to 1.71), 0.56 1.04 (0.66 to 1.60), 0.83 1.03 (0.65 to 1.70), 0.83 Cardiovascular disease Upper thirds¶ 10 940 21 1.9 1.00 1.00 1.00 1.00 Lower third** 5474 38 6.9 3.66 (2.18 to 6.13), <0.001 2.85 (1.64 to 4.94), <0.001 3.00 (1.65 to 5.47), <0.001 2.92 (1.46 to 5.84), 0.002 Other causes Upper thirds¶ 10 940 24 2.2 1.00 1.00 1.00 1.00 Lower third** 5474 27 4.9 2.32 (1.38 to 3.88), 0.001 1.79 (1.00 to 3.19), 0.05 1.80 (0.96 to 3.35), 0.06 1.41 (0.74 to 2.67), 0.30 *Unadjusted model. †Adjusted for age and sex.
‡Adjusted for variables included in previous model plus body mass index (BMI), height, education level, mini-mental state examination, and physical activity.
§Adjusted for variables included in previous model plus diabetes mellitus, hypertension, use of non-steroidal anti-inflammatory drugs for joint pain, psychotropic drug use, alcohol, smoking, dyslipidaemia, exertional dyspnoea, peripheral artery disease, dependence for at least one instrumental activity of daily living, depressive symptoms, and homocysteine concentration. ¶Reference.
**Cut off for walking speed:≤1.50 m/s for men and ≤1.35 m/s for women.
Men Women Age ≤73 Age >73 BMI ≤25.2 BMI >25.2 No hypertension Hypertension Never smokers
Former and current smokers Low physical activity Usual physical activity
2.45 (1.08 to 5.10) 3.57 (1.17 to 10.84) 3.47 (1.03 to 11.71) 2.61 (1.23 to 5.54) 2.51 (1.00 to 6.39) 3.66 (1.43 to 9.33) 4.88 (1.18 to 20.29) 2.48 (1.19 to 5.18) 2.39 (1.05 to 5.46) 4.87 (1.66 to 14.30) 4.08 (0.83 to 20.08) 2.84 (1.37 to 5.85) 36 23 19 40 28 31 16 43 35 24 13 40 0.5 1 2 5 20
Subgroup Hazard ratio
(95% CI)
Hazard ratio (95% CI) No who
died
Fig 2| Walking speed in lowest third and risk of cardiovascular death: stratified analyses. Hazard ratios estimate relative risk of cardiovascular death in those in lowest third of walking speed (≤1.50 m/s for men; ≤1.35 m/s for women) compared with those in two highest thirds (reference group)
baseline because their proportion was low and ana-lyses restricted to non-dependent participants were comparable with the overall analyses.
In a previous study, performance of long distance walking in a corridor was associated with cardio-vascular events.14Measures of walking speed over a
short distance and long distance corridor walking tests are not readily comparable. Long distance walk-ing tests measure features such as endurance, fatigabil-ity, and cardiovascular fitness that are not assessed through short distance measures of walking speed.15
Our results are also in line with previous studies report-ing an association between increased cardiovascular mortality and low cardiorespiratory fitness16 or low
physical activity.17Measures of walking speed over a
distance of six metres are easier to implement in rou-tine clinical practice and represent objective measures that can be assessed repeatedly; they can be performed in a few seconds in nearly all older people living in the community, while tests of long distance walking require around eight minutes and cannot be performed by a sizeable proportion of older people.
A possible explanation for the association between low walking speed and cardiovascular mortality is that chronic exposure to vascular risk factors is associated with both increased cardiovascular mortality and decreased walking speed. Until recently, the relation between vascular risk factors and motor performances received little attention, but there is some evidence in favour of an association. Increased thickness of the car-otid artery intima media10and raised homocysteine
concentrations18have been reported to be associated
with low walking speed, while raised high density lipo-protein cholesterol concentrations have been reported to be associated with higher walking speed.19Recent
studies have shown an association between perfor-mance measures and inflammatory markers,20 and
inflammation is suspected to play a role in cardio-vascular disease.21 Diabetes mellitus has been
asso-ciated with symptoms of mild parkinsonism in older people,22suggesting the involvement of deep cerebral
lesions. These associations might be mediated by sub-clinical cerebrovascular disease in patients with vascu-lar risk factors.23-27
Alternative explanations are possible. Low walking speed might result from the peripheral effect of vascu-lar risk factors—for example, heart failure or periph-eral artery disease.28Adjustment for these conditions,
however, did not modify the association between lower walking speed and cardiovascular mortality. We should also consider that low physical activity, which was associated with decreased walking speed, might increase the prevalence of vascular risk factors such as hypertension29or diabetes mellitus.30
How-ever, the association remained after adjustment for, or stratification by, level of physical activity.
Strengths and limitations
The low proportion of participants who were lost to follow-up (eight out of 3208) is one of the main strengths of this study. Other strengths include the large number of person years and an automated mea-sure of walking speed using photoelectric cells, which ensures high reproducibility of the measure.
There are limitations to consider. The 3C cohort was volunteer based and not representative of the general population. Participants were community dwelling, well functioning older people who were able to come by themselves to the study centre. Although this is likely to lead to an underestimation of the incidence of events such as death, it has been shown that, in this setting, the relation between baseline exposure and incidence of disease during follow-up is not biased.31
Increased cardiovascular mortality was present only for participants in the lowest third of walking speed, suggesting a threshold effect. The number of cardio-vascular deaths, however, did not allow us to deter-mine a more precise cut off.
Conclusion
In summary, lower walking speed was strongly asso-ciated with cardiovascular mortality in a population of well functioning older people. These findings show that assessment of motor performances in older people with simple measures such as walking speed can be performed easily and that the role of fitness in preser-ving life and function in older age is important.
Contributors: JD conducted the statistical analyses under the supervision of AE. All authors participated in designing the analyses, interpreting the results, and writing the manuscript. All authors had full access to the data and are guarantors for the study.
Funding: The 3C study is conducted under a partnership agreement between the Institut National de la Santé et de la Recherche Médicale (INSERM), the Victor Segalen-Bordeaux II University, and the Sanofi-Synthélabo Company. The Fondation pour la Recherche Médicale funded the preparation and initiation of the study. The 3C study is also supported by the Caisse Nationale Maladie des Travailleurs Salariés, Direction Générale de la Santé, Haute Autorité de la Santé, Institut National de Prévention et d’Education pour la Santé (INPES), Conseils Régionaux of Bourgogne, Fondation de France, Ministry of Research-INSERM Program, “Cohortes et collections de données biologiques,” Mutuelle Générale de l’Education Nationale, Institut de la Longévité, Conseil Général de la Côte d’or. JD was supported by a PhD scholarship from the Fondation pour la Recherche Médicale. The funding organisations played no role in the design and conduct of the study, in the collection, management, analysis, and interpretation of the data, or in the preparation, review, or approval of the manuscript.
Competing interests: None declared.
Ethical approval: The study was approved by the ethical committee of the University Kremlin-Bicêtre Hospital; each participant signed an informed consent form.
Data sharing: No additional data available.
WHAT IS ALREADY KNOWN ON THIS TOPIC
Walking speed is a simple and reliable measure that is considered as a surrogate for overall quality of gait and motor function in older people
Decreased walking speed has been shown to be associated with several adverse health related events, including death
WHAT THIS STUDY ADDS
Participants with a walking speed in the lower third of the distribution had about a threefold increased risk of cardiovascular death, but no increased risk of mortality from cancer or other causes of death
1 Hall WJ. Update in geriatrics. Ann Intern Med 2006;145:538-43. 2 Barak Y, Wagenaar RC, Holt KG. Gait characteristics of elderly people
with a history of falls: a dynamic approach. Phys Ther 2006;86:1501-10.
3 Morita M, Takamura N, Kusano Y, Abe Y, Moji K, Takemoto T, et al. Relationship between falls and physical performance measures among community-dwelling elderly women in Japan. Aging Clin Exp Res 2005;17:211-6.
4 Guralnik JM, Ferrucci L, Pieper CF, Leveille SG, Markides KS, Ostir GV, et al. Lower extremity function and subsequent disability: consistency across studies, predictive models, and value of gait speed alone compared with the short physical performance battery. J Gerontol A Biol Sci Med Sci 2000;55:M221-31.
5 Montero-Odasso M, Schapira M, Soriano ER, Varela M, Kaplan R, Camera LA, et al. Gait velocity as a single predictor of adverse events in healthy seniors aged 75 years and older. J Gerontol A Biol Sci Med Sci 2005;60:1304-9.
6 Penninx BW, Ferrucci L, Leveille SG, Rantanen T, Pahor M, Guralnik JM. Lower extremity performance in nondisabled older persons as a predictor of subsequent hospitalization. J Gerontol A Biol Sci Med Sci 2000;55:M691-7.
7 Cesari M, Kritchevsky SB, Penninx BW, Nicklas BJ, Simonsick EM, Newman AB, et al. Prognostic value of usual gait speed in well-functioning older people—results from the health, aging and body composition study. J Am Geriatr Soc 2005;53:1675-80.
8 Ostir GV, Kuo YF, Berges IM, Markides KS, Ottenbacher KJ. Measures of lower body function and risk of mortality over 7 years of follow-up. Am J Epidemiol 2007;166:599-605.
9 Liston R, Mickelborough J, Bene J, Tallis R. A new classification of higher level gait disorders in patients with cerebral multi-infarct states. Age Ageing 2003;32:252-8.
10 Elbaz A, Ripert M, Tavernier B, Fevrier B, Zureik M, Gariepy J, et al. Common carotid artery intima-media thickness, carotid plaques, and walking speed. Stroke 2005;36:2198-202.
11 The 3C Study Group. Vascular factors and risk of dementia: design of the three-city study and baseline characteristics of the study population. Neuroepidemiology 2003;22:316-25. 12 Radloff LS. The CES-D scale: a self report depression scale for
research in the general population. Appl Psychol Meas 1977;1:385-401.
13 Graham JE, Ostir GV, Kuo YF, Fisher SR, Ottenbacher KJ. Relationship between test methodology and mean velocity in timed walk tests: a review. Arch Phys Med Rehabil 2008;89:865-72.
14 Newman AB, Simonsick EM, Naydeck BL, Boudreau RM, Kritchevsky SB, Nevitt MC, et al. Association of long-distance corridor walk performance with mortality, cardiovascular disease, mobility limitation, and disability. JAMA 2006;295:2018-26.
15 Dobkin BH. Short-distance walking speed and timed walking distance: redundant measures for clinical trials? Neurology 2006;66:584-6.
16 Wei M, Kampert JB, Barlow CE, Nichaman MZ, Gibbons LW, Paffenbarger RS Jr, et al. Relationship between low cardiorespiratory fitness and mortality in normal-weight, overweight, and obese men. JAMA 1999;282:1547-53.
17 Nocon M, Hiemann T, Muller-Riemenschneider F, Thalau F, Roll S, Willich SN. Association of physical activity with all-cause and cardiovascular mortality: a systematic review and meta-analysis. Eur J Cardiovasc Prev Rehabil 2008;15:239-46.
18 Soumare A, Elbaz A, Ducros V, Tavernier B, Alperovitch A, Tzourio C. Cross-sectional association between homocysteine and motor function in the elderly. Neurology 2006;67:985-90.
19 Volpato S, Ble A, Metter EJ, Lauretani F, Bandinelli S, Zuliani G, et al. High-density lipoprotein cholesterol and objective measures of lower extremity performance in older nondisabled persons: the InChianti study. J Am Geriatr Soc 2008;56:621-9.
20 Cesari M, Penninx BW, Pahor M, Lauretani F, Corsi AM, Rhys Williams G, et al. Inflammatory markers and physical performance in older persons: the InCHIANTI study. J Gerontol A Biol Sci Med Sci 2004;59:242-8.
21 Ridker PM, Hennekens CH, Buring JE, Rifai N. C-reactive protein and other markers of inflammation in the prediction of cardiovascular disease in women. N Engl J Med 2000;342:836-43.
22 Arvanitakis Z, Wilson RS, Bienias JL, Bennett DA. Diabetes and parkinsonian signs in older persons. Alzheimer Dis Assoc Disord 2007;21:144-9.
23 Soumare A, Elbaz A, Zhu Y, Maillard P, Crivello F, Tavernier B, et al. White matter lesions volume and motor performances in the elderly. Ann Neurol 2009;65:706-15.
24 Wolfson L, Wei X, Hall CB, Panzer V, Wakefield D, Benson RR, et al. Accrual of MRI white matter abnormalities in elderly with normal and impaired mobility. J Neurol Sci 2005;232:23-7.
25 Rosano C, Brach J, Longstreth Jr WT, Newman AB. Quantitative measures of gait characteristics indicate prevalence of underlying subclinical structural brain abnormalities in high-functioning older adults. Neuroepidemiology 2006;26:52-60.
26 Rosano C, Sigurdsson S, Siggeirsdottir K, Phillips CL, Garcia M, Jonsson PV, et al. Magnetization transfer imaging, white matter hyperintensities, brain atrophy and slower gait in older men and women. Neurobiol Aging 2008 Sep 5 [Epub ahead of print]. 27 Baezner H, Blahak C, Poggesi A, Pantoni L, Inzitari D, Chabriat H, et al.
Association of gait and balance disorders with age-related white matter changes: the LADIS study. Neurology 2008;70:935-42. 28 McDermott MM, Liu K, Ferrucci L, Criqui MH, Greenland P,
Guralnik JM, et al. Physical performance in peripheral arterial disease: a slower rate of decline in patients who walk more. Ann Intern Med 2006;144:10-20.
29 Beunza JJ, Martinez-Gonzalez MA, Ebrahim S, Bes-Rastrollo M, Nunez J, Martinez JA, et al. Sedentary behaviors and the risk of incident hypertension: the SUN Cohort. Am J Hypertens 2007;20:1156-62.
30 Hu FB, Li TY, Colditz GA, Willett WC, Manson JE. Television watching and other sedentary behaviors in relation to risk of obesity and type 2 diabetes mellitus in women. JAMA 2003;289:1785-91.
31 Criqui MH. Response bias and risk ratios in epidemiologic studies. Am J Epidemiol 1979;109:394-9.