Cortical responses to dynamic emotional facial
expressions generalize across stimuli, and are sensitive
to task-relevance, in adults with and without Autism
The MIT Faculty has made this article openly available.
Please share
how this access benefits you. Your story matters.
Citation
Kliemann, Dorit et al. "Cortical responses to dynamic emotional
facial expressions generalize across stimuli, and are sensitive to
task-relevance, in adults with and without Autism." Cortex 103 (June
2018): 24-43 © 2018 Elsevier Ltd
As Published
http://dx.doi.org/10.1016/j.cortex.2018.02.006
Publisher
Elsevier BV
Version
Author's final manuscript
Citable link
https://hdl.handle.net/1721.1/126685
Terms of Use
Creative Commons Attribution-NonCommercial-NoDerivs License
Cortical responses to dynamic emotional facial expressions
generalize across stimuli, and are sensitive to task-relevance, in
adults with and without Autism
Dorit Kliemann1, Hilary Richardson2, Stefano Anzellotti2, Dima Ayyash2, A.J. Haskins2, John D.E. Gabrieli1, and Rebecca R. Saxe2
1McGovern Institute for Brain Research, Massachusetts Institute of Technology, 43 Vassar St, Cambridge, MA 02139, USA
2Department of Brain and Cognitive Sciences, Massachusetts Institute of Technology, 43 Vassar St, Cambridge, MA 02139, USA
Abstract
Individuals with Autism Spectrum Disorders (ASD) report difficulties extracting meaningful information from dynamic and complex social cues, like facial expressions. The nature and mechanisms of these difficulties remain unclear. Here we tested whether that difficulty can be traced to the pattern of activity in “social brain” regions, when viewing dynamic facial
expressions. In two studies, adult participants (male and female) watched brief videos of a range of positive and negative facial expressions, while undergoing functional magnetic resonance imaging (Study 1: ASD n=16, control n=21; Study 2: ASD n=22, control n=30). Patterns of hemodynamic activity differentiated among facial emotional expressions in left and right superior temporal sulcus, fusiform gyrus, and parts of medial prefrontal cortex. In both control participants and high-functioning individuals with ASD, we observed (i) similar responses to emotional valence that generalized across facial expressions and animated social events; (ii) similar flexibility of
responses to emotional valence, when manipulating the task-relevance of perceived emotions; and (iii) similar responses to a range of emotions within valence. Altogether, the data indicate that there was little or no group difference in cortical responses to isolated dynamic emotional facial expressions, as measured with fMRI. Difficulties with real-world social communication and social interaction in ASD may instead reflect differences in initiating and maintaining contingent interactions, or in integrating social information over time or context.
Keywords
social cognition; fMRI; emotional faces; MVPA; Autism
Corresponding Author: Dorit Kliemann, 43 Vassar Street, 46-4021, Cambridge, MA 02139, USA, dorit@mit.edu, 617-324-2891. Publisher's Disclaimer: This is a PDF file of an unedited manuscript that has been accepted for publication. As a service to our
customers we are providing this early version of the manuscript. The manuscript will undergo copyediting, typesetting, and review of the resulting proof before it is published in its final citable form. Please note that during the production process errors may be
HHS Public Access
Author manuscript
Cortex
. Author manuscript; available in PMC 2019 June 01.Published in final edited form as:
Cortex. 2018 June ; 103: 24–43. doi:10.1016/j.cortex.2018.02.006.
A
uthor Man
uscr
ipt
A
uthor Man
uscr
ipt
A
uthor Man
uscr
ipt
A
uthor Man
uscr
ipt
1. INTRODUCTION
Humans are generally highly sensitive to social cues from other people: we can infer a friend’s disappointment in a turn of the head, a shift of the eyes, a purse of the lips. While such sensitivity is seemingly effortless for most people, individuals with Autism Spectrum Disorder struggle disproportionately with social communication and social interaction ( American Psychological Adolphs, 2006; Association, 2013). Here, we tested the hypothesis that social impairments in ASD reflect a disruption of neural mechanisms for extracting relevant social information from brief, dynamic, naturalistic facial expressions. Capturing the scope and sophistication of human social perception within a laboratory task is a serious challenge. Observers can easily distinguish posed exaggerated facial expressions of a few basic emotions (e.g. happy vs. sad vs. afraid), but in natural interactions,
expressions are dynamic, mixed, and variable, even within valence (Zaki & Ochsner, 2009). To understand others’ emotions, observers must be able to attend to and extract the relevant information from highly variable stimuli (Adolphs, 2006), and integrate facial expressions with additional information from the context (Aviezer, Bentin, Dudarev, & Hassin, 2011). In healthy individuals, multiple cortical regions appear implicated in these aspects of emotion understanding. Emotional facial expressions elicit distinct patterns of activity in the fusiform face area (FFA, e.g., Harry, Williams, Davis, & Kim, 2013), in parts of the superior temporal sulcus (STS, e.g., Said, Moore, Norman, Haxby, & Todorov, 2010), and in the medial prefrontal cortex (MPFC, e.g., Chavez & Heatherton, 2015). The FFA is sensitive to configurations of facial features (Liu, Harris, & Kanwisher, 2010), but parts of STS and MPFC also integrate emotional information from body postures, vocal tones (Peelen, Atkinson, & Vuilleumier, 2010) and the surrounding context (Skerry & Saxe, 2014). Responses in all of these regions are modulated by whether emotions are currently task-relevant for the observer (Kliemann, Jacoby, Anzellotti, & Saxe, 2016). Disruption in these functional networks could cause difficulties in social perception and social interaction. Individuals with Autism Spectrum Disorders often (but not always) show impairments on recognition of emotional facial expressions (Harms et al., 2010; Uljarevic and Hamilton, 2013). These impairments appear to be especially marked when facial expressions are dynamic and naturalistic (Pelphrey, Morris, McCarthy, & Labar, 2007), and when combining cues from faces and from the surrounding context (Rosenblau, Kliemann, Heekeren, & Dziobek, 2015). In addition, individuals with ASDs may show altered social attention, which could affect their ability to endogenously direct attention to social aspects of stimuli or situations (Wang et al., 2015).
The neural source of these impairments has been difficult to ascertain. Many previous studies have measured the magnitude of hemodynamic responses in the brain, while individuals with ASD viewed emotional or dynamic faces. Unfortunately, the results have been highly heterogeneous, with some studies finding hypo-activation, some finding hyper-activation, and some finding no group difference in the FFA, STS and MPFC (Alaerts et al., 2014; Boelte et al., 2015; Hadjikhani et al., 2014; Rahko et al., 2012; Scherf, Elbich, Minshew, & Behrmann, 2015; Schneider et al., 2013; Weisberg et al., 2014). Explicit instructions to attend to emotional faces also yield conflicting results, with some studies
A
uthor Man
uscr
ipt
A
uthor Man
uscr
ipt
A
uthor Man
uscr
ipt
A
uthor Man
uscr
ipt
finding no group differences during explicit social tasks (Boelte et al., 2015; Kana, Patriquin, Black, Channell, & Wicker, 2016; Schneider et al., 2013), and other studies finding no difference in the same regions in the absence of a task (e.g., Pantelis, Byrge, Tyszka, Adolphs, & Kennedy, 2015). One possibility is that the average magnitude of response in FFA, STS, and MPFC is not a straightforward measure of social information processing. The magnitude of hemodynamic activity in a region likely reflects a mix of distinct cognitive and neural factors (e.g. effort, prediction error, domain specificity, sparse coding, etc). Multivariate patterns of activity sometimes offer a more sensitive measure of the information represented in a brain region than univariate analyses (Haxby et al., 2001; Koster-Hale, Saxe, Dungan, & Young, 2013) and therefore could reveal differences between groups (Coutanche, Thompson-Schill, & Schultz, 2011).
Here, in two studies, we measured the extraction of emotion-relevant information from dynamic facial expressions using multivariate pattern analyses. In study 1, participants viewed naturalistic movie clips of emotional expressions from 96 different individuals. We tested the degree to which cortical regions extracted valence, a fundamental emotionally-relevant dimension (Russel, 1980), from these stimuli; and whether the pattern of activity also generalized to a completely different emotional stimulus (animated events). In study 2, participants viewed more exaggerated expressions of 10 emotions from 20 actors. Again, we tested whether cortical regions extracted the valence of the expressions (as well as the finer grained structure); and we additionally tested whether these responses were modulated by the participant’s endogenous attention. To increase the power of our analyses, where possible we combined data from the two studies (for a total of 89 datasets from 80
participants). In sum, these experiments provide multiple metrics of the scope and flexibility of cortical representations of facial emotional expressions, and therefore should provide a sensitive test of the hypothesis that social impairments in individuals with ASD reflect difficulty extracting socially relevant features from dynamic events.
2. MATERIALS and METHODS
2. 1 ParticipantsIn Study 1, we recruited 18 participants diagnosed with Autism Spectrum Disorder and 21 neurotypically-developed adults (NT) with otherwise no history of neurological or psychiatric disorders. The control participants’ data is re-analyzed from Saxe & Skerry (2014). In Study 2, we recruited 24 participants diagnosed with Autism Spectrum Disorder and 32 neurotypically-developed adults with no other history of neurological disorders. Nine participants (1 NT, 8 ASD) participated in both studies. We excluded two ASD participants in Study 1 and two in Study 2 (n = 3 excessive in-scanner head motion, n = 1 low
performance in the task (see section 3)). Two NT participants scored above the cut-off value on the Autism Spectrum Quotient (> 31, Baron-Cohen, Wheelwright, Skinner, Martin, & Clubley, 2001) and were excluded. The final data set included 21 NT and 16 ASD in Study1 and 30 NT and 22 ASD in Study 2. Table 2 shows the demographics of this final sample. In Study 1, all participants were right-handed, whereas Study 2 included left-handed
participants (NT: n = 4, 4 males; ASD: n = 4, 2 females, 2 males).
A
uthor Man
uscr
ipt
A
uthor Man
uscr
ipt
A
uthor Man
uscr
ipt
A
uthor Man
uscr
ipt
All but one participant with a previous clinical diagnosis of ASD were assessed using the Autism Diagnostic Observation Schedule (ADOS-2, see table 1 for scales) by research-reliable administrators in order to confirm the diagnosis (Lord et al., 2012). For the second study, we additionally assessed current and prior history of psychiatric conditions, as well as medication status (see supplementary materials for details).
All participants were verbally fluent with average to above-average intellectual ability, as measured by the Kauffman Brief Intelligence Test, Second Edition (KBIT-2), (Kaufman, 2004). All subjects had normal or corrected-to-normal vision, were paid for participation and gave written informed consent prior to participating, in accordance with the Committee on the Use of Human Experimental Subjects (COUHES) at the Massachusetts Institute of Technology (MIT).
2.2. Social Attribution Tasks
In both studies, participants made judgments about social attributes in the scanner (see Figure 1).
2.2.1 Study 1: Emotion Attribution Task—Participants watched 384 short video clips. Half of the videos included faces expressing a positive (happy/smiling) or negative (sad/ frowning) emotion (expressions condition), and the other half were brief animations in which a simple geometric character experienced an event that would elicit a positive or negative emotion (situations condition). The facial expressions were clips from movies, with the constraint that each clip showed a continuous close-up of one character, expressing an unambiguous emotional expression. Characters were either male or female and showed positive or negative expressions. The situations were animated interactions between characters shown as simple geometric shapes. The shapes had eyes but no other facial features, and did not change configuration in response to the events (i.e. they did not make emotional expressions). A single target character, distinguished by color, acted to achieve a physical goal (climb a hill, retrieve an object) or social goal (inclusion in a group); the character either succeeded or failed in this goal. For further details on the stimuli, please see Skerry & Saxe (2014).
After each video, participants simply indicated the intensity of the target’s emotion independent of valence, by pressing 1 of 4 buttons (1 to 4, neutral to extreme). Participants were not required to classify the emotion.
The experiment consisted of 8 runs (9.43min/run). Each run contained 12 stimuli in each of the 4 conditions ([positive or negative] × [expressions or situations]), resulting in a total number of 48 stimuli per condition (over runs). Each condition included 24 distinct video clips, each presented twice; the second presentation was horizontally (i.e., left vs. right) flipped to increase the number of stimuli. Clips were presented at the center of the screen for 4 seconds, followed by a 1750ms response window, and a 250ms blank screen. The clips were presented in a jittered, event-related design and a central fixation cross was presented between trials with a variable inter-stimulus interval of 0–14 seconds (average 8s). Stimulus presentation schedules used a first-order counterbalancing constraint such that each
condition preceded each other with approximately equal probability across the experiment.
A
uthor Man
uscr
ipt
A
uthor Man
uscr
ipt
A
uthor Man
uscr
ipt
A
uthor Man
uscr
ipt
Condition assignments to positions within this sequence were randomized across
participants. The order of individual stimulus clips for a given condition was chosen pseudo-randomly for each participant, with the constraint that repetitions of each stimulus occurred in the same even-odd folds as the first presentation (e.g. an event first presented in run 2 would be repeated in run 6, and an event presented in run 3 would be repeated in run 7). The last trial in each run ended with the presentation of a blank screen for 12s, resulting in a total run time of 595s.
2.2.2 Study 2: Emotion/Age Attribution Task—Participants watched 192 short movie clips of dynamic facial expressions and judged the valence of the emotional expression (emotion task: positive versus negative) or, to direct attention away from emotions, judged the individual’s age (age task: over versus under 30 years old). We chose 20 actors (10 males, 10 females) expressing 10 different emotional states (5 positive (amused, thankful, enthusiastic, happy, confident), 5 negative (disgusted, angry, worried, sad, furious)) from a larger set of stimuli (for details on the stimuli production, see Kliemann, Rosenblau, Bolte, Heekeren, & Dziobek, 2013). For each participant, 192 videos were drawn from the resulting set of 200. Half of the actors in each gender category were ‘older adults’ and the other half ‘younger adults’. An independent MTurk study validated that participants could readily discern the emotional valence, and the actors’ age range (‘over 30 years’ vs. ‘under 30 years’), and viewed the emotions as equivalently “believable” across age and valence. The videos were presented over 6 runs, each containing 32 trials per run (16 positive, 16 negative). Each trial started with a task-prompt screen indicating the task (emotion vs. age) for a given trial, presented for varying durations (4 – 12s, mean = 8s). The clips were presented at fixation for 4s, followed by 250ms blank and 1.75s response screen. Prompts were presented in two formats: three letters (emotion task: "EMO"; age task: "AGE") or iconic symbols (emotion task: smiling and sad emoticons; age task: small and bigger neutral emoticon; see Fig. 1). Response screens were identical for both task conditions, consisting of a plus and a minus symbol (emotion task: plus = positive, minus = negative; age task: plus = ‘over 30’, minus = ‘under 30’), and their position was randomized across trials.
Participants responded by pressing the left or right button. The next trial started immediately after the response screen. Presentation order of the four main conditions (positive/negative expression, older/younger character) within each and over all runs was optimized using Optseq2 (https://surfer.nmr.mgh.harvard.edu/optseq/) with a first-order counterbalancing constraint. The order of items within a scheduled condition was then pseudo-randomized across runs, with the constraint that each movie clip was presented once in each task condition over runs. Ordering of response option arrangement, gender of the face, and task prompt format were balanced within runs (i.e. each run had the same number of females, symbol prompts, etc.). The last trial in each run ended with the presentation of a blank screen for 12s, resulting in a total run time of 492s.
Participants were trained on the tasks and completed one practice run before the scan, with different clips, to ensure understanding of task and response requirements.
A
uthor Man
uscr
ipt
A
uthor Man
uscr
ipt
A
uthor Man
uscr
ipt
A
uthor Man
uscr
ipt
2.3 Localizer Tasks
In both studies, participants also completed localizer tasks (theory of mind (Dodell-Feder, Koster-Hale, Bedny, & Saxe, 2011) and face localizer (Hariri, Bookheimer, & Mazziotta, 2000; Pitcher, Dilks, Saxe, Triantafyllou, & Kanwisher, 2011)) reported in detail elsewhere. In addition to the main Regions of Interest (ROI) and voxel selection process (see below), we conducted a secondary analysis in which the localizer data (rather than the facial expressions data) were used for the feature selection process (see Supplementary Material). The results confirm the main MVPA analyses and results reported here.
2.4 Behavioral Tasks
Participants in both studies performed behavioral tasks outside of the scanner to characterize intellectual functioning level (crystallized (verbal) and fluid (nonverbal) intelligence; Kaufmann Brief Intelligence Test, Second Edition (KBIT-2), Kaufman 2004)) and social functioning (level of autistic symptoms in typical populations with the Autism Spectrum Quotient (AQ; Baron-Cohen et al., 2001).
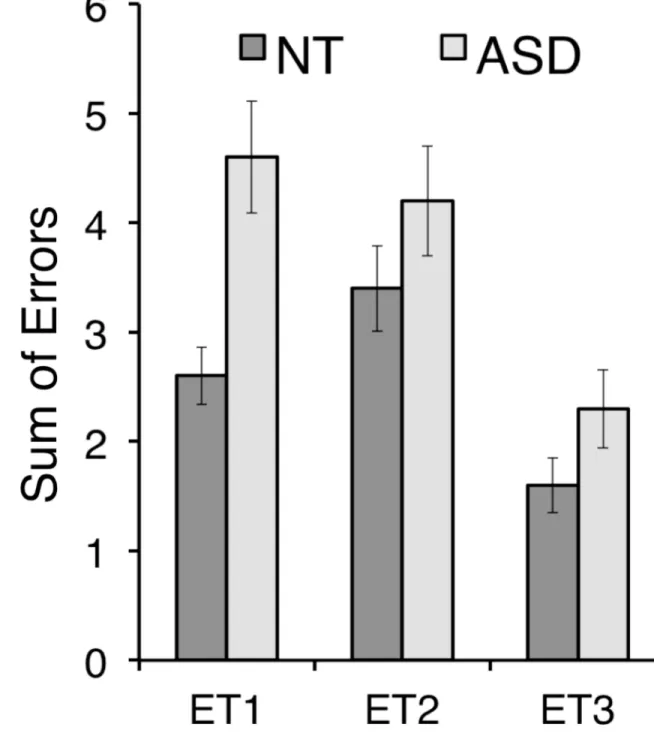
In Study 2, all participants also completed the explicit version of the Face Puzzle tasks (Kliemann et al., 2013). The task measures behavioral facial emotion recognition performance from dynamic videos including positive and negative basic, as well as more complex social emotions. Participants viewed 25 facial emotional expression videos (11 positive, 14 negative) and had to choose the correct emotional label word for the expressed emotion out of four options. The task has previously been shown to be sensitive to social impairments in ASD versus controls and is described in detail elsewhere (see Kliemann et al., 2013). This task allowed for further investigation of whether valence processing was affected at all in the ASD sample by investigating the types of errors made (i.e., an error analysis). Of the four labels, the three distractor words were designed as follows: two were of the same valence, with either close (Error Type 1, ET1) or distant (Error type 2, ET2) intensity, whereas the third distractor was of opposite valence (Error Type 3, ET3). Note that the intensity and valence ratings as the basis for the task constructions were not actual ratings for the stimuli, but ratings of the emotion words (Hepach, Kliemann, Gruneisen, Heekeren, & Dziobek, 2011).
2.5 fMRI Acquisition
Data were acquired on a 3-Tesla Tim Trio scanner (Siemens; Erlangen, Germany) at the Athinoula A. Martinos Imaging Center at the McGovern Institute for Brain Research at MIT, using a Siemens 32-channel phased-array head coil. For each subject we collected high-resolution T1-weighted anatomical images (MPRAGE, voxel size = 1×1×1 mm, TR = 2530 ms, slices = 176, FoV = 256 mm) with whole brain coverage to register functional data to individual and standard anatomy. We then collected functional images acquired with a gradient-echo EPI sequence sensitive to Blood Oxygen Level Dependent (BOLD) contrast (voxel size = 3×3×3 mm, TR = 2000 ms, TE = 30 ms, flip angle = 90 degrees, FoV = 192 mm). Slices were aligned with the anterior/posterior commissure and provided near whole-brain coverage (excluding the cerebellum).
A
uthor Man
uscr
ipt
A
uthor Man
uscr
ipt
A
uthor Man
uscr
ipt
A
uthor Man
uscr
ipt
2.6 fMRI Data Analyses
2.6.1 Preprocessing—We used SPM8 (http://www.fil.ion.ucl.ac.uk/spm/) and custom software written in Matlab (www.mathworks.com Natick, MA, USA) to analyze the MRI data. Each participant’s data were first registered to the first image of each run, then all functional runs were co-registered with each other and then with the participant’s anatomical scan. All images (functional and anatomical) were normalized to a common (Montreal Neurological Institute, EPI template) brain space. Functional images were smoothed using a Gaussian kernel filter (5mm FWHM (full-width-half-maximum)). Smoothing does not substantially affect decoding performance of multi-voxel pattern analyses (Op de Beeck, 2010; Zhang, Meeson, Welchman, & Kourtzi, 2010). Data were high-pass filtered (cut-off 128s) to remove low-frequency noise and SPM imaging scaling was applied. Functional data were further corrected for motion artifacts, defined using the ART toolbox (Whitfield-Gabrieli, Nieto-Castanon, & Ghosh, 2011) as timepoints during which motion exceeded 2mm in any direction relative to the previous timepoint or a change in global signal exceeded a threshold of three standard deviations from the mean global signal. We additionally included five PCA-based noise regressors created using CompCor (Behzadi, Restom, Liau, & Liu, 2007) within individual subject white-matter masks. Masks were eroded in all directions by two voxels, in order to prevent partial voluming. CompCor regressors were defined using scrubbed data (e.g. artifact timepoints were identified and interpolated over prior to running CompCor).
We first performed whole-brain first level analyses on each participant’s functional data by applying a general linear model (GLM) with SPM modeled as a boxcar function using a standard hemodynamic response function (HRF) matching the onset and duration of experiment specific regressors. For Study 1, data were modeled in principle with 8
regressors per run for stimulus (expressions vs. situations) × valence (positive vs. negative) × [gender (male vs female) for the expressions or story type (social vs. nonsocial) for the situations condition]. To arrive at a larger set of datapoints per training and test sets for the SVM, we created 16 ‘pseudo’ regressors from the original 8: instead of having 6 trials per 8 conditions we doubled the number of regressors and modeled 3 trials per main condition, i.e. 16. For Study 2, we modeled prompt types (word/symbol × emotion/age task) with onsets at the time of the prompt, and 8 conditions at the time of the videos: task (age vs. emotion) × expression valence (positive vs. negative) × character’s age (younger vs. older). Similarly to Study 1, we also doubled the number of regressors for Study 2 by modeling 16 ‘pseudo-condition’ regressors with 2 trials instead of 8 regressors with 4 trials. For both studies, nuisance covariates were added to the model i) for timepoints with head motion artifacts, ii) CompCor regressors, iii) to correct for run effects, and (iv) response screen. To account for variability related to reaction time, we included a parametric mean-centered regressor, with an amplitude on each trial corresponding to the trial’s reaction time. If no response was recorded on a single trial, we used the participant’s mean reaction time over all trials. For two participants in Study 1 and three participants in Study 2, fMRI data could not be analyzed for one run due to technical reasons or low overall performance in the task.
A
uthor Man
uscr
ipt
A
uthor Man
uscr
ipt
A
uthor Man
uscr
ipt
A
uthor Man
uscr
ipt
2.6.2 Logic of the Analyses—One goal of this research was to test whether, in adults with ASD, the valence of a dynamic facial expression is extracted from variable stimuli by the same cortical regions, to the same degree, as in neurotypically developed control participants. Thus, the key analysis in each experiment tested whether the pattern of activity in each cortical region (in regions of interest and a whole brain searchlight) could be used to classify the valence of the facial expression in the stimulus. For this analysis, we included only the facial expressions condition (in Study 1), and the emotion task (in Study 2). We tested for classification of valence across all participants in each study, and then separately for the ASD and control groups. Then we tested whether there were any significant differences between the two groups, in any region. To foreshadow our results, we did not find significant group differences in any ROI, in either study. We therefore combined the data from the two studies, to increase the power and sensitivity of our analyses, and again tested whether there were any group differences in the classification of valence in facial expressions.
In addition to this shared question across studies, each experiment was designed to test a separate second question. Study 1 depicted valence in both facial expressions and situations, and so was designed to test whether representations of a character’s emotional valence generalize across the format of stimulus input. We therefore also tested whether activity could be used to classify emotional valence, when training and testing on distinct stimulus formats (i.e. training on facial expressions and testing on situations, or vice versa; Skerry & Saxe 2014). We tested whether this classification showed any significant group difference: if adults with ASD construct less efficient or abstract representations of emotion, we would expect to find less robust classification of valence in ASD individuals in this generalization test. Note that the NT data in Study 1 is a re-analysis of the data presented in Saxe & Skerry (2014), however with slightly differing preprocessing and analyses (see section 2 and Supplementary Material).
Study 2 showed facial expressions of emotions while participants were instructed to attend to emotion, or to attend to a different feature, the character’s age. This experiment was designed to test whether representations of others’ emotional valence are flexible in response to the participant’s own endogenous goals. We therefore also tested whether classification of emotional valence in each brain region was task-dependent, showing better classification of valence when emotion was task-relevant than when it was task-irrelevant. We hypothesized that individuals with ASD might show less flexible social processing, and therefore less change in social representations in response to changes in the task context. If so, the difference in classification of valence between the emotion- vs. age- task should be greater in the control group than in the ASD group. Incidentally, this task design also allowed us to test whether each cortical region encoded the orthogonal stimulus feature, the character’s age, when this feature was task-relevant.
2.7 Regions of interest
Based on prior studies (Skerry & Saxe, 2014; Peelen et al. 2010), we tested five a priori regions of interest (ROIs) previously reported to contain information about the emotion/ valence of facial expressions: left posterior superior temporal cortex (lpSTC), right middle
A
uthor Man
uscr
ipt
A
uthor Man
uscr
ipt
A
uthor Man
uscr
ipt
A
uthor Man
uscr
ipt
STS (rmSTS), right fusiform face area (rFFA), as well as dorsal and middle medial prefrontal cortex (d/mMPFC).
Following Skerry and Saxe (2014), to define individual ROIs we first used group-level spatial constraints derived from previous studies. We defined the search space for dMPFC and mMPFC from a theory of mind task (Dufour et al., 2013), for rmSTS and rFFA from a face task (Julian, Fedorenko, Webster, & Kanwisher, 2012) and for lpSTC from Skerry & Saxe (2014). Within these five group-level constraints, we selected features for analysis in each individual subject.
2.8 Feature selection
fMRI data is high-dimensional, and due to its limited temporal resolution, experimental designs provide relatively small numbers of training data examples. In this context, feature selection can be useful to remove high-variance, noisy voxels from the feature set (Di Martino et al., 2009; Mitchell et al., 2004; Pereira, Mitchell, & Botvinick, 2009). We thus selected voxels (i.e. features) within each ROI using a univariate selection procedure. Within each participant and each ROI hypothesis space, we selected the 80 most active voxels based on the contrast of all movie clip stimuli > rest. This criterion is orthogonal to all between-condition classifications. Selecting a fixed number of voxels eliminates differences in the number of voxels analyzed across regions, participants or groups; the choice of this fixed number (n=80) was determined by pilot testing in an independent set of participants (as described in Skerry and Saxe 2014).
2.9 Multi-Voxel Pattern Analyses (MVPA)
We conducted multi-voxel pattern analyses (MVPA) using in-house code developed in Matlab (www.mathworks.com; Natick, MA, USA) and the publicly available Library for Support Vector Machines (LIBSVM, https://www.csie.ntu.edu.tw/~cjlin/libsvm/, Chang & Lin, 2011)
2.9.1 ROI-based MVPA—Preprocessing and modeling the fMRI data with SPM (http:// fil.ion.ucl.ac.uk/spm/) provided a voxel-wise summary (beta values) for each condition. An SVM model was used to test classification of each contrast, in each ROI and in each participant. Binary classifications were conducted with a linear kernel, using a fixed
regularization parameter (C=1) to control for training error and margin size. We used a linear kernel to perform binary classifications assuming that a linearly decodable signal represents a plausible readout mechanism for downstream neurons (Hung, Kreiman, Poggio, & DiCarlo, 2005; Seung & Sompolinsky, 1993; Shamir & Sompolinsky, 2006). Linear separability within a population can be considered a conservative yet reasonable estimate of information that is available for explicit readout (DiCarlo & Cox, 2007).
Each participant’s data were partitioned into cross-validation folds by run of data
acquisition. The classifier was trained iteratively on all runs but one (leave-one-run-out), and tested on the remaining run. Thus, training and testing were always performed on
independent subsets of the data. Classification accuracy was then averaged across runs, to obtain a single classification accuracy for each participant in each ROI.
A
uthor Man
uscr
ipt
A
uthor Man
uscr
ipt
A
uthor Man
uscr
ipt
A
uthor Man
uscr
ipt
For the multivariate analysis of the neural data we tested for above chance classification accuracy in a given region (chance = 0.5) by performing a one-sample t-test (one-tailed) across participants. To correct for multiple comparisons we adjusted the significance threshold by dividing by the number of regions tested (Bonferroni correction: five social brain ROIs gives a corrected α value of .01). To test for between group differences in valence encoding, we conducted repeated measures ANOVAs with the between-subjects factor group (ASD vs. NT) and condition specific within-subjects factors (e.g., ROI (dMPFC vs. mMPFC vs. rFFA vs. rmSTS vs. lpSTC); Study 2: task (age vs. emotion)) while adding IQ and motion as covariates. In addition to the ANOVA, we ran a linear mixed effects model with R (R Core Team, 2012; lme4, Bates, Machler, Bolker, & Walker, 2015) to test whether classification of valence was influenced by the between-subjects factor group (ASD vs. NT) or interactions between group and any other factor,(study (Study 1 vs. Study 2), handedness (left vs. right), sex (female vs. male) and the within-subjects factors ROI (dMPFC vs. mMPFC vs. rFFA, vs. rmSTS vs. lpSTC), IQ, and head motion). The model additionally included Subject ID as a random effect. For further details on the linear mixed effects model, please refer to the results section and table 4.
In addition to standard null hypothesis testing, we include a Bayesian procedure to explicitly compare the evidence in favor or against the null hypothesis (no group difference). To this end, we used publicly available code (http://cognitivegenetic.rutgers.edu/ptn/; Gallistel, 2009) to test the likelihood that two datasets come from the same distribution (null hypothesis) or from different distributions (alternative hypothesis). In short, we estimated the Bayes Factor (odds) against and for a group difference in classification accuracy of valence, along with the weight (log base 10 of the Bayes Factor) of evidence. Given the natural bounds of classification accuracy in the context of our study (theoretically ranging from 0–100 as possible values), we used 0 and 100 as upper and lower analytical limits. Using a two-tailed hypothesis, we assumed that the mean of the experimental (i.e. ASD) data lies within the interval of the true mean of the control (i.e., NT) data +/−50, hence limiting our incremental prior to −50 and + 50.
2.9.2 Searchlight-based MVPA—To investigate classification accuracy in the rest of the brain other than the predefined regions of interest we performed a searchlight. This
procedure was identical to the ROI-based approach, except that we applied the classifier iteratively to spheres tiling the whole brain, rather than to a priori defined ROIs. For each voxel in a gray matter mask (Harvard/Oxford atlas (Harvard/Oxford atlas, Eickhoff et al., 2005, > 30% probability grey matter), we defined a sphere containing all voxels within a 3-voxel radius (123 3-voxels) of(Chang & Lin, 2011) the center 3-voxel. The searchlight size was set a priori following the procedure as described in (Saxe & Skerry, 2014). Within each individual sphere, we conducted a t-test (all movie clips vs. rest) to select the 80 most active voxels in the sphere. Classification was then performed on each cross-validation fold, and the classification accuracy for that sphere was assigned to the central voxel. This procedure resulted in whole-brain images for each cross-validation fold, which were then averaged together to generate a single accuracy image for each participant, for a given classification. We then conducted a one-sample test over subjects’ accuracy maps. Resulting maps of
t-A
uthor Man
uscr
ipt
A
uthor Man
uscr
ipt
A
uthor Man
uscr
ipt
A
uthor Man
uscr
ipt
statistics were corrected for multiple comparisons with p < .05, family-wise error (FWE) correction based on Gaussian random fields, similar to Skerry & Saxe (2014).
2.10 Representational Dissimilarity Matrices
In an exploratory analysis we investigated the (dis-)similarity of neural responses to five negative emotions (disgusted, angry, worried, sad, furious) and five positive emotions (amused, thankful, enthusiastic, happy, confident). We computed dissimilarity (Euclidian distance) between the average voxel patterns for each emotion across all runs for each ROI (using the same features as in the classification analysis). We normalized each RDM by subtracting its minimum value and dividing by the range, resulting in distances ranging between 0 and 1. All participant RDMs were then averaged to generate one RDM per group (NT, ASD) per ROI. To test whether there was a significant group difference in the overall RDMs, we used a permutation test on the absolute magnitude of the difference between the group average RDMs in each region. To compute null distributions of this difference, we permuted the group labels on the RDMs 5000 times, randomly assigning 30 RDMs to group 1 and 22 RDMs to group 2, and calculated the absolute sum of differences for each
permutation. If the observed group difference was larger than 95% of the observed null distribution in any region, this would constitute evidence for a significant group difference in the overall RDM, and would require follow-up testing to investigate the source of the group difference.
2.11 Participants overlap across studies (n = 9)
For the analyses combining data from Study 1 and Study 2, we dealt with the participants that took part in both studies in two ways: For the one sample t-test (across both groups), the between-group ANOVA and the whole brain analyses, we combined the two datasets from the same participant into a single estimate by, e.g., averaging their respective classification accuracies. For the linear mixed effects model, we used all available data from all
participants and accounted for repeated measures by including subject identity as a random effect in the model.
3. RESULTS
3.1 ParticipantsIn Study 1, groups did not differ significantly in age, sex, or intellectual functioning as measured with the KBIT-2 (crystalline and fluid intelligence, in the following referred to as IQ). In Study 2, groups were matched on age but the ASD group showed significantly lower IQ values and had significantly fewer female participants than in the NT group. Details can be found in table 2. In both studies, the AQ test confirmed low levels of autistic symptoms in the NT group (Study 1, NT: mean = 18.33 (SD = 4.61), ASD: mean = 32.13 (SD = 9.47), t(35) = 5.84, p = 6.2×10⁻¹³; Study 2, NT: mean = 13.67 (SD = 5.73), ASD: mean = 32.46 (SD = 8.39), t(50) = 9.60, p = 1×10⁻⁶). When combining Study 1 and Study 2, groups did not differ significantly in age, IQ, or number of females.
A
uthor Man
uscr
ipt
A
uthor Man
uscr
ipt
A
uthor Man
uscr
ipt
A
uthor Man
uscr
ipt
3.2 Behavioral results
We investigated participants’ behavioral performance in the scanner tasks (Study 1: intensity ratings; Study 2: accuracy; in both studies: reaction times) with separate 2×2 repeated measures ANOVAs (within-subjects factors condition (Study1: expressions vs. situations; Study 2: emotion vs. age task) and valence (positive vs. negative), between-subjects factor group (NT vs. ASD), with IQ as covariate). Reaction times were analyzed for correct trials only in Study 2.
3.2.1 Study 1: Emotion Attribution Task—Mean intensity ratings across all conditions was 2.44 (range = 1.9 – 3.3, SD = .32). Overall the intensity of the situation movie clips tended to be slightly higher (mean = 2.61 (SD = .55)) than for the expressions (mean = 2.28 (SD = .24); main effect of stimulus type, F(1,34) = 3.90, p = .056, ηp2 = .103). Individuals with ASD did not perform differently than control participants (main effect of group, F(1,34) = 1.74, p = .196, ηp2 = .049; stimulus type*group (F(1,34) = 3.08, p = .088, ηp2 = .08), valence*group (F(1,34) = .138, p = .712, ηp2 = .004), stimulus type *valence*group (F(1,34) = .22, p = .641, ηp2 = .006).
We only recorded reaction times during the 2s response screen, hence reaction times longer than 2 seconds could not be analyzed. Numbers of trials missed or with reactions times longer than 2 seconds did not differ between the groups (ASD: mean = 21 %, NT 16 %, t(35) = .89, p = .375). On average participants responded in 750 ms (range = 550–1100, SD = 108 ms). There were no significant main effects or interactions of group, valence or task (all p > .14).
3.2.2 Study 2: Emotion/Age Attribution task—Across all participants and conditions, the mean accuracy was high (mean = 91.8% correct (SD = 4.8). Nevertheless, we excluded the first run for three participants because their performance in the respective run was very low (< 75% of trials had correct responses, p < .05, binomial sign test). To account for individual subjectivity in the age ratings of certain characters across the task, we adjusted accuracy for the age ratings prior to the imaging analysis. In other words, if a participant consistently (sign test p < .05) rated a character in a specific age category (older/young than 30) over the course of the task, we acknowledged these responses as correct, even when they did not conform with the ‘ground truth’ of the experimental design.
The ANOVA revealed that individuals in the ASD group were significantly less accurate than the NT group (F(1,49) = 11.57, p = .001, ηp2 = .19; ASD: mean = 89.1% (SD = 5.1), NT: mean = 93.6% (SD = 3.3)), regardless of whether they were asked to perform the emotion or age judgment. Individuals with lower IQ scores were also less accurate in their judgments, as shown by a main effect of the IQ covariate (F(1,49) = 10.65, p = .002, ηp2 = . 17). There were no other main effects or interactions (all p >.1).
Participants in the NT group responded significantly faster (mean = 631 ms (SD = 89 ms)) than those in the ASD group (mean = 686 ms (SD = 93 ms)), as revealed by a main effect of group (F(1,49) = 4.64, p = .036, ηp2 = .087). In addition, reaction times were faster for positive than for negative emotions across both groups (F(1,49) = 5.85, p = .019, ηp2 = . 107). The ANOVA further revealed an interaction of the factors valence and IQ (F(1,49) =
A
uthor Man
uscr
ipt
A
uthor Man
uscr
ipt
A
uthor Man
uscr
ipt
A
uthor Man
uscr
ipt
4.48 p = .037, ηp2 = .085). There were no other main effects or interactions, suggesting that participants with ASD were not disproportionately slow on the emotion task. An exploratory analysis of the valence and IQ interactions showed that the difference between faster RTs for positive > negative items was smaller for individuals with higher intellectual functioning (partial correction of the difference between RT for positive > negative trials with IQ while controlling for group: (r(49) = .292, p = .037).
3.2.3 Study 2: Face Puzzle behavioral task—Participants in the ASD group showed overall fewer correct responses when labeling the dynamic facial expressions with emotion words than the NT group (ASD: mean = 55.27% (SD = 18.83), NT: mean = 69.07% (SD = 11.69); chance = 25%). A repeated measures ANOVA with the within-subjects factor valence (positive vs. negative), between-subjects factor group (ASD vs. NT) and IQ as covariate yielded a significant main effect of group (F(1,49) = 6.03, p = .018, ηp2 = .11), no interaction or main effect of valence (all p > .8). Individuals with ASD showed an overall impairment in recognizing others’ emotions from facial expressions.
Three types of ‘errors’ were possible on the Face Puzzle task (same-valence similar-intensity, same-valence dissimilar-similar-intensity, opposite valence). In an ANOVA (error type × group, IQ as a covariate), we found main effects of error type (F(1,49) = 3.56, p = .032, ηp2 = .7) and group (F(1,49) = 591, p = .019, ηp2 = .11), and a trend of an interaction of these two factors (F(1,49) = 2.96, p = .056, ηp2 = .06). Both groups made most errors by choosing a different label of the same valence. Individuals with ASD made more errors of all types, including more errors of the opposing valence (see Figure 2).
3.3 fMRI results
3.3.1 In-scanner head motion—Given the importance of accounting for in-scanner head motion when analyzing MRI data (Van Dijk, Sabuncu, & Buckner, 2012), especially in studies of Autism (Deen & Pelphrey, 2012; Yendiki, Koldewyn, Kakunoori, Kanwisher, & Fischl, 2014), we calculated several standard measures to quantify motion in individuals and groups: total number of artifacts (see section 2.6.1 for identification and removal of motion artifact timepoints), mean translation, mean rotation and mean distance. In Study 1, the NT group had significantly more motion artifacts than the ASD group. This effect was reversed in Study 2 (see table 3 for details). After the removal of motion artifact timepoints, measures of head motion showed equal amounts of motion in the remaining, analyzed timepoints between groups in Study 1 but higher levels of motion in the ASD group in Study 2. In the analysis combining data from both studies, there was no difference in the number of total motion artifacts between groups, but ASD participants had more motion than NT participants in the remaining scrubbed (analyzed) data. To additionally control for the effect of head motion on the between group results we include mean translation (as a
representative variable of individual levels of head motion) as a covariate/nuisance variable when testing for group effects. Additionally, as described in the methods, five PCA-based regressors defined in white matter were included in the model in order to capture changes in signal intensity driven by noise.
A
uthor Man
uscr
ipt
A
uthor Man
uscr
ipt
A
uthor Man
uscr
ipt
A
uthor Man
uscr
ipt
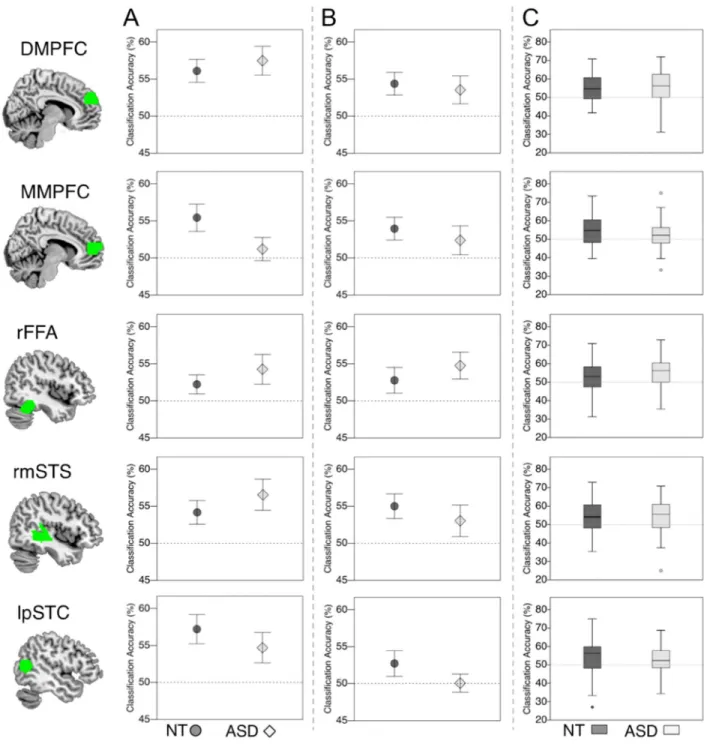
3.3.2 Valence encoding from facial expressions—First we asked whether valence of dynamic facial expressions is encoded in social brain regions in ASD as in NT. We therefore quantified the information about emotional valence, in dynamic facial expressions, across cortical regions (see Figure 3).
Study 1: Across all participants, we found significant encoding of valence averaged over all ROIs (mean = 54.95 (SD = 4.19), t(36) = 7.18, p = 1×10⁻⁸) and in each of the five ROIs separately (dMPFC: mean = 56.69 (SD = 7.33), t(36) = 5.56, p = 1.2×10⁻⁶ ; mMPFC: mean = 53.60 (SD = 7.77), t(36) = 2.82, p = .004; rFFA: mean = 53.11 (SD = 6.87), t(36) = 2.76, p = .005; rmSTS: mean = 55.19 (SD = 7.76), t(36) = 4.07, p = 1.2×10⁻⁴; lpSTC: mean = 56.13 (SD = 8.69), t(36) = 4.29, p = 6.4×10⁻⁵).
In the control group, averaged over all ROIs, responses of multivoxel patterns classified valence facial expressions significantly above chance (mean = 55.03 (SD = 3.91), t(20) = 5.88, p = 4.7×10⁻⁶). When investigating each ROI separately, the classifier significantly decoded stimulus valence in the medial prefrontal cortex ROIs (dMPFC: mean = 56.10 (SD = 7.09), t(20) = 3.94, p = 4.1×10⁻⁴; mMPFC: mean = 55.43 (SD = 8.42), t(20) = 2.96, p = . 0039) and superior temporal cortices (rmSTS: mean = 54.17 (SD = 7.30), t(20) = 2.62, p = . 008; lpSTC: mean = 57.22 (SD = 0.05), t(20) = 3.66, p = 7.8×10⁻⁴), but failed multiple comparison correction for rFFA (rFFA: mean = 52.23 (SD = 5.89), t(20) = 1.73, p = .049). A mentioned above, the NT data presented here are re-analyzed from Skerry & Saxe (2014). Similarly, the ASD group showed above chance classification of valence when averaging across all ROIs (mean = 54.84 (SD = 4.65), t(15) = 4.16, p = 4.2×10⁻⁴). Testing each ROI separately revealed robust decoding of valence from voxel responses in dMPFC (mean = 57.48 (SD = 7.79), t(15) = 3.84, p = 8 1×10⁻⁴) and rmSTS (mean = 56.45 (SD = 8.02), t(15) = 3.13, p = .003) but not mMPFC (facial expressions: mean = 51.19 (SD = 6.27), t(15) = . 765, p = .23). Accuracies in rFFA and lpSTC did not pass multiple comparison correction (rFFA: mean = 54.27 (SD = 8.02), t(15) = 2.13, p = .025; lpSTC: mean = 54.70 (SD = 8.25), t(15) = 2.28, p = .019).
A repeated measures ANOVA, testing directly for group differences revealed no significant main effect of group (F(1,33) = 1.09, p = .743, ηp2 = .003) or interaction of group by ROI (F(1,33) = 1.44, p = .231, ηp2 = .043).
Study 2: We found significant encoding of valence across all participants averaged over all ROIs (mean = 53.34 (SD = 5.25), t(51) = 5.88, p = 1.6×10⁻⁷) and in all ROIs separately (dMPFC: mean = 54.02 (SD = 8.48), t(51) = 3.42, p = 6.2×10⁻⁴; mMPFC: mean = 53.29 (SD = 8.67), t(36) = 2.74, p = .004 .; rFFA: mean = 53.61 (SD = 9.08), t(51) = 2.87, p = . 003; rmSTS: mean = 54.17 (SD = 9.44), t(51) = 3.18, p = .001), except in lpSTC (mean = 51.59 (SD = 8.), t(51) = 1.40, p = .08).
In the control group, averaged overall all ROIs, classification accuracy of valence was significantly above chance (mean = 53.76 (SD = 5.56), t(29) = 3.71, p = 4.4×10⁻⁴). Decoding in dMPFC (mean = 54.38 (SD = 8.38), t(29) = 2.86, p =.004), mMPFC (mean = 53.96 (SD = 8.41), t(29) = 2.58, p = .008) and rmSTS (mean = 55.00 (SD = 9.09), t(29) =
A
uthor Man
uscr
ipt
A
uthor Man
uscr
ipt
A
uthor Man
uscr
ipt
A
uthor Man
uscr
ipt
3.01, p = 003) were significant when correcting for multiple comparisons, whereas accuracy in rFFA (mean = 52.78 (SD = 9.54), t(29) = 1.59, p = .061) and lpSTC (mean = 52.71 (SD = 9.51), t(29) = 1.56, p = .065) showed only trends towards significance.
In the ASD sample, average classification accuracy over all ROIs was significantly above chance (mean = 52.75 (SD = 5.56), t(21) = 2.66, p = .007). Investigating each ROI
separately showed that only rFFA passed multiple comparison correction (mean = 54.75 (SD = 8.49), t(21) = 2.63, p = .008). DMPFC (mean = 53.54 (SD = 8.79), t(21) = 1.89, p = .036) did not pass the multiple comparison threshold, rmSTS (mean = 53.03 (SD = 9.99), t(21) = 1.42, p =.085) showed a trend towards significance and mMPFC (mean = 52.39 (SD = 9.12), t(21) = 1.23, p = .12) and lpSTC (mean = 50.06 (SD = 5.72), t(21) = .047, p =.48) did not classify valence.
A repeated measures ANOVA, testing directly for group differences revealed no significant main effect of group (F(1,48) = .077, p = .783, ηp2 = .002) or interaction of group by ROI (F(1,48) = .541, p = .706, ηp2 = .011).
Combining Study 1 and Study 2
ROI based MVPA analyses: Study 1 and Study 2 both tested perception of valence in brief dynamic facial expressions, using slightly different stimuli and tasks. We combined data from these studies into one large sample to increase power to detect potential group differences.
We first tested for overall classification of valence. Over all participants, we found significant classification accuracies in all social brain ROIs (DMPFC, mean = 54.99 (SD = 8.03), t(79) = 5.56, p = 3.5×10⁻⁷; MMPFC, mean = 53.64 (SD = 8.02), t(79) = 4.06, p = 1.2×10⁻⁴; rFFA, mean = 53.36 (SD = 8.00), t(79) = 3.76, p = 3.3×10⁻⁴; rmSTS, mean = 54.13 (SD = 8.37), t(79) = 4.42, p = 3×10⁻⁵; lpSTC, mean = 53.21 (SD = 8.64), t(79) = 3.32, p = .001).
A repeated measures ANOVA testing directly for group differences again revealed no significant main effect of group (F(1,76) = .077, p = .782, ηp2 = .001) or interaction of group by ROI (F(1,76) = .1.31, p = .265, ηp2 = .017).
To test the effect of group on valence classification in all collected data across studies, and to test for interactions of group with other potentially relevant factors (i.e. sex, handedness, IQ, motion, study; see section 2 for model specification), we conducted a linear mixed effects regression analysis. The results of this model again showed no significant main effects or interactions with group (all p > .5 see table 4 for details on the model statistics).
Weighing the evidence for and against a group difference between the ASD and NT group with a Bayes analysis approach resulted in moderate evidence in favor of the null hypothesis for all five ROIs tested for each study separately, and stronger evidence when combining all data (see Figure 4 plotting the weights and table 5). Using all data from both studies (n = 89) the odds in favor of the null hypothesis in each ROI range between 6:1 (MMPFC) and 21:1 (DMPFC). Thus, the current results suggest reasonable confidence in accepting the null
A
uthor Man
uscr
ipt
A
uthor Man
uscr
ipt
A
uthor Man
uscr
ipt
A
uthor Man
uscr
ipt
hypothesis that there are no group differences in valence extraction from the social brain regions tested.
In sum, these analyses suggests that the valence of dynamic facial expressions is represented in response patterns of social brain regions, in both adults diagnosed with ASD and typically developing control participants. Although supporting the null hypothesis with regards to group differences, these are not “null results”: on the contrary, significantly above-chance classification of valence was obtained across ROIs for both groups.
Univariate analyses similarly revealed no group difference in average magnitude of response in any region (see supplementary material for details).
Whole brain searchlight-based MVPA: To test whether group differences might exist outside our a priori ROIs we conducted a searchlight procedure across the whole brain in the combined data from Study 1 and Study 2. Across all participants, the whole brain
searchlight revealed five significant clusters where patterns of activity could classify valence (p < .05, k > 9, FWE correction for multiple comparison): dorsal medial prefrontal cortex, superior and middle temporal gyrus, left postcentral gyrus and middle occipital gyrus (see table 6 and Figure 5). However, no clusters showed differential classification across groups (NT > ASD, or NT > ASD).
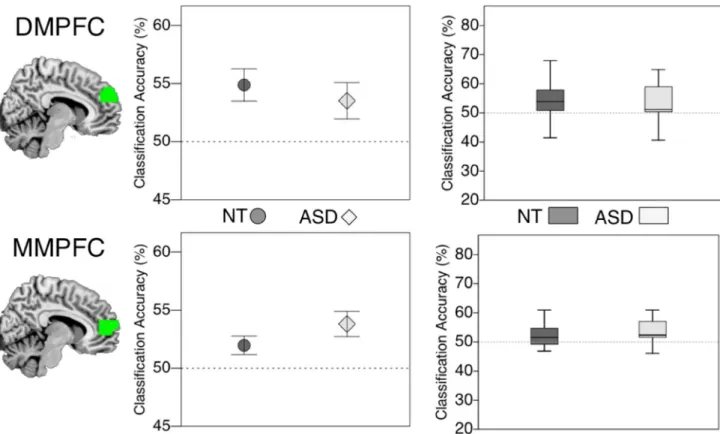
3.3.3 Generalization of valence information across stimulus formats (Study 1) —Abstract information about a character’s emotional valence would generalize across different formats of stimulus (facial expressions and animated situations). We trained a valence classifier on patterns of activity in one stimulus condition (e.g., expressions) and tested the classification accuracy in the other stimulus condition (e.g. situations). As reported in Skerry and Saxe (2014), in control participants, classification of valence when generalizing across stimulus type was observed in dMPFC (mean = 54.87 (SD = 6.32), t(20) = 3.52, p = .001) and mMPFC (mean = 51.97 (SD = 3.69), t(20) = 2.45, p =.012, see Figure 6). In the ASD group, generalization was also observed in both dMPFC (mean = 53.52 (SD = 6.24), t(15) = 2.52, p = .012), and mMPFC (mean = 53.81 (SD = 4.33), t(15) = 3.52 p = . 002). A repeated measures ANOVA testing directly for group differences again revealed no significant main effect of group and no interaction of group by ROI (ROI*group (F(1,33) = 1.18, p = .725, ηp2 = .034) , group (F(1,33) = 2.48, p = .125, ηp2 = .07)).
3.3.4 Flexible representation of valence (Study 2)—A flexible representation of valence would render valence information more robustly classifiable when valence is task-relevant. Thus classification accuracy of an expression’s valence should be higher when participants attend to emotion, in the emotion attribution task, than when they attend to a different stimulus feature, in the age attribution task.
In the NT group, the ANOVA yielded a significant main effect of task (F(1,29) = 5.97, p = . 021, ηp2 = .17), suggesting flexibility of valence representation in social brain regions (see Figure 8). There were no effects or interactions by ROI.
A
uthor Man
uscr
ipt
A
uthor Man
uscr
ipt
A
uthor Man
uscr
ipt
A
uthor Man
uscr
ipt
In the ASD group, there was a trend towards an effect of task (F(1,21) = 4.18, p = .054, ηp2 = .17; see Figure 8) on classification accuracy. Note that the size of the task effect is similar in both groups.
When using a repeated measures ANOVA testing directly for group differences we again found no significant main effect of group (i.e. groups did not differ), and no interactions with the factor group (all p > .4).
However, there was a significant interaction of task and head motion (F(1,48) = 5.90, p = . 019, ηp2 = .11). To further quantify the contribution of head motion to the flexible valence representation across all participants (irrespective of group), we conducted a correlation between head motion and classification accuracy (averaged across all ROIs) for the emotion as well as for the age condition. We found a negative correlation for head motion and valence representation in the emotion condition (Pearson’s r(52) = −.34, p = .013) but not the age condition (Pearson’s r(52) = −.06, p = .68). Correlations differed significantly between conditions (Fisher’s z = .04 (2-tailed)). In other words, in the emotion task condition only, there was information about the expressions’ valence, which was degraded by increasing head motion. We believe that this effect reflects the overall vulnerability of multiple-voxel pattern analyses to in-scanner head motion.
Representations of finer-grained emotional expressions (Study 2): In addition to valence, the responses in these cortical regions may differentiate finer-grained emotions. The face movies in Study 2 depicted five negative emotions (disgusted, angry, worried, sad, furious) and five positive emotions (amused, thankful, enthusiastic, happy, confident). However, there was no evidence of a group difference between the average RDMs for NT and ASD
participants in any ROI (permutation test, all observed differences within 95% of the null distribution, see Figure 7).
3.3.5 Encoding of character’s age in the videos (Study 2)—Although not the focus of this manuscript, Study 2 allowed us to test for encoding of the character’s age in neural patterns of cortical (social) brain regions, when this feature was task-relevant (i.e., during the age attribution task condition) versus when it was not task-relevant (i.e., during the emotion attribution task). This can be considered a different measure of the flexibility of social information processing.
We found a significant main effect of task on age classification in the NT group (F(1,29) = 7.59, p = .010, ηp2 = .21): the character’s age could be classified from the pattern of response during the age attribution task (mean = 54.17 (SD = 5.14) but not in the emotion attribution task (mean = 51.32 (SD = 4.25).
There were no significant main effects or interactions in the data from the ASD group (all p > .4). A repeated measures ANOVA testing directly for group differences revealed a significant main effect of group (F(1,48) = 7.34, p = .009, ηp2 = .13) and a trend towards an interaction of task and group (F(1,48) = 3.48, p = .068, ηp2 = .07). Thus, unexpectedly, individuals with ASD appeared to be less likely than controls to represent a character’s age (but not emotion) in their social brain regions, when this stimulus aspect was task-relevant.
A
uthor Man
uscr
ipt
A
uthor Man
uscr
ipt
A
uthor Man
uscr
ipt
A
uthor Man
uscr
ipt
Since the character’s age was not manipulated in Study 1, this unexpected finding could not be replicated in our data, but could be a potential target for future experiments.
3.3.5 Variance analyses—One re-occurring argument in studies reporting the absence of activation differences between Autism versus neurotypical groups is that levels of variance may differ between the groups in the measure of interest. We sought to test this hypothesis in our data and conducted Levene tests for homogeneity (equality) of variances (Levene, 1960). This test is less sensitive to potential violations of the normality assumption (than, e.g., the Bartlett test (Snedecor & Cochran, 1989)) thus it represents a good strategy to apply the same test across a variety of measures. In particular, we tested for equality of variances in classification accuracies between groups per ROI averaged across studies for facial
expressions and per study (i.e., Study 1: across stimulus conditions, Study 2: for the age task condition). In short, there were no significant differences (all p > .1) in variances between the groups in any neural measure tested (see tables 7 and 8 for details on the statistics). For visualizations of variance per group see Figures 3,4,6,8.
4. DISCUSSION
We measured the cortical activity underlying sensitive and flexible social perception, using MVPA. The pattern of activity in an observer’s “social brain regions”, including medial prefrontal cortex and superior temporal sulcus, could be used to decode the valence of an observed facial expression from naturalistic dynamic videos. Patterns of activity in MPFC generalize from facial expressions to other cues to emotion, like events (e.g. social exclusion). Across many regions, patterns of activity were sensitive to the observer’s endogenous goals, making valence more decodable when emotions are task-relevant. These patterns of activity reflect the flexible extraction of emotionally-relevant information, from brief dynamic stimuli, that generalizes to new people and new expressions. Thus, this task seems to require the kind of social processing that individuals with ASD describe as unusually challenging. Surprisingly, individuals with ASD showed (i) similar decoding of emotional expressions, in the same cortical regions, (ii) similar responses to emotional valence that generalize across facial expressions and animated social events; and (iii) similar flexibility in response to task-relevance.
Historically, cognitive neuroscientists have been reluctant to make inferences based on findings of no group difference, or "null results", for good reasons. True group differences could easily be missed by typically under-powered studies with small samples of
heterogeneous groups; and standard statistical analyses are designed only to assess evidence against the null hypothesis, not evidence for it. However, the current data are not just "null results" in this familiar sense. The 'null result' of no group difference is composed of a series of positive results in the ASD sample: including replicable, reliable classification of
emotional valence from dynamic videos across multiple cortical regions. The observed absence of a group difference is evidentially supported and theoretically important. Statistically, the current data provide strong evidence against a diagnostically relevant difference between groups in the neural measures. To increase power, we combined data from two studies (resulting in 89 datasets from 80 participants). In a Bayesian analysis, we
A
uthor Man
uscr
ipt
A
uthor Man
uscr
ipt
A
uthor Man
uscr
ipt
A
uthor Man
uscr
ipt
found reasonably strong support for the conclusion that ASD and control datasets were drawn from the same underlying distribution (Gallistel, 2009; Kass & Raftery, 1995; Rouder, Speckman, Sun, Morey, & Iverson, 2009) (Figure 4, table 3). There was also no greater variability in neural measures for the ASD group.
Theoretically, the absence of robust group differences is important because the experiment was a sensitive test of a widespread assumption about the mechanism of social impairment in ASD in general, while addressing valence processing prototypically (Ben Shalom et al., 2006; Celani, Battacchi, & Arcidiacono, 1999; Kuusikko et al., 2009; Tseng et al., 2014). First, all of the stimuli were dynamic videos, and covered basic as well as more complex/ social emotions (e.g., angry, surprised, enthusiastic, furious), wide ranges of expressivity (from more subtle to overstated expressions), and a diverse set of individuals (Study1: 96 characters, Study 2: 20 characters), spanning a wide age range and both genders. Stimuli in Study 1 were subtle and less controlled (with respect to lighting and viewpoint), hence reflecting more naturalistic perceptual content. Stimuli in Study 2 were exaggerated and more controlled (i.e., all with overhead lighting and frontal view). Yet for both sets of stimuli, brain responses to emotional valence were not different in individuals with or without ASD.
Second, the multivariate measure of brain region responses used here is more sensitive than traditional univariate measures. (Although note that we observed no group difference in average magnitude of response in any region either, see supplementary material for details). Multivariate analyses can detect both differences in the average response over whole brain regions, like traditional univariate measures, but are also sensitive to relative differences in the spatial patterns of response. In typically developing adults, many cortical regions show similar overall magnitude, but distinct spatial patterns, of activity in response to positive versus negative facial expressions (Tseng et al., 2016). In the few previous studies using MVPA in participants with ASD, MVPA revealed differences in social information processing in individuals with ASD that were not detected with univariate methods (Coutanche et al., 2011; Gilbert, Meuwese, Towgood, Frith, & Burgess, 2009; Koster-Hale et al., 2013). Whereas those previous studies used MVPA opportunistically on existing data, the current studies were designed to be sensitive to social information processing in each individual participant and across groups.
Third, in addition to finding no difference in basic cortical responses to the valence of facial expressions, each study tested an additional hypothesis about social information processing deficits in ASD, beyond a basic representation of valence. In Study 1, we tested whether in individuals with ASD, responses to emotional valence are relatively cue-specific. That is, individuals with ASD might struggle to see how the same emotional valence could be perceived in facial configurations (down-turned eyes) and event contexts (being left out of a group). Contrary to our hypothesis, individuals with ASD showed the same abstract response to emotional valence, generalizing across faces and events, in the same regions of MPFC.
In Study 2, we tested whether in individuals with ASD, responses to emotional valence are relatively stimulus-driven. That is, individuals with ASD might struggle to flexibly change
A
uthor Man
uscr
ipt
A
uthor Man
uscr
ipt
A
uthor Man
uscr
ipt
A
uthor Man
uscr
ipt
their response to social stimuli when the task, or relevant feature, shifts. Again contrary to our hypothesis, individuals with ASD showed equally flexible encoding: the expression’s valence could be classified from responses in social brain regions when it was task-relevant (i.e. judging emotional intensity in Study 1 or valence in Study 2), but not when emotion was irrelevant to the task (i.e. judging target’s age in Study 2). Unexpectedly, we did find a group difference in the flexibility of the control dimension. In an exploratory analysis, social brain regions of control participants, but not those with ASD, could be used to classify the age of the target, only when age was the task-relevant dimension. This finding is intriguing but preliminary, and could be pursued in future confirmatory research. In addition to valence, in Study 2 we also used representational dissimilarity analysis to measure the differentiation of 10 fine-grained emotional expressions, and again found no group differences.
In sum, the results reported here suggest little or no group difference in the extraction of emotion-relevant information from dynamic facial expressions in the social brain regions of adults with ASD. This conclusion seems counterintuitive. How can these results be
integrated with the existing literature on social cognitive neuroscience of ASD, and more importantly, with the experience of ASD reported by affected individuals and their families? Perhaps social impairments in ASD do not reflect difficulty extracting meaning from dynamic faces, considered in isolation. Real world social interaction additionally requires integration of information across modalities and timescales (Rosenblau et al., 2015). Social brain regions may be especially sensitive to the meaning of social cues in larger contexts (Byrge, Dubois, Tyszka, Adolphs, & Kennedy, 2015; Pantelis et al., 2015). For example, TPJ and MPFC responses to movies are strongly disrupted by temporal scrambling (Hasson, Furman, Clark, Dudai, & Davachi, 2008), and robustly enhanced by switching from movies to live interpersonal interactions (Redcay et al., 2010). Individuals with ASD might be disproportionately impaired at the interpretation of social cues in such contexts (Pantelis et al., 2015, Redcay et al., 2010).
Second, fMRI may not be the ideal tool to measure clinically relevant differences in information processing, because of its poor temporal resolution. The synchrony and
efficiency of neural processing may be dramatically affected by small differences in phase or frequency of neural activity that are masked by the temporal resolution of the hemodynamic lag. If so, measurements with much higher temporal resolution, such as EEG and MEG may be more appropriate.
Third, disproportionate impairments in social information processing might characterize only a subset of individuals diagnosed with ASD. Aggregated results from hundreds of people suggest that only about 20% of individuals diagnosed with ASD perform below the typical range on one widely used test of social perception, the Reading the Mind in the Eye Test (RMET; Lombardo et al., 2016). Similarly, a recent study compared spontaneous looking to dynamic social and non-social videos in hundreds of toddlers; only 20% of toddlers just diagnosed with Autism showed lower-than-normal-range preferential looking to dynamic social stimuli (Geo-Pref Test; Pierce et al., 2016). Relatedly, Byrge and colleagues (2015) reported that a small subset of individuals with ASD showed robustly atypical neural