HAL Id: inserm-00542898
https://www.hal.inserm.fr/inserm-00542898
Submitted on 3 Dec 2010
HAL is a multi-disciplinary open access
archive for the deposit and dissemination of
sci-entific research documents, whether they are
pub-lished or not. The documents may come from
teaching and research institutions in France or
abroad, or from public or private research centers.
L’archive ouverte pluridisciplinaire HAL, est
destinée au dépôt et à la diffusion de documents
scientifiques de niveau recherche, publiés ou non,
émanant des établissements d’enseignement et de
recherche français ou étrangers, des laboratoires
publics ou privés.
MR-guided transcranial brain HIFU in small animal
models.
Benoît Larrat, Mathieu Pernot, Jean-François Aubry, Ervisa Dervishi, Ralph
Sinkus, Danielle Seilhean, Yannick Marie, Anne-Laure Boch, Mathias Fink,
Mickaël Tanter
To cite this version:
Benoît Larrat, Mathieu Pernot, Jean-François Aubry, Ervisa Dervishi, Ralph Sinkus, et al..
MR-guided transcranial brain HIFU in small animal models.. Physics in Medicine and Biology, IOP
Publishing, 2010, 55 (2), pp.365-88. �10.1088/0031-9155/55/2/003�. �inserm-00542898�
MR-guided transcranial brain HIFU in small animal models
B. Larrat
1, M. Pernot
1, J.-F. Aubry
1, E. Dervishi
2, R. Sinkus
1, D. Seilhean
4, Y. Marie
3, A.-L. Boch
2, M. Fink
1, M.
Tanter
11 Institut Langevin, ESPCI ParisTech, CNRS UMR 7587, INSERM U979, Université Paris VII
Laboratoire Ondes et Acoustique, 10 rue Vauquelin, 75 231 Paris Cedex 05, France [email protected]
2 Hôpital de la Pitié-Salpêtrière - INSERM,U495
47 boulevard de l’Hopital, 75651 Paris Cedex 13, France
3Hôpital de la Pitié-Salpêtrière – Neurosurgery department
47 boulevard de l’Hopital, 75651 Paris Cedex 13, France
4
Hôpital de la Pitié-Salpêtrière – Neuropathology department
Abstract — Recent studies have demonstrated the feasibility of transcranial High Intensity Focused Ultrasound
(HIFU) therapy in the brain using adaptive focusing techniques. However, the complexity of the procedures imposes to provide an accurate targeting, monitoring and control of this emerging therapeutic modality in order to ensure the safety of the treatment and avoid potential damaging effects of ultrasound on healthy tissues. For these purposes, a complete workflow and setup for HIFU treatment under Magnetic Resonance (MR) guidance is proposed and implemented in rats. For the first time, tissue displacements induced by the acoustic radiation force are detected in
vivo in brain tissues and measured quantitatively using motion-sensitive MR sequences. Such a valuable target control
prior to treatment assesses the quality of the focusing pattern in situ and enables to estimate the acoustic intensity at focus. This MR-Acoustic radiation force imaging is then correlated with conventional MR-Thermometry sequences which are used to follow the temperature changes during the HIFU therapeutic session. Last, pre and post treatment Magnetic Resonance Elastography (MRE) datasets are acquired and evaluated as a new potential way to non invasively control the stiffness changes due to the presence of thermal necrosis.
As a proof of concept, MRguided HIFU is performed in vitro in turkey breast samples and in vivo in transcranial rat brain experiments. The experiments are conducted using a dedicated MR compatible HIFU setup in a high field MRI scanner (7T). Results obtained on rats confirmed that both the MR localization of the US focal point and the pre and post HIFU measurement of the tissue stiffness, together with temperature control during HIFU are feasible and valuable techniques for an efficient monitoring of HIFU in the brain. Brain elasticity appears to be more sensitive to the presence of oedema than to tissue necrosis.
Monitoring; Magnetic Resonance Thermometry; High Intensity Focused Ultrasound; Magnetic Resonance Elastography; Radiation Force Localization; brain; transcranial; rat.
I. INTRODUCTION
In the last decades, therapeutic use of ultrasound has developed fast with a wide variety of applications (ter Haar 2007) such as thermal ablation of tumors (Illing et al 2005, Pauly et al 2006, Fennessy and Tempany 2006, Gombos et al 2006), blood-brain barrier disruption (Hynynen et al 2001, Mesiwala et al 2002), sonothrombolysis (Daffertshofer and Hennerici 2003), ultrasound-based drug-delivery (Deckers et al 2008) or local activation of gene expression (Guilhon et al 2003, Deckers et al 2009) in many different organs such as liver, kidney, prostate, uterus and breast. The High Intensity Focused Ultrasound (HIFU) technique has emerged as a reliable technology to non invasively deposit energy into living organs. One or several piezoelectric transducers are used to focus a high power ultrasonic (US) beam in the body. Although HIFU application to the brain has long been limited by the skull bone that distorts strongly the ultrasonic wavefront, recent studies have shown that HIFU brain therapy is feasible through the intact skull by using multi-element transducers coupled to adaptive focusing techniques. In these techniques, a phase correction is applied to each element in order to restore a sharp focus at the desired location (Thomas and Fink 1996, Tanter et al 1998, Hynynen and Sun 1999). The phase correction is obtained non-invasively thanks to a computation of the wave propagation through the skull bone based on Computed Tomography (CT) images of the skull (Aubry et al 2003). Although this technique has been shown to efficiently restore the focus (Pernot et al 2003, Hynynen et al 2006, Tanter et al 2007, Cohen et al 2007, Pernot et al 2007), it is important to assess the focusing quality prior to the treatment. Some modeling and positioning errors are likely to introduce a change of the focus location as well as a decrease of the energy deposition at the focus. Therefore, it would be of great help to be able to verify the location and the shape of the focal point right before starting a potentially damaging high power US sequence. Ideally, this should be done using the same devices as for the HIFU session with a single positioning for both steps.
Depending on the sonication duration, a high Intensity ultrasound beam may induce two different effects in biological tissues. For sonication durations on the order of one second, the main effect is the heat deposition. However, a HIFU device can be used in a pulsed mode without significant heat deposition. In this mode, the acoustic beam induces a radiation force. As a consequence, tissues are pushed away from their resting position. The acoustic radiation force is related to the acoustic intensity so that tissue displacements are strong at the focus. Several different ultrasound-based techniques have been proposed to measure this displacement non invasively, namely the vibroacoustography technique (Fatemi and Greenleaf 1998), the Acoustic Radiation Force Imaging technique (ARFI) (Nightingale et al 2002) and the Supersonic Shear Imaging technique (Bercoff et al 2004a, Tanter et al 2008). Due to the strong ultrasonic attenuation and aberrations induced by the skull bone, none of them have been shown to be applicable in the brain.
Recently, Magnetic Resonance (MR) motion sensitive sequences have been proposed to map this acoustic radiation force induced displacement in phantom gels and ex vivo tissues (Sarvazyan et al 1998, Sinkus et al 2008, McDannold and Maier 2008, Souchon et al 2008). A great advantage of this technique is the ability to map the focal spot in situ using low energy transmission and without causing any irreversible changes of the tissue. In this paper, we propose to apply this technique in vivo and transcranially for mapping the focal spot of an ultrasonic transducer in the rat brain and ensure the accuracy of the focusing prior to the treatment.
During an HIFU treatment, the quantification of the temperature rise helps physicians to predict the treated area. Several ultrasound based techniques have been investigated to monitor the HIFU treatment during or immediately after HIFU. Conventional B-mode imaging was proposed to follow the hyperechogenicity of bubble clouds induced by US cavitation (Ribault et al 1998, Vaezy et al 2001). However, this strong echo fades out quite fast at the end of the HIFU session and some studies highlighted a lack of reproducibility in some cases (Melodelima et al 2007). Another emerging technique is based on the measurement of thermally-induced modifications in backscattered RF echoes due to thermal expansion and local changes in the speed of sound (Seip and Ebbini 1995, Simon et al 1998, Pernot et al 2004, Souchon et al 2005, Miller et al 2005, Abolhassani et al 2007). The temperature estimation remains difficult behind the heated region (Arthur et al 2003) and is sensitive to motion (Arthur et al 2008), making it difficult to implement in vivo.
Although those ultrasound-based imaging techniques have shown strong potentials in some situations such as the treatment of prostate or liver, they fail to provide reliable tools to monitor HIFU through the skull bone. For transcranial brain HIFU, ultrasound thus needs to be coupled to MR imaging which implies to work with MR compatible HIFU transducers.
Magnetic Resonance Imaging (MRI) has been shown to be very useful in order to plan the intervention and spatially monitor the HIFU thermal deposition during treatment (Jolesz and Hynynen 2002). Dedicated MR-thermometry sequences using the temperature dependence of the Proton spin Resonance Frequency (PRF) have been successfully used for MR guided HIFU protocols in vivo (de Senneville et al 2005, McDannold et al 2006). Those sequences potentially give access to millimeter sized temperature maps in the focal plane every few seconds. Based on the temperature variation, the thermal dose is also computed, as an index that allows prediction of the tissue necrosis for a certain temperature variation as a function of time (McDannold et al 2004, Cohen et al 2007). The thermal dose calculation is more reliable when it is based on actual temperature measurements rather than when a model is used to simulate the temperature rise.
Few reliable post-treatment imaging tools exist to confirm the effectiveness of the necrosis in the targeted area. Most of the currently available imaging techniques give access to anatomical information with contrasts indirectly sensitive to the physiological consequences of tissue necrosis (Leslie et al 2008). This results in difficulties to quantify the effectiveness of the necrosis and to reliably delineate the treated area. For instance, the inflammatory response enhances the signal in T2-weighted MR images but there is little chance to predict the response to therapy from such images. It is thus important to develop imaging modalities giving a good contrast between necrosed and healthy tissues. Elasticity imaging techniques have been proposed to assess tissue necrosis after HIFU treatment taking advantage on the fact that stiffness of coagulated tissues changes significantly.
This promising approach was initially proposed via static US elastography (Kallel et al 1999). It was further demonstrated in vivo with dynamic elastography (Shi et al 1999). Recently, the Supersonic Shear Imaging technique showed strong potentials ex vivo (Bercoff et al 2004b). This latter technique is now implemented in real time with quantitative and operator-independent capabilities. MR-Elastography has been recently shown feasible
in vivo in the brain of animals and healthy volunteers in the absence of ultrasonic treatment (Sack et al 2008,
Green et al 2008, Kruse et al 2008). Due to the few available data and the poorly known effects of HIFU on the stiffness of the brain tissue, it is important to test this technique in vivo and determine whether or not it could be proposed as a new modality to control the efficiency of an HIFU treatment.
In the present work, HIFU experiments are conducted under MR guidance in vitro in turkey breast samples and in vivo in rat brains. The aim of these experiments is twofold.
On the one side, a complete setup is proposed and evaluated for MR-guided transcranial HIFU treatments in small animals. For this purpose, a dedicated positioning setup and a MR-compatible HIFU transducer are integrated into a high field MRI scanner. A complete image guided treatment protocol is successfully tested transcranially on five wild type rats.
On the other side, MR imaging of local tissue displacements induced by the radiation force of the ultrasonic therapeutic beam is performed and evaluated in vivo for the first time. Transient tissue motion is achieved using little total acoustic energy compared to HIFU treatment and does not affect the tissues properties. This technique allows a mapping of the focusing pattern in situ for targeting purpose, prior to the treatment. Moreover, this technique is shown to be able to estimate the acoustic intensity in situ as the acoustic radiation force is directly related to the acoustic intensity in soft tissues and under typical ultrasound amplitude used for HIFU. This is very important for planning the treatment duration. The efficacy and complementarity of this approach is discussed compared to existing modalities such as MR-thermometry and MR-Elastography. Finally, these three MRI sequences all based on MR phase imaging are combined to fulfill monitoring needs at three stages of the treatment: targeting, monitoring and assessing. For monitoring purpose, conventional MR temperature imaging is performed with high resolution in time and space to map the temperature rise in the US focal plane during the HIFU session...Finally, as a recently introduced technique, MR-Elastography is tested to assess the changes in
tissue stiffness after an HIFU session. MR elastography is feasible in the rodent brain (Atay et al 2008) and provides a mapping of the viscoelastic properties of the brain before and after HIFU treatment which may allow to detect thermally induced damages.
The proposed imaging sequences are evaluated in the perspective of human MR-guided HIFU therapy (Pernot et al 2003).
II. MATERIALS AND METHODS
A – Combined MR-US setup
All the experiments were performed in a 7T small animal MRI scanner (Pharmascan, Bruker Biospin, Germany) equipped with 300mT/m gradient coils. The MRI acquisitions were done using a volume radiofrequency coil with 6cm inner diameter for both emitted and received RF signals. An MR-compatible prefocused (focal length 25mm, F/D =1) ultrasonic monoelement (Imasonic, France) operating at 1.5MHz was designed to fit into the MRI machine. This transducer was able to deliver 1900W/cm² acoustic power at the focus to heat the biological tissues. For the elastography acquisition, piezoelectric bending plates (Piezo Systems Inc, MA, USA) were used to generate oscillatory motion at 400Hz.
A dedicated positioning system was built to position the US transducer relative to the sample of interest (Figure 1A). It consisted in an open plexiglas tube in which the transducer could translate and rotate in the head-foot direction. A three point stereotactic frame enabled to fix the head of the animal and translate it in the left right direction. This system enabled a manual positioning of the rat brains relative to the US transducer with millimetric precision in all desired directions. The transducer was mounted with a 0.2mm thick latex membrane transparent to ultrasound in front of the active piezoelectric material. The gap between the transducer and the membrane was filled with degassed water. The water flow inside the ultrasonic probe could be controlled from outside the scanner. It was used to cool down the active surface of the transducer after an HIFU session. During MR acquisitions, flow was stopped to prevent artefacts on the MR data. The flexible latex membrane curvature could be controlled by changing the water pressure from outside the MR scanner. This enabled to remotely change the distance between the membrane and the sample of interest to improve the depth of the focal plane in the rat brain.
For the MR-Elastography acquisitions, rats were placed in the supine position with the head against the dedicated 400Hz vibrator. For the acoustic radiation force imaging and the HIFU treatment, the animals were lying in the prone position. Their heads were shaved with depilatory cream and carefully placed so that to ensure a proper coupling with the flexible membrane. Dedicated acoustic gel was used. Figure 1B shows the installation of a rat in this MRI bed. Rats were anaesthetized with isoflurane (3% v/v for induction and 1.5% v/v afterwards, Baxter, France). The gas anaesthesia circuit (TEM, France) was coupled to the rat head via a home-made piece of plastic. The animal rectal temperature and the respiration are monitored during the MR acquisition. An MR compatible electrical heating blanket keeps the body temperature over 30°C.All the animal experiments were done in accordance with local ethic laws.
Figure 1: A dedicated experimental setup (A) for rat HIFU investigations ensures the positioning of the transducer against the animal head and limits motion artefacts due to respiration. It also enables to steer the US beam in the rat brain in order to target a desired location. The piezoelectric US single element transducer is placed on top of the shaved head (B).
The ultrasonic diffraction simulation software Field II (Jensen and Svendsen 1992, Jensen et al 1996) was used to simulate the pressure field generated by our spherical single-element focused transducer in free water.
Figure 2 shows the normalized pressure in the sagital plane. The size of the simulated focal spot fits perfectly with the one measured with the transducer in a water tank: 1by1by8mm at -6dB. Given the geometry of a rat brain, the center of the focal spot will be ranging from 5 to 7 mm deep under the skull. Given the long extension of the focal spot in z direction and the relatively low attenuation of the US in the brain at 1.5MHz, reverberations are likely to occur inside the skull cavity leading to complex pressure fields in the brain. Such pressure fields are strongly dependant on the skull geometry and the transducer position.
Figure 2: Normalized pressure field created by a 1.5MHz circular focused transducer with F=D=25mm. The focal spot dimensions at -6dB are 1 by 1 by 8 mm.
The maximum peak positive pressure at the focus of the transducer was calibrated in a water tank with a hydrophone (Onda Corporation, CA, USA). The linear relationship between the applied voltage and the pressure at focus was verified up to 8 MPa. The attenuation due to the skull bone was also measured in a water tank on 2 posterior half-skulls obtained from 2 rats. The transmission appeared to be similar for both skulls and hardly influenced by the part of the skull encountered by the US beam. Qualitatively, it showed a stronger dependence on the incident angle of the US beam on the bone surface. The overall transmission amplitude factor of the skull bone remained close to a value of 1/2 (0.49±0.08).This calibration step allowed us to determine that in the presence of a rat skull the maximum pressure rises linearly with the applied voltage with a slope of 3.33e-2 MPa/V. However, in practical in vivo situations, this value can only be used as a rough estimation of the pressure obtained in situ. The pressure might be affected by a number of unpredictable or varying parameters such as the impedance matching, the exact value of the attenuation factor through the skull, the variability of the coupling between the transducer and the rat head, the reverberation of ultrasound waves in the brain. This motivates us to find a non invasive way to quantify the acoustic intensity at focus in situ.
B – Magnetic Resonance sequence for the localization and quantization of the radiation force induced displacement before HIFU therapy
When focused into an attenuating material, bursts of ultrasound generate a radiation force resulting in a local displacement of the medium at focus (Sarvazyan et al 1998). In a first approximation, this displacement rises exponentially with the sonication time reaching a plateau which value is linearly linked to the acoustic power. As recently published (McDannold and Maier 2008, Souchon et al 2008), this displacement can be mapped using dedicated motion sensitized MR sequences.
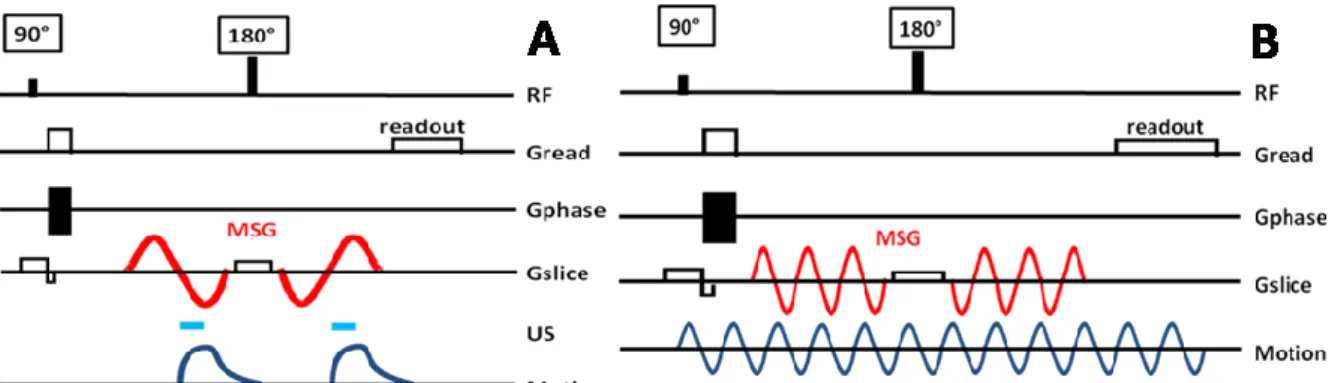
In the present work, such a sequence was optimized in order to detect displacements as small as a few micrometers (Figure 3A). It consisted in a standard multislice spin-echo sequence (TE=40ms/TR=1080ms) with two additional bipolar sinusoidal gradients (f=75Hz) equally distant to the 180° radiofrequency pulse. If correctly synchronized with the ultrasound bursts, those gradients encode the radiation force induced displacement in the phase of the MR signal (Muthupillai et al 1995).
The radiation force induced displacement at the focus was assumed to be mostly oriented along the US beam. This allows using Motion Sensitizing Gradients (MSG) only in this direction that is to say the slice selection direction in case of a displacement mapping with slices oriented perpendicular to the beam axis.
In order to check the position of the focal point, this sequence was used to map the acoustic radiation force in up to five adjacent coronal slices. The imaging resolution was 0.78*0.78*3mm3. It was chosen as the highest available resolution giving sufficient signal to noise ratio to be able to properly quantify the MR phase. This resolution remained sufficiently smaller than the size of the displaced region to keep spatial averaging negligible. Each acquisition was repeated with and without ultrasound so that to obtain phase reference images. After a basic 2D unwrapping processing, corresponding images were subtracted one from another in order to get real displacement weighted images.
Figure 3: The radiation force induced displacements are mapped in 1 to 5 slices oriented perpendicularly to the US beam. 75Hz sinusoidal Motion Sensitizing Gradients (MSG) are added to a standard multislice spin echo sequence in the slice selection direction to encode the displacements along the US beam (A). US are switched on during the third quarter of each MSG period to optimize the motion encoding and keep the US duty cycle as low as possible. For the elastography acquisition, a piezoelectric bending plate coupled to the skull generates 400Hz sinusoidal motion in the brain. The 3D displacement field is mapped in 30 adjacent slices. 400 Hz MSG are added to a standard multislice spin echo sequence (B). 8 different delays d are sequentially recorded for each of the 3 gradient axes so that to cover one full excitation cycle.
Two ultrasound bursts were triggered at the beginning of the second lobe of each MSG. Such a configuration avoids any motion during the first lobes of MSG which would destroy motion encoding. We found it to be the best configuration both in term of motion encoding and in term of signal to noise ratio. Furthermore, the overall acoustic duty cycle remained below 5% which ensured low heating of brain tissues and the safety of the procedure.
From the pressure field generated by the transducer (figure 2), a dedicated code was used to simulate the expected viscoelastic response u(r,t) of a tissue submitted to a 3ms sonication. It is based on an explicit derivation of the 3D Green's function in a viscous and elastic medium (Bercoff et al 2004c).
The amplitude of the radiation force in case of a linear response can be expressed as:
(1)
where is the mass density taken as 1000kg/m3, c the speed of sound in the medium taken as 1540m/s, the ultrasonic attenuation in tissues taken as 6Np/m/MHz (Goss et al 1978, Goss et al 1980) and P the pressure field as simulated by Field II.
For the Green’s function calculation, the shear mechanical properties of the tissue were taken as the averaged values measured via MR-Elastography at 400Hz over the whole rat brain prior to HIFU (mean elasticity µ=2.55kPa and mean viscosity η=0.54Pa.s). These values were in good accordance with the available data in the literature (Nicolle et al 2005). Ideally, one should consider the mean elasticity corresponding to the frequencies of the spectral content of a 3ms US pulse. Here, the shear wave speed was assumed to be 1.5 m/s and the viscosity 1 Pa/s. Figure 4 shows the simulated displacement in the focal plane along a line passing through the focal point at different timings of the ultrasound burst.
The displacement u(r,t) in meters is encoded in the phase (in radians) of the MR-signal via the following equation:
(2)
where is the proton Larmor constant and G the MSG over one encoding sinusoidal period T. Both of the MSG periods equally contribute to the global motion encoding.
From the simulated displacement field u(r,t), the MR phase encoding was calculated assuming that the displacement was perfectly parallel to the direction of the MSG gradient.
Regarding phase encoding, the optimal displacement function is theoretically a rectangle starting at T/2 and lasting T/2 where T is the period of the MSG. This corresponds to the simulated time curve on Fig 4 in case of a very short rising time and an infinite falling time or equivalently a tissue with very low shear velocity and infinite viscosity. In such a case, the theoretical relationship between the measured MR phase rand the local strain amplitude A(r) would be:
(3)
where G is the MSG amplitude. We can now introduce the factor S quantifying the discrepancy between the general case and the ideal case above.
(4)
S represents the sensitivity to motion and depends on the time profile of the displacement at point r. For a given strain, greater value for S means better motion encoding.
C – Magnetic Resonance sequence for temperature measurements in the targeted area during HIFU therapy
When a proton magnetic spin is flipped away from its equilibrium orientation parallel to the main magnetic field, it starts to turn around the equilibrium axis at a precise angular frequency B0 known as the Larmor
frequency. This frequency has been shown to slightly depend on temperature (Peters and Henkelman 2000). Consequently, the spins from two adjacent voxels with two different temperatures do not precess at the same speed. They thus get dephased one from another with time. An imaging sequence can either be designed to cancel out this disturbing effect or to take advantage of it.
Here, a MR-thermometry sequence was prepared from a standard Fast Low Angle Shot (FLASH) sequence (TE=3.5ms/TR=15ms/flip angle 30°). It generated one temperature map every 0.518s with 64*64 voxels. The spatial resolution was 0.7*0.7*3mm3. The slice was chosen in the exact focal plane found with the previous localization sequence. Once again, all the acquired phase maps were unwrapped prior to any processing. Then, phase-difference images were obtained by subtracting the first reference phase image to subsequent phase frames. When starting in-vivo experiments, respiratory motion created phase artefacts resulting in inaccurate quantification of the temperature rise. To solve this problem, a set of reference frames were recorded before starting the HIFU so that to get reference phase images for different phases in the respiratory cycle of the animal. For each following frame, this allowed to choose the best reference to use on the basis of the calculation of the standard deviation of the difference between the considered phase frame and all the reference frames in a non heated Region Of Interest (ROI). This multiple baseline approach improved the resulting time curves by partly correcting respiratory motion effects. A low pass filtering procedure in time was then applied to the data with too much motion.
The processed MR phase (in cycles) is linearly related to the temperature rise (in degrees) via the following equation:
(5)
where is the apparent Proton Resonance Frequency thermal coefficient, the proton Larmor frequency, B0 the
main magnetic field strength and TE the echo time value of the sequence. The sensitivity of the sequence was found to be smaller than one degree in case of an acceptable MR signal to noise ratio value.
The literature gives a common value of 0.01ppm/°C for the thermal coefficient i.e. 3Hz/°C at 7T (Vykhodtseva et al 2000) Preliminary experiments consisted in measuring the proton Larmor Frequency shift as
a function of temperature in free water between 20°C and 65°C. The temperature was measured by a MR compatible thermocouple during the cooling time of boiled water. The frequency shift was found to be linearly related to the temperature with an experimental value of 3.10±0.03Hz/°C for This latter value was adopted for all subsequent data processing.
In order to simulate the temperature rise induced by the therapeutic ultrasound beam, a dedicated code was used to solve the bioheat equation in tissues:
(6)
where T is the tissue temperature as a function of space and time, the tissue density, c the tissue heat capacity in J/kg/K, k the diffusion constant in W/m/K, Q the heat deposition from HIFU, b the blood flow in s-1,
b the blood density, cb the blood heat capacity and Tb the blood temperature.
The acoustic radiation force quantization procedure as described previously has potential to give a good estimation of the maximum pressure at the focus. From the previously simulated pressure field pattern (Figure 2), and given the thermal properties of the tissue, 3D finite difference calculations can simulate the expected temperature maps during the proposed HIFU sequence. This enables to optimize the heat parameters (electrical power, duration) so that to maximize heat deposit at focus and minimize skull heating.
It is then possible to derive the predicted thermal dose map in the heated region according to its definition:
(7)
with the integration over the whole heating period (expressed in minutes), T being the temperature (°C) and R a constant which value is 0.5 when T is greater than 43 and 0.25 otherwise. D is this the equivalent duration (in minutes) of a 43°C heating that would yield to the same tissue damage than the given treatment. The literature gives a threshold of 240 minutes equivalent 43°C to get necrosis in muscle and 25 minutes equivalent 43°C for brain tissue (Sapareto and Dewey 1984, Dewey 1994, Daum and Hynynen 1998).
Boundary conditions were used to simulate the cooling at the interface between the skull and the transducer. In the literature, the following values can be found for the thermal parameters of tissues: 0.52 W/m/K for the diffusion constant, very close to the value of pure water and 3700 J/kg/K for the heat capacity (Sekins et al 1982, Chato 1985, Duck 1990). The values found for the heat diffusion constant in the brain differ a lot from one source to another and from one part of the brain to another ranging from 0.16 to 0.57 W/m/K with mean value around 0.35 W/m/K (Johansson et al 2006). The perfusion term -bb cb(T-Tb) was added in equation (6) for
in vivo cases with following parameters taken from Elwassif et al (2006): blood density 1050kg/m3, blood temperature 36°C, blood heat capacity 3600 J/kg/K and blood flow 4.10-3s-1. The values for the other needed acoustic parameters remained equal to the ones used for the viscoelastic simulations.
Such a planning procedure could be useful to optimize the HIFU parameter prior to treatment. It relies on an accurate estimation of the acoustic pressure in situ and thus depends on the reliability of the acoustic radiation force imaging procedure. The simulation results have been compared with the experimentally measured temperatures.
D – Magnetic Resonance sequence for the quantification of the stiffness of the treated area after HIFU therapy
A MR-Elastography (MRE) acquisition was performed at 400Hz with an isotropic resolution of 500μm and 64*64*46 voxels. As described on Figure 3B, the MRE sequence consisted in a standard multislice spin-echo sequence with additional MSG (TE=26ms/TR=468ms). Two groups of three periods of 400Hz sinusoidal MSG were placed at equal distance around the 180° pulse. Piezoelectric bending plates (Piezo Systems, USA) were used to generate a 400Hz monochromatic mechanical excitation. The plate was coupled to the head of the animal via a homemade optimized piston. The acquisition and the mechanical excitation were synchronized so that to control the phase offset between the MSG and the displacements generated in tissues. This acquisition was repeated for 8 equally-spaced time steps to cover one full mechanical excitation period. The whole sequence was then repeated for each of the three MSG directions so that to record all components of the wave vector. Finally, the full 4D spatio-temporal displacement field was obtained. Total duration for the MR-Elastography acquisition was 45 minutes.
After acquisition, phase images were sorted and unwrapped. A 3D local inversion algorithm was then applied in order to reconstruct the maps of the complex shear modulus. This processing has already been described in previous papers and has shown ability to accurately quantify the stiffness of tissues in ex vivo and in vivo experiments including clinical tests (Sinkus et al 2005, Sinkus et al 2007, Huwart et al 2008).
The whole MR-Elastography acquisition was repeated before and after the HIFU session so that to get an initial mapping of the elastic properties of the treated area. This reference was mandatory in order to differentiate between natural stiff structures and necrosis induced stiffening. Pre and post images were not exactly registered one with another but one high resolution T2 scan was recorded for each elastography acquisition with registered voxels. This allows comparing the stiffness of corresponding anatomical structures from one MRE scan to another. Furthermore the positioning of the animal head and of the stack of slices was reproducible.
For each direction of motion encoding, the projection of the local displacement vector A(r) (in meters) is encoded in the phase r(in radians) of the MR-signal according to the following equation:
(8)
where is the MSG period, the proton Larmor frequency, N the number of MSG periods (N=6 in the present case) and G the MSG strength.
E –Protocol
The three previously described sequences were integrated into a complete protocol during an HIFU session inside the high field MRI scanner.
The monitoring protocol consisted in the following consecutive acquisitions:
Anatomical standard T1 and T2 imaging prior to necrosis (acquisition time : 30 minutes),
MR Elastography prior to necrosis (acquisition time : 45 minutes),
Radiation force localization and quantization over 1-5 slices transverse and parallel to the US beam (acquisition time : 10 minutes),
Follow up of the temperature rise in the focal plane during the HIFU session (acquisition time : 3 minutes),
MR Elastography posterior to necrosis within one hour after HIFU (acquisition time : 45 minutes),
Anatomical T1 and T2 imaging posterior to necrosis (acquisition time : 30 minutes).
The full Magnetic Resonance guided Focused Ultrasound Surgery (MRgFUS) examination lasted 3 hours. This protocol was first conducted in in vitro turkey breast samples to set up all sequences in non stringent conditions. Then, dead rats were used with and without skull in order to optimize the detection of the acoustic beam through the skull. This enabled us to optimize the MR imaging parameters and to design an optimized stereotactic frame with 2 degrees of freedom in translation. The mounting of the transducer was also improved with one free translation and one free rotation (Figure 1). The acoustic power at the focus was found to be decreased by a factor of roughly 4 in the presence of the bone as predicted from the calibration in water. Finally, the optimized MR and US sequences were tested on healthy living rats.
The duration of the HIFU shots and the number of sessions varied from one animal to another in order to test different thermal doses and heating strategies. It ranged from one 10s session to three 20s sessions or one 100s session. The electrical peak power for both the HIFU and the radiation force steps remained under 40W.
The thickness of the rat skull was smaller than the wavelength (<1mm) and thus generated negligible phase aberration. Consequently, the location of the focal point was not affected by the presence of the skull and the above mentioned protocol could be conducted using only one US element.
The follow up procedure in vivo consisted in repeating the MRE, T1 and T2 acquisitions every four to seven days for up to three weeks.
III. RESULTS
A – Simulations
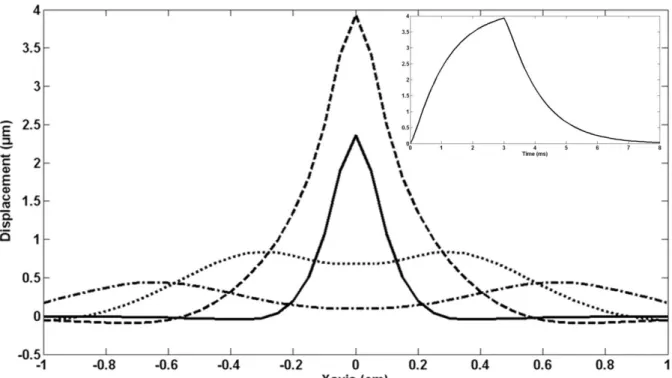
Figure 4 shows the spatial and time profiles of the simulated displacement at the focus for a 3ms ultrasound sonication. The spatial profiles show that waves start to propagate from the focus location after the sonication. This could result in an alteration of the accuracy of the localization for too long motion encoding. The time profile shows that displacements remain at the focus long after the sonication is stopped. This has to be taken into account for the optimization of the timing of motion encoding gradients.
Figure 4: Simulated displacement profiles along the central line in the focal plane at 4 different times after the beginning of the 3ms US emission (main frame): 1ms (solid line), 3ms (broken line), 5ms (dotted line) and 7ms (mixed line). Simulations were done assuming a density of 1000kg/m3, a speed of sound of 1540m/s, an attenuation factor of 6Np/m/MHz, a peak pressure value of 2.66MPa, a shear velocity of 1.5m/s and a shear viscosity of 1Pa.s. The time profile of the maximum displacement at the focus for a 3ms pulse is given in the top right corner.
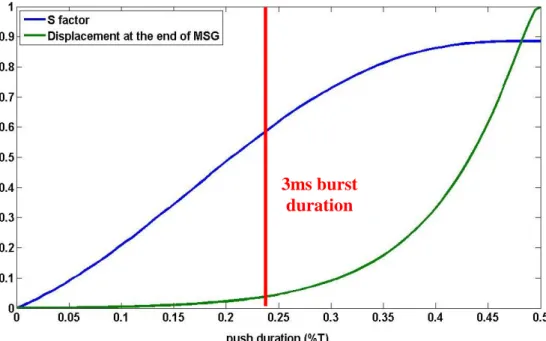
Figure 5 shows the results of simulations for different durations of the ultrasonic push. Even when the US pulses last half a period, the sensitivity S remains under 1 because of finite rising times for displacements. The normalized value of the displacement at the end of the MSG period is superimposed on the same plot. This residual displacement at the end of the first MSG cycle generates an imperfect refocusing of the magnetic spins during the 180° radiofrequency pulse of the spin echo sequence. It thus potentially degrades phase encoding and SNR. The optimal balance between both effects must be found experimentally. If they can be considered as equally important, the duration which maximizes the sensitivity while minimizing the residual motion corresponds to the one with the greatest distance between both curves. From this graph, this condition is reached for a pushing time of 0.32T ie 4.33ms. However, preliminary experiments showed that increased SNR and more accurate phase measurements were obtained for shorter pulses. A good compromise was found with 3ms pulses. Moreover, this choice minimizes the overall duty cycle of the US transducer. This optimized duration gives a value of 0.55 for S.
Figure 5: Evolution of the sensitivity to motion S (blue line) and the normalized amplitude of the displacement at the end of the Motion Sensitizing Gradients (green line) as a function of the US pulse duration (given in fraction of MSG periods). A 3ms burst duration (corresponding to 0.225 T) was experimentally found as an optimum. Simulations were done assuming a density of 1000kg/m3, a speed of sound of 1540m/s, an attenuation factor of 6Np/m/MHz, a peak pressure value of 2.66MPa, a shear velocity of 1.5m/s and a shear viscosity of 1Pa.s.
From the simulated displacement field, it is possible to emulate the MR phase signal using eq (3) and taking into account the partial volume effect. It was done for different values of the maximum acoustic pressure up to 3.5MPa with fixed values for the speed of sound, the attenuation, and the viscoelastic parameters. Figure 6 shows a plot of the pressure at the focus as a function of the simulated MR phase signal.
Figure 6: Experimental MR phases obtained in the rat brain (green circles) for different voltages on the transducer. The pressure values are the estimated ones according to the calibration of the transducer in a water tank. Simulated maximum MR phase signal for different acoustic pressure (dotted line). Simulations were done assuming a density of 1000kg/m3, a speed of sound of 1540m/s, an attenuation factor of 6Np/m/MHz, a shear velocity of 1.5m/s and a shear viscosity of 1Pa.s. Simulations are in good agreement with the experimental results.
In order to verify the consistency of ideal experimental data with this simulated curve, the proposed MR sequence was used in vivo in a rat brain right after the calibration of the transducer in free water. Special care was taken to get a good mechanical coupling between the transducer and the head and to avoid reverberations. The acquisition was repeated in the focal plane for different applied voltages on the transducer. In such ideal conditions, the expected focal pressure could be calculated from the calibration values in water, simply using a
3ms burst
duration
2-fold attenuation ratio through the skull. These estimated pressure values are plotted in Figure 6 as a function of the measured MR signal. The good agreement between experimental and simulated curves tends to demonstrate that the experimental MR signal is linked to the focal pressure via the proper theoretical quadratic law. Of course, such a good agreement is found only when the amplitude loss when moving from the calibration step in water to the in vivo experiments can be properly estimated.
This method for estimating the pressure in situ could have important application in practical HIFU experiments to detect unexpected effects before high power sonications: for example a bad coupling, strong reverberations, or a change of the impedance or the electro-mechanical conversion rate of the transducer. In such cases, the knowledge of the electrical voltage or the power is not sufficient to rely on for focal pressure estimation. The MR-Acoustic Radiation Force Imaging (MR-ARFI) signal brings a lot of information in such conditions: from its value, it is possible to go back to the simulated dotted line on figure 6 to estimate the maximum pressure which should have created such an MR signal, assuming that the focal spot was not distorted as compared to a perfect coupling. This targeting method thus has quantification capabilities.
B – Validation of the protocol on in vitro turkey breast samples
The proposed protocol was successfully performed in turkey breast samples. Example images are given on Figure 7. The focal plane is determined using the MR-ARFI sequence over 5 adjacent slices oriented transverse to the beam. The slice with maximum encoded displacement is assumed to contain the focal plane (Fig 7A). As the dimension of the focal spot is 8mm in depth, the averaging due to partial volume effect over 3mm thick slices is not significant neither for the detection of the maximum displacement nor for temperature estimates. In the focal slice, the temperature change is mapped during one 35s HIFU session with a maximum pressure equal to 3.67MPa (Fig 7B) according to the calibration procedure. The equilibrium temperature of the sample inside the MR scanner is 21°C as measured with a thermocouple. The result of the finite difference heat simulation fits the experimental data points (Fig 7C) with the following parameters in accordance with the literature: heat capacity 3700 J/kg/K, and thermal conductivity 0.52 W/m/K. The resolution was degraded to match with the voxel size of the MR-thermometry acquisition. A maximum temperature of 56°C is reached. A thermal dose of 412 minutes equivalent 43°C is calculated from the experimental temperature measurements at the focus.
Figure 7: The full protocol was performed in a turkey breast sample: The focal point corresponds to the maximum displacement in the coronal slice corresponding to the focal plane (A). The thermometry map (B) at the end of a 35 seconds HIFU session is clearly correlated with the radiation force map (A). The time profile of the absolute temperature at focus is given on image C (green circles) in degree Celsius together with the corresponding simulated data (blue line).The elastography maps before (D) and after (E) the HIFU session show an increased stiffness at the focal point several minutes after HIFU. The scale for elasticity is given in kPa. Image F presents a post-treatment cut of the necrosed sample along the beam axis.
After the HIFU treatment, a significant increase of stiffness is observed around the maximum heated point (Fig 7D and 7E). The mean elasticity rises from 27.0±0.8 kPa to 75.7±2.7 kPa in a 5mm by 5mm box around the treated region. Such values are consistent with previous data (Wu et al 2001). The necrosis and its shape and position are finally confirmed when the sample is cut after the experiment. Figure 7F shows a picture of the thermocoagulated tissue at the end of the protocol. The cut plane is oriented along the US beam axis.
C – Validation of the protocol on in vivo rat brain
Using the same MRgFUS protocol, in vivo brain HIFU investigations were conducted on five wild type Fisher rats. The proposed imaging sequences were successfully acquired. Example images are given in Figure 8. The component of the radiation force induced displacements in the US propagation direction were mapped in 5 adjacent coronal slices with high sensitivity (<1µm). The same component of displacement is more difficult to measure in the axial or sagittal orientation due to partial volume effect in the slice selection direction. Nevertheless, such a displacement pattern along the US beam could also be imaged as shown on Fig. 8F.
In all rats, a significant heating resulted in an inflammatory response on the cortex close to the skull as visible as a hyper signal in T2 standard images (Figure 9). Three rats also presented burns on the skin in the US
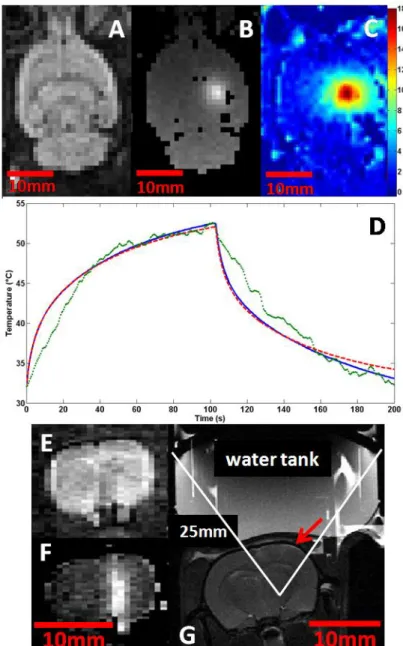
pathway. Indeed, due to the length of the focal zone, the skull bone was sonicated with high acoustic power and significantly heated due to bone absorption. An efficient way to avoid overheating the skin was to cool the scalp with circulating cold water (10°C) during HIFU. This was combined with a slow heating strategy (moderate power, 103 seconds) so that to let the water pump out the heat from the skull. This was successfully tested on the fifth rat with no visible skin burns, limited inflammatory reaction at contact with the skull, and sufficient heating in the targeted area (Figure 8C and 8D). For this animal, the maximum focal pressure is estimated from the radiation force imaging at 1.69MPa. The expected temperature rise is simulated with and without perfusion assuming this maximal pressure. The results are spatially degraded to match with the geometry of the voxels of the MRI acquisition. A thermal conductivity of 0.31W/m/K was found to give a better fit of the experimental data than the previously used 0.52W/m/K value documented for in vitro muscle. This will be discussed in section IV. A thermal dose of 560 minutes equivalent 43°C is calculated from the experimental temperature measurements at the maximum heated point.
Figure 8: Validation of the proposed protocol in the rat brain in vivo. Magnitude image from the MR-ARFI sequence in the coronal plane corresponding to the focal plane of the HIFU transducer (A). Corresponding motion encoded phase image allowing the accurate localization of the US focal spot and the quantitative calibration of the sent pressure with limited sent energy (B). The focal spot can also be imaged along the beam as shown on axial images (magnitude E, phase F). Map of the temperature elevation (C) in the same coronal slice as (B) during an HIFU session after 100s. Temperature in °C at the focus (D) as a function of time (green circles) together with the results of finite difference simulations of the same experiment with (red dashed line) and without (blue solid line) considering the perfusion term in eq(6).Axial T2 image immediately after the HIFU session (G). The red arrow indicates early inflammatory response of the cortex and the skin in contact with the heated skull.
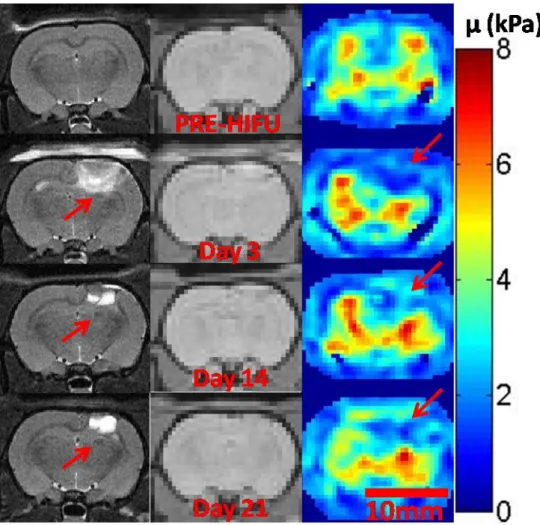
The measured thermal dose was sufficient to expect thermal necrosis at the focus for two rats. In both animals, the skull was overheated which resulted in a cone shaped heated volume following the US pathways which was clearly visible as a T2 hypersignal. The elasticity maps in the heated regions appeared to be significantly softer than before HIFU even 3 weeks after HIFU. Figure 9 compares the elasticity map of corresponding axial slices at 4 different times for the same animal as on figure 8: before HIFU, 3 days later, after 14 days and after 21 days. The geometry settings of the MRE acquisition were registered to the T2 scans. Thus, the corresponding T2 images are also shown on Figure 9 (left column). Although the measured temperature rise at the focus (Figure 8) ie under the ventricles and under the T2 hypersignal regions remained sufficient to induce a thermal necrosis, elasticity maps showed no evidence for it. A T2 hyposignal was however noticed at the end of the inflammatory region (see arrows on Figure 9 left column). The relatively low inflammatory response under the ventricles where the acoustic pressure was expected to be maximal could be explained by an unexpected phenomenon such as a cooling effect of the cerebro-spinal fluid or cavitation in the ventricles. Considering the less deep heated regions, the initial inflammatory response seemed to decrease until becoming localized to the cortex area after 3
weeks. The elasticity remains significantly lower than before HIFU after 3 weeks and this may not be solely explained by the initial presence of oedema as discussed in section IV.
The animals were kept alive for up to three weeks after the HIFU session and their brains were taken out for histological investigations. Figure 10 shows one histology slice taken at the approximative depth of the focal plane where the T2 hyposignal was observed. Macrophage necrosis and astroglyosis were found.
One rat died during the post-treatment imaging procedure, probably due to a wrong positioning of the head of the animal resulting in a partial obstruction of the airways. Another rat presented a haemorrhage together with an overall increase of the elasticity of the brain parenchyma. This might be due to an increase of the liquid pressure inside the skull resulting in a compression of the brain. A hemorrhagic lesion was confirmed after histological analysis on top of the cerebellum. A better targeted region with no major vasculature together with a limited acoustic power may have avoided this event.
Figure 9: Evolution of the T2 hypersignal and elasticity in the plane of maximum heating. Left column : T2 axial images at four time steps : before HIFU, after 3, 14 and 21 days. Red arrows indicate abnormal T2 hyposignals. Middle and right columns: corresponding MRE magnitudes slices and reconstructed elasticity maps µ(kPa). Red arrows indicate the abnormally soft region.
Figure 10: Right: Horizontal histology slice around the location of the T2 hyposignal on figure 9. Left : Microscopic view of the thermally induced lesion showing macrophage necrosis and astroglyosis.
IV. DISCUSSION
In this work, the ability of localizing the ultrasonic focal spot before the HIFU session was demonstrated both
ex vivo and in vivo in the rat brain through the intact skull. A new way of localizing and quantifying the acoustic
field in the brain was demonstrated. An important point is that the localization is achieved once the animal is positioned for the treatment and with the same ultrasonic transducer: it optimizes the precision of the targeting. Monitoring of heat deposition during the HIFU session was also achieved in real time (two images per second). Then, HIFU-induced changes were demonstrated in vitro and in vivo with MR-elastography. The important presence of oedema seems to be responsible for a global decrease of the elasticity in the treated region which could hide minor stiffness changes due the necrosis itself.
Due to overall dimension inside the imaging bed when using a stereotactic frame, the whole protocol could not be completed in vivo with only one single positioning of the animal. In a first position, anatomy scans and a reference elastography acquisition were acquired. Then, the MR-elastography vibrating plates were replaced by the US transducer on top of the rat head. The proposed therapeutic procedure was conducted with a pretreatment visualization of the focal point of the HIFU transducer at non therapeutic level, followed by ultrasonic tissue ablation at that same location with a high frame rate temperature monitoring. Last, anatomy and elastography acquisitions were repeated with the rat back to a position close to the initial one. This makes it difficult to exactly spatially match the calculated elasticity maps before and after the treatment one with another. It thus prevents from doing voxel to voxel comparisons or to process a differential map of tissue mechanical property changes during HIFU.
The developed MR sequence for the localization of the acoustic radiation force allowed the detection of small motion (<1μm) with limited energy deposition. In order to verify the safety of the US beam during this sequence, a turkey breast sample was submitted to an US sonication sequence identical to the one used during the localization step in terms of acoustic power, duration and duty cycle (IIb). Meanwhile, the temperature elevation was measured at focus with the same MR-thermometry sequence as the one used during the HIFU session (IIc). In the worst scenario corresponding to a US duty cycle close to 5%, the temperature rise remained less than 1.5°C after 2 minutes sonication. For this test, the acoustic power was greater than the highest value used for HIFU. This verification was also done in vivo and the maximum temperature elevation remained barely measurable (noise level around 1°C). Finally, one additional rat was sacrificed between the localization step and the HIFU step of the MRgFUS protocol. Macroscopic examination as well as histology did not find any damage of the brain tissue at the localized focus position.
One has to mention that another technique has been proposed recently to verify the location of the focal point prior to the HIFU sonication: the so called “siting” shot technique (ter Haar and Coussios 2007). It consists in using the HIFU device for a sufficient duration to induce a detectable heating at the focus without damaging the tissue. The hot spot is detected with MR-thermometry sequences. No comparison of the proposed technique with this thermal technique was done here. “Are motion sensitive sequences more suited for focus quality assessment than thermometry measurements?” remains an open and interesting question. The high field MR system is very sensitive to motion thanks to very strong gradients but the MR-ARFI acquisition is slow. On contrary, the FLASH sequence is fast with degraded signal to noise ratio and thus has limited but sufficient temperature sensitivity. It is thus difficult to compare both regarding sensitivity and quantization since they were designed for two different purposes. However, because of its sensitivity, the MR-ARFI sequence should be better suited for the detection and quantization of low energy acoustic sonications. Regarding localization though, the shear wave propagation limits the spatial resolution of the MR-ARFI sequence and is directly related to the duration of motion encoding whereas the thermal diffusion limits the resolution of the thermometry sequence and is determined by the frame rate. To compare the localization capabilities of the two sequences used in the present work, one should compare the shear wave propagation distance within 6.66ms in the brain (typically 11mm for 1.6m/s shear wave speed) with a characteristic thermal diffusion distance after a long enough US sonication time to be detected with a reasonable US power (typically 0.7mm after 5s in the brain). In theory, spatial distribution of temperature changes could thus provide a more accurate positioning of the focal spot than the spatial distribution of tissue displacements induced by the acoustic radiation force. Finally, one has to consider the fact than the MR-ARFI sequence relies on a very safe way of using ultrasound since the displacements can be detected with limited acoustic power and limited duty cycle whereas the thermometry approach implies to send US in continuous mode with increased risks of overheating at the focus or elsewhere. From this point of view, the motion detection approach is safer.
Regarding the in vivo thermometry experiments, it is possible to identify several possible explanations for the relative discrepancy between the measured temperature/time curves and the simulated ones. As already mentioned, residual respiratory motion was an important limitation which created artifacts in the phase images and imposed to low pass filter the data. Respiratory motion had two other effects on temperature estimation. First, the focal spot slightly moved in plane and in depth during HIFU. This resulted in larger heated spot, decreased maximum temperature and slower temperature decrease after HIFU because of lower thermal gradient values in the brain. This explains why the temperature rise at the beginning of the HIFU treatment and the temperature decay at the end of the treatment are slower than the simulated ones and why a quite horizontal plateau is reached at the end of the heating period. Second, the motion induces time dependent ultrasonic reflections from the rat head to the piezoelectric material resulting in a slightly varying acoustic power due to changes in the electrical impedance.
One important limitation of our simulation model is the fact that it does not take into account the thermostat of the rat body as a boundary condition. It does not consider the brain as confined into an isolated box but rather assumes that diffusion occurs in an open infinite space. Another source of error is the lack of accurate data available in the literature on the perfusion parameters which impacts on the simulations at late times especially in the case of long heating scenario. As already mentioned, the thermal conductivity in the brain reported in the literature is ranging from 0.16 to 0.57W/m/K. The exact value impacts a lot on the simulations. In our case, a value of 0.31 W/m/K is shown to best fit the data. This is close to the published mean value in the brain 0.35 W/m/K (Johansson et al 2006).
Regarding the elasticity assessment, MR-Elastography of the whole brain was feasible at high field in vivo and in 3D with a fully local 3D inversion. The brain showed significant changes of the complex shear modulus after the HIFU session. The observed evolution is different from a simple thermocoagulation as observed in in
vitro muscle and more complicated to understand. To our knowledge, little is available in the literature about the
stiffness of thermally induced brain necrosis. The burnt areas present important oedema still visible with T2 imaging after 3 weeks. This inflammatory response increases the liquid content in the heated region and competes with the necrosis itself for effective mechanical properties of the region. Since the elastography acquisition relies on low frequency shear wave propagation which is very sensitive to the presence of water (water cannot be sheared), it is possible that the presence of oedema could solely explain our observations. Alternatively, it is important to notice here that the lipid content of the brain is ranging from 40 to 80% especially in myelinated regions (O’Brien and Sampson 1965). A slow heating process may melt the lipids without significantly decrease the water content which would result in an almost liquid necrosis. Interestingly, previous papers relate liquid necrosis induced by focused ultrasound (Lake et al 2008, Pauly et al 2006). Furthermore, it is known from physicians that necrosis in brain tissue can be of two kinds: coagulation necrosis and liquefactive necrosis depending on the physical or biological processes at the origin of the tissue degeneration. The liquefactive necrosis results from a degradation of tissue architecture by lysosomes leading to liquefied areas containing necrotic debris. This hypothesis should be investigated in the future.
Parallel to the elastography, other techniques such as contrast-enhanced T1 imaging and diffusion-weighted imaging have been investigated for the final MR assessment of HIFU necrosis (Funaki et al 2007, Jacobs et al 2005). Recently, a new technique based on the magnetization exchange between macromolecules and water in tissues showed a good contrast between coagulated and untreated tissues (Carasso et al 2008). In a prospective approach, the elastography needs to be compared to those modalities and correlated to anatomopathological data in order to determine whether it could bring valuable additional information after brain HIFU. To become competitive, several improvements should be done regarding data acquisition (ie the mapping resolution which is linked to the sequence SNR and the elastic accuracy which is linked to the chosen mechanical wavelength) and data processing (currently, the 3D local inversion algorithm assumes that tissues are locally homogeneous and isotropic). It might then be possible to get sufficiently high resolution elasticity data to be able to distinguish the necrosis from the oedema.
The temperature imaging is of great use to keep an eye on the temperature of sensitive regions and to measure the thermal doses with almost real time capabilities whereas the MRE technique can only be used once or twice. Therefore the two techniques are not in competition. Each of them delivers different information to physicians. In this context and in the perspective of human brain therapy, it would be highly preferable to not solely rely on anatomical imaging and measured thermal dose map to conclude about treatment success.
Finally, as a whole procedure, the three techniques complement each other in an interesting cycling way: elastography prior to HIFU gives a good estimation of the viscoelastic parameters to be used in the viscoelastic simulations to calculate the expected calibration curve. This curve enables accurate estimation of the experimental pressure at the focus from MR-ARFI data which in turn enables reliable bioheat simulations allowing to better plan the treatment step. In fact, the predicted thermal dose has been shown to be reliable only
in case of an in situ acoustic pressure measurement. The experimentally measured thermal dose validates the pressure estimation and the viscoelastic parameters.
V. CONCLUSION
The first goal of this study was to develop a therapy and imaging system for MR guided transcranial brain HIFU experiments in small animals. The availability of well characterized brain tumor models motivated our choice of rats for those investigations. Such a protocol and setup will be a valuable tool for evaluating the biological interaction of ultrasound with tissues and for investigating the benefit of ultrasound therapy on tumor models. This will be done in future works at 7T.
The second aim of this work was to show that MR-Acoustic Radiation Force Imaging was feasible in vivo in the brain. It has been shown to provide a new way to localize the focal point in situ and the corresponding MR signal has been demonstrated to be quantitatively related to the maximum pressure at the focus. These quantification capabilities are unique and should be valuable for future clinical treatment planning.
The most interesting techniques developed here could be easily transposed to clinical scanners for human brain MRgFUS. They need to be combined with a multi-element transducer array to correct for the aberrations through the human skull.
ACKNOWLEDGEMENTS
Authors would like to acknowledge Abdel Souilah for his ideas and skills in designing and manufacturing the fully integrated positioning system for HIFU investigation in our MR scanner.
REFERENCES
Abolhassani MD, Norouzy A, Takavar A, Ghanaati H. 2007 Feb; Noninvasive temperature estimation using sonographic digital images. J Ultrasound Med. 26(2):215-22.
Arthur RM, Straube WL, Starman JD, Moros EG. 2003 Jun; Noninvasive temperature estimation based on the energy of backscattered ultrasound. Med Phys. 30(6):1021-9.
Arthur RM, Straube WL, Trobaugh JW, Moros EG. 2008 Aug; In vivo change in ultrasonic backscattered energy with temperature in motion-compensated images. Int J Hyperthermia. 24(5):389-98.
Atay SM, Kroenke CD, Sabet A, Bayly PV. 2008 Apr; Measurement of the dynamic shear modulus of mouse brain tissue in vivo by magnetic resonance elastography. J Biomech Eng. 130(2):021013.
Aubry JF, Tanter M, Pernot M, Thomas JL, Fink M. 2003 Jan; Experimental demonstration of noninvasive transskull adaptive focusing based on prior computed tomography scans. J Acoust Soc Am. 113(1), pp 84-93.
Bercoff J, Tanter M, Fink M. 2004a; Supersonic shear imaging : a new technique for soft tissue elasticity mapping. IEEE Transactions on Ultrasonics Ferroelectrics and Frequency Control, vol. 51, no. 4, pp.396–409.
Bercoff J, Pernot M, Tanter M, Fink M. 2004b Apr; Monitoring thermally-induced lesions with supersonic shear imaging. Ultrason Imaging. 26(2):71-84.
Bercoff J, Tanter M, Muller M, Fink M. 2004c Nov; The role of viscosity in the impulse diffraction field of elastic waves induced by the acoustic radiation force. IEEE Trans Ultrason Ferroelectr Freq Control. 51(11):1523-36.
Carasso D, Hanannel A, Navon G. 2008 Jul; A new MRI method, tested in vitro for the assessment of thermal coagulation and demonstrated in vivo on focused ultrasound ablation. NMR Biomed. 21(6):637-43.
Chato JC. 1985; Selected thermophysical properties of biological materials In: Shitzer A, Eberhart R (eds) Heat transfer in medicine and biology: analysis and applications, vol 2. Plenum Press, New York, pp 413–418.
Cohen ZR, Zaubermann J, Harnof S, Mardor Y, Nass Dvora, Zadicario E, Hananel A, Casterl D, Faibel M, Ram Z. 2007; Magnetic Resonance Imaging-Guided Focused Ultrasound For Thermal Ablation in the Brain: A Feasibility Study in a Swine Model, Neurosurgery, 60(4):593-600.
Daffertshofer M, Hennerici M. 2003 May; Ultrasound in the treatment of ischaemic stroke. Lancet Neurol. 2(5):283-90. Review.
Daum DR, Hynynen K. 1998; Thermal dose optimization via temporal switching in ultrasound surgery. IEEE Trans Ultrason Ferroelectr Freq Control. 45(1):208-15.
Deckers R, Quesson B, Arsaut J, Eimer S, Couillaud F, Moonen CT. 2009 Jan 21; Image-guided, noninvasive, spatiotemporal control of gene expression. Proc Natl Acad Sci USA.
Deckers R, Rome C, Moonen CT. 2008 Feb; The role of ultrasound and magnetic resonance in local drug delivery. J Magn Reson Imaging. 27(2):400-9. Review.
Dewey WC. 1994 Jul-Aug; Arrhenius relationships from the molecule and cell to the clinic. Int J Hyperthermia. 10(4):457-83. Review. de Senneville BD, Quesson B, Moonen CT. 2005 Sep; Magnetic resonance temperature imaging. Int J Hyperthermia. 21(6):515-31. Review. Duck FA.1990; Physical properties of tissue : a comprehensive reference book. Academic Press.
Elwassif MM, Kong Q, Vazquez M, Bikson M. 2006 Aug; Bio-Heat Transfer Model of Deep Brain Stimulation Induced Temperature changes. 28th Annual International Conference of the IEEE Engineering in Medicine and Biology Society. pp580–3583.
Fatemi M, Greenleaf J. 1998; Ultrasound-stimulated vibro-acoustic spectrography. Science, vol. 280, no.5360, pp. 82–85.
Fennessy FM, Tempany CM. 2006; A review of magnetic resonance imaging-guided focused ultrasound surgery of uterine fibroids, Top Magn Reson Imaging, 17(3):173-179.