HAL Id: hal-01464337
https://hal-amu.archives-ouvertes.fr/hal-01464337
Submitted on 15 Feb 2017
HAL is a multi-disciplinary open access archive for the deposit and dissemination of sci-entific research documents, whether they are pub-lished or not. The documents may come from teaching and research institutions in France or abroad, or from public or private research centers.
L’archive ouverte pluridisciplinaire HAL, est destinée au dépôt et à la diffusion de documents scientifiques de niveau recherche, publiés ou non, émanant des établissements d’enseignement et de recherche français ou étrangers, des laboratoires publics ou privés.
Responses of single corticospinal neurons to intracortical
stimulation of primary motor and premotor cortex in
the anesthetized macaque monkey.
Marc Maier, Peter Kirkwood, Thomas Brochier, Roger Lemon
To cite this version:
Marc Maier, Peter Kirkwood, Thomas Brochier, Roger Lemon. Responses of single corticospinal neurons to intracortical stimulation of primary motor and premotor cortex in the anesthetized macaque monkey.. Journal of Neurophysiology, American Physiological Society, 2013. �hal-01464337�
Responses of single corticospinal neurons to intracortical stimulation of
primary motor and premotor cortex in the anesthetized macaque monkey
Marc A. Maier,1,2 Peter A. Kirkwood,3 Thomas Brochier,3 and Roger N. Lemon3
1Centre National de la Recherche Scientifique UMR 8194, Université Paris Descartes, Sorbonne Paris Cité, Paris, France;
2Université Paris Diderot, Sorbonne Paris Cité, Paris, France;3Sobell Department of Motor Neuroscience and Movement
Disorders, UCL Institute of Neurology, London, United Kingdom
Submitted 17 December 2012; accepted in final form 27 March 2013
Maier MA, Kirkwood PA, Brochier T, Lemon RN. Responses of single corticospinal neurons to intracortical stimulation of primary motor and premotor cortex in the anesthetized macaque monkey. J
Neurophysiol 109: 2982–2998, 2013. First published March 27, 2013;
doi:10.1152/jn.01080.2012.—The responses of individual primate corticospinal neurons to localized electrical stimulation of primary motor (M1) and of ventral premotor cortex (area F5) are poorly documented. To rectify this and to study interactions between re-sponses from these areas, we recorded corticospinal axons, identified by pyramidal tract stimulation, in the cervical spinal cord of three chloralose-anesthetized macaque monkeys. Single stimuli (ⱕ400A) were delivered to the hand area of M1 or F5 through intracortical microwire arrays. Only 14/112 (13%) axons showed responses to M1 stimuli that indicated direct intracortical activation of corticospinal neurons (D-responses); no D-responses were seen from F5. In con-trast, 62 axons (55%) exhibited consistent later responses to M1 stimulation, corresponding to indirect activation (I-responses), show-ing that sshow-ingle-pulse intracortical stimulation of motor areas can result in trans-synaptic activation of a high proportion of the corticospinal output. A combined latency histogram of all axon responses was nonperiodic, clearly different from the periodic surface-recorded cor-ticospinal volleys. This was readily explained by correcting for conduction velocities of individual axons. D-responding axons, taken as originating in neurons close to the M1 stimulating electrodes, showed more I-responses from M1 than those without a D-response, and 8/10 of these axons also responded to F5 stimulation. Altogether, 33% of tested axons responded to F5 stimulation, most of which also showed I-responses from M1. These excitatory effects are in keeping with facilitation of hand muscles evoked from F5 being relayed via M1. This was further demonstrated by facilitation of test responses from M1 by conditioning F5 stimuli.
corticospinal; monkey; motor cortex; axon
THE PRIMARY MOTOR CORTEX (M1) and its corticospinal output
are known to play a major role in controlling the hand (Lemon 2008; Phillips and Porter, 1977; Porter and Lemon 1993). Deciphering the action of electrical stimuli on cortical motor areas is important in terms of understanding “maps” of motor outputs and in interpreting the corticospinal volleys generated by such stimuli. Both of these can be useful for intraoperative monitoring during human neurosurgical procedures (Sala et al. 2006). Electrical stimulation reveals that both primary and secondary cortical motor areas contain hand representations; the secondary motor areas are characterized both by having their own separate corticospinal projections to the spinal cord, and by reciprocal corticocortical connections with M1 (Dum
and Strick 1991, 2002). Compared with other secondary areas, corticospinal outputs from the ventral premotor area (PMv, F5) are few and project mostly to midcervical levels, and only sparsely to the cervical enlargement, where motor nuclei sup-plying hand muscles are located (Borra et al. 2010; Galea and Darian-Smith 1994; He et al. 1993). The function of these descending corticospinal projections from F5 is still unknown. In contrast to these corticospinal projections, corticocortical connections between area F5 and M1 are numerous and form part of the “visuomotor grasping circuit” (Jeannerod et al. 1995), which also involves anterior intraparietal area in the posterior parietal cortex. This circuit is considered to transform visual information about graspable objects into appropriate grasping actions, and the projections from F5 to M1 are consid-ered to play a key role in this visuomotor transformation. F5 provides more corticocortical projections to M1 than any other secondary motor area (Dum and Strick 2005), suggesting that the corticocortical projection of F5 to M1 might be of more functional importance for grasp than the F5 corticospinal projection.
We have previously investigated the mechanisms underlying the F5-M1 interaction in the behaving monkey performing a visuomotor grasping task (Kraskov et al. 2011; Prabhu et al. 2009), as well as in both the lightly sedated (Cerri et al. 2003; Schmidlin et al. 2008) and anesthetized monkey (Shimazu et al. 2004). Together, these studies have provided evidence that F5 can, via its corticocortical projection, excite or suppress corticospinal neurons in M1 (Ghosh and Porter 1988; Kraskov et al. 2011; Tokuno and Nambu 2000) and facilitate M1-evoked corticospinal volleys (Schmidlin et al. 2008; Shimazu et al. 2004), resulting in facilitation of responses in hand and finger muscle motoneurons (Shimazu et al. 2004) and robust facilitation of EMG responses (Cerri et al. 2003; Prabhu et al. 2009). Evidence of F5-M1 corticocortical suppression has been found in the anesthetized (Ghosh and Porter 1988), sedated (Tokuno and Nambu 2000), and awake monkey (Prabhu et al. 2009).
What is still missing from this account of F5-M1 interactions is how individual corticospinal neurons respond to M1 stimuli and how these responses are modulated by F5 stimulation. Simultaneous stimulation and recording within the cortex is technically complicated, and the very earliest of responses are lost in the stimulus artifact (Kraskov et al. 2011). So in this study, instead of recording in the cortex, we recorded responses from the axons of corticospinal neurons at the level of the midcervical cord in deeply anesthetized monkeys (Edgley et al. 1997), while stimulating the cortex with arrays of intracortical electrodes. Such stimulation is well-known to excite a complex
Address for reprint requests and other correspondence: R. Lemon, UCL Institute of Neurology, National Hospital for Neurology and Neurosurgery, Queen Square, London WC1N 3BG, UK (e-mail: r.lemon@ucl.ac.uk). First published March 27, 2013; doi:10.1152/jn.01080.2012.
at SCDU Mediterranee on July 1, 2013
http://jn.physiology.org/
succession of direct (D) and indirect (I) waves in the cortico-spinal tract (di Lazzero et al. 2008; Jankowska et al. 1975; Patton and Amassian 1954; Shimazu et al. 2004; Stoney et al. 1968). Recordings from single corticospinal axons gave us an opportunity to examine the detailed time structure of responses in the tract and to make a comparison with the surface-recorded volleys. Such single-axon recordings have the advantage of not being subject to the serious problems of cancellation and dispersion in surface volleys recordings, which particularly affect the amplitude of the I-waves (Amassian et al. 1987). Surface volley recordings may also include activity in non-corticospinal pathways; again, this is avoided by direct record-ing from corticospinal axons.
Ultimately, any modulatory effect of F5-M1 interaction at the motoneuronal level is mediated synaptically by particular ensembles of corticospinal axons, which may not be well-represented by the mass activity recorded as the corticospinal volley. Since this volley is likely dominated by the fastest conducting axons, it may hide responses transmitted by numer-ous slower-conducting axons present in the corticospinal tract (Firmin et al. 2011; Porter and Lemon 1993; Russel and DeMyer 1961). Here we show that the responses of single corticospinal neurons in M1, as detected by axonal recordings in the cervical cord, discharged repetitively following single-shock stimulation within the M1 hand area. These repetitive responses suggested that, while such stimulation activates relatively few corticospinal neurons directly, it can indirectly activate a very large proportion of the corticospinal output. The responding neurons showed a wide variety of patterns, not generally represented in the surface volley, and which may be related to whether or not the neuron’s cell body was actually located in the M1 hand area. Many of these M1 corticospinal neurons also responded to F5 stimulation, and one-half of those tested showed an effect of conditioning stimulation delivered to F5. Single-axon responses to F5 stimulation and to F5 conditioning were again more varied than the concurrent volley responses.
METHODS
Three purpose-bred, pair-housed adult macaque monkeys were used: CS15 (male, m. fascicularis 10.1 kg), CS22 (female, m.mulatta 8.7 kg), and CS23 (female, m.mulatta 9.5 kg). All procedures were carried out in accordance with the UK Animals (Scientific Proce-dures) Act 1986 and were approved by the local Ethical Review process.
Terminal Experiments
Terminal experiments were carried out as described by Maier et al. (1998, 2002). Anesthesia was induced using ketamine (10 mg/kg), and all preparatory surgery was carried out under deep isoflurane anes-thesia. Tracheal, femoral arterial, and femoral venous cannulae were inserted. A laminectomy over spinal segments C4 to Th1 and an occipital craniotomy were carried out. When surgery was complete, isoflurane was discontinued, and ␣-chloralose was given (50–80 mg/kg iv). The animal was mounted in a spinal frame and headholder, with clamps on the vertebral column at Th3 and in the lumbar region, and then neuromuscular blockade was induced with pancuronium bromide (Pavulon, Oregon-Technika, Cambridge, UK) at a dose of 0.3 mg·kg⫺1·h⫺1iv, and the animal artificially ventilated at a rate of 45 cycles/min. A bilateral pneumothorax was made, and an end-expiratory pressure of 2–3 cmH2O maintained. Adequacy of the
anesthesia was continuously assessed by reference to the blood pressure, heart rate, and pupillary reflexes. Body temperature was maintained between 37 and 39°C. Hartmann’s fluid was infused at a rate of 5–10 ml·kg⫺1·h⫺1, and fluid balance and blood gases were monitored and maintained. Each animal remained in good physiolog-ical condition throughout the recording. Mean blood pressure was maintained above 80 mmHg.
Stimulation Sites
Pyramidal tract. A stimulating electrode (varnish-insulated tungsten,
tip impedance 20 –30 k⍀ at 1 kHz) was inserted just rostral to obex (angled rostrally) and 0.5–1.0 mm to the midline. Monopolar, monopha-sic stimuli of 10 –200A (duration 0.1 ms) were used, and the cortico-spinal volleys evoked by these stimuli were recorded from the surface of the contralateral dorsolateral funiculus (DLF) close to the region from which the intra-axonal recordings were made (C4 –C6). Conventional electrophysiological criteria were used for final pyramidal tract (PT) electrode positioning (Maier et al. 1998).
Cortical sites. Cortical sites ipsilateral to the stimulated pyramid
were implanted with small arrays of four to five fine (100-m shank diameter) intracortical tungsten electrodes with sharpened tips and having low tip impedances (20 –100 k⍀ at 1 kHz), as described previously (Shimazu et al. 2004). Electrode length varied between 2 and 6 mm from the pial surface, and the interelectrode distance was 1–1.3 mm. Arrays of electrodes were targeted at the hand represen-tations of F5 (rostral PMv, inferior bank of the arcuate sulcus) and M1 (anterior bank of the central sulcus). Figure 1 shows the postmortem reconstruction of the surface location of the intracortical microwire electrodes sites in M1 and F5 of each monkey. The targets were based on structural MRI scans carried out in each monkey, and on the basis of many different earlier investigations of these areas (Prabhu et al. 2009; Schmidlin et al. 2008; Shimazu et al. 2004; Umilta et al. 2007). In one of the monkeys (CS15), these areas had been extensively mapped using repetitive intracortical microstimulation to guide the final locations at which the arrays were implanted, 6 mo before the terminal experiment. In the other two monkeys, the arrays were inserted at the beginning of the terminal experiment.
Intra-axonal Recordings From Corticospinal Axons
Intra-axonal responses were obtained from corticospinal axons in the DLF contralateral to the stimulated cortex. Recordings were made with glass microelectrodes filled with 3 M potassium acetate and having a DC resistance of 2–5 M⍀. A small pressure foot was used to reduce movement of the spinal cord. Corticospinal axons were iden-tified by their activation following stimulation of the contralateral PT. Intra-axonal and simultaneous DLF surface volley recordings were digitized directly at 10 kHz using a 1401 plus interface (CED, Cambridge, UK) running Spike2. The membrane potential was mon-itored throughout each recording, but the criterion for continued recording was solely that of sufficiently well discriminable positive-going spikes. Recording times varied from less than 1 min to 18 min.
Stimulation Protocols
Each axon was tested for its response to cortical stimuli delivered to pairs of electrodes (bipolar stimulation, one electrode as cathode, one as anode) within the arrays located in M1 and F5, delivered at a frequency of 2 Hz. A “default site” within each area was identified by initial inspection of the corticospinal volleys evoked from different electrode pairs: the default site was the pair producing the largest volleys with a single 400-A shock. The duration of the current pulse was 0.2 ms. In two experiments, the effects of stimulation through a different electrode pair was tested (“second site”).
For testing the interaction between F5 and M1 stimulation, we used condition (C), test (T), and combined (C-T) stimuli interleaved and
at SCDU Mediterranee on July 1, 2013
http://jn.physiology.org/
delivered as follows. C stimuli were single or double shocks to F5 (up to 400A); T stimuli were single shocks to M1 (up to 400 A). C-T intervals tested ranged between 0 ms (simultaneous delivery) and 3.2 ms (F5 before M1).
Histology
At the end of the experiment, small electrolytic lesions were placed at the cortical and PT stimulation sites by passing DC current (20A for 20 s, tip positive). The animal was given an overdose of barbitu-rate and perfused through the heart with formol saline. The fixed cortex was photographed; entry points of stimulating electrodes were clearly visible (Fig. 1, A, D, and E). Blocks of cortical tissue were taken in the parasaggital plane, and subsequently frozen sections (30 m) were cut. Drawings of sample cortical sections from CS22 showing the locations of cathodal electrodes in M1 and F5 are included in Fig. 1, B and C. Blocks of brain stem tissue were also taken, and histological analysis confirmed that in each experiment the tips of the PT electrodes were located in the left pyramid.
Analysis and Statistics
Analog spikes were discriminated sweep-by-sweep using a peak-detection function above a manually defined threshold crossing, and the digital events were displayed as poststimulus time histograms (PSTHs), with the digital event timed to correspond with the positive peak of the action potential. Latencies of axon responses to M1 and F5 stimulation were measured from stimulus onset to the peak of the PSTH distribution. Statistical testing of M1 or F5 responses was obtained using a two-tailed2test. The hypothesis that there was no
response was rejected if the bin count in the expected response range (10-ms poststimulus window) was significantly different from the bin
count in a latency range beyond the latencies of the surface volleys (20 –30 ms after the stimulus). Statistical significance was set at P⬍ 0.01. Statistical evidence of facilitatory or inhibitory conditioning responses was obtained using a two-tailed2test. The null-hypothesis
was that there was no significant (P⬍ 0.01) difference, for a given peak in the PSTH, between the sum total of spikes evoked by F5 and M1 stimuli, when given separately, and the number of spikes in the conditioned response (F5 and M1 stimuli given together). Volley latencies were measured from stimulus onset to the negative peak of the volley.
RESULTS
Location of Stimulating Electrodes in M1 and Area F5
The location of the cortical stimulating arrays in the three cases (CS15, CS22, and CS23) are illustrated in Fig. 1, A, D, and E. In all cases, the M1 array was implanted just anterior to, and parallel with, the central sulcus, and the F5 array was located just lateral to the arcuate spur and parallel with the inferior limb of the arcuate sulcus. All of the intracortical electrode sites were confirmed histologically to be within the gray matter. The location of the cathode (electrode 2) of the “default” site in M1 in CS22 is shown in Fig. 1B; its tip was located just above layer V. The location of the cathode (elec-trode 9) of the default site in F5 is shown in Fig. 1C; its tip lay in layer 5. The intracortical locations of the electrodes for the default sites in CS23 were similar, as were those in CS15, which have been published elsewhere (Prabhu et al., 2009; Fig. 2). The electrodes used as “2nd” sites in M1 and F5 are noted in the legend to Fig. 1.
A B
C
D E
Fig. 1. Cortical M1 and F5 stimulation sites in the three monkeys. A, D, and E: surface maps of the left cortex in monkey CS22, CS15, and CS23, respectively. Entry points of the electrodes in each array are indicated by numbers 1–10. The cathode (⫺ve, filled circle) and anode (⫹ve) most commonly used for stimulation in M1 and F5 (default sites) are indicated. A: the second M1 site in CS22 involved electrodes 4 (⫺ve) and 3 (⫹ve), while in F5 it was 7 (⫺ve) and 6 (⫹ve). E: in CS23, these were 2 (⫺ve) and 1 (⫹ve) for M1 and 9 (⫺ve) and 8 (⫹ve) for F5. The arcuate sulcus (ArcS), central sulcus (CS), and principal sulcus (PS) are shown. B and C: parasaggital histological sections from cortex of CS22. Sections are taken at the level indicated by the horizontal arrows in A. B: section shows location of cathodal M1 electrode (no. 2). C: section shows location of cathodal F5 electrode (no. 9). Dots in sec-tions indicate presence of large lamina V pyramidal cells.
at SCDU Mediterranee on July 1, 2013
http://jn.physiology.org/
Identification of Corticospinal Axons
Axons were penetrated in the DLF and identified as corti-cospinal by a response consisting of a single spike at constant latency to stimulation of the contralateral PT (Fig. 2, inset). Thresholds ranged from 6 to 400A, median 100 A, mean 111A. The distribution of response latency is shown in Fig. 2. The earliest responses were at 0.6 ms, and most axons had latencies of 0.7 to 1.0 ms. The longest latency response was at 1.7 ms. The peak of the distribution (mode value) varied only slightly between monkeys (CS22, CS23: 0.8 ms, CS15: 0.9 ms). We cannot give accurate values for conduction velocity, since the distances were not known precisely and were short. However, note that in each monkey a range of latencies spanning at least a factor of two was involved. With an approximate distance of 40 mm between the PT and the site of recording, nearly all of the axons would have had conduction velocities in the range 80 –25 m/s.
Database
Responses were obtained from 112 corticospinal axons, 110 of which were tested for a response to stimulation of the M1 hand area, and 100 of them to stimulation of the F5 hand area (default sites for both; see Fig. 1). In two monkeys (CS22, CS23), 82 axons were also tested from a second M1 hand area site (including two not tested from the default site), and in one monkey (CS22), 37 were tested from a second F5 site, one of which was not tested from the default site. F5-M1 conditioning was tested in a total of 51 corticospinal axons. A summary of the recordings in each monkey is given in Table 1. The intensity of cortical stimulation used was up to 400 A; this was chosen because, in all three monkeys, stimuli of this
intensity evoked consistent corticospinal volleys in nonaver-aged recordings from the DLF in midcervical segments (cf., Maier et al. 2002). Spontaneous activity in the axons was rare.
Responses of Corticospinal Axons to M1 Stimulation
Responses were seen in 62/112 axons to single-pulse stimuli of 400A delivered to one or other (most commonly both) of the M1 sites. As in the example of Fig. 3, responses consisted of a stereotyped pattern of spikes, which appeared as periodic
Fig. 2. Identification of single corticospinal axons from pyramidal tract (PT) stimulation. Latency data from all three animals (112 axons; 19, 68, and 25 from CS23, CS22, and CS15, respectively). Inset: five superimposed sweeps of a single-spike response to PT stimulation at 400A for axon CS22a39. PT stimulus onset was at downward inflexion. Latency was measured at the peak of the spike.
Table 1. Numbers of corticospinal axons tested
Monkey PT Identification Default M1 Tested Default F5 Tested 2nd M1 Tested 2nd F5 Tested F5-M1 Interaction
CS15 25 25 25 0 0 18 CS22 68 66 59 66 37 26 CS23 19 19 16 16 0 7 Totals 112 110 100 82 37 51 I I I I I I I
A
B
C
D
Fig. 3. Typical spike and volley responses to M1 stimulation. A: five super-imposed sweeps of intra-axonal spike recordings from axon CS22a28. M1 stimulation (400A) at time 0 is shown. Note little or no variation in latency for the D-response at 1.5 ms, and more jitter for the later I2- and I3-responses. Calibration bar: 2 mV. B: five corresponding sweeps of surface volleys; stimulation artifact at time 0. Calibration bar: 10V (also in D). C: poststimu-lus time histogram (PSTH) for this same axon, based on 39 sweeps at 400A. D, I2, and I3peaks are at 1.5, 3.9, and 5.4 ms, respectively. Bin size: 0.1 ms. Note again: little jitter for the D-response (0.4 ms at the base), and more for the I-responses (0.8 ms at the base). The identity of the peaks as D, I2, I3, etc. in this figure and all succeeding ones was estimated from a procedure which took account of both the latency of the different peaks in the PSTH and the relative conduction velocity of the axon from which spikes were recorded (see text and Fig. 5). D: average of volleys from corresponding sweeps, with clearly visible D, I1, I2, and I3peaks.
at SCDU Mediterranee on July 1, 2013
http://jn.physiology.org/
peaks in the PSTHs. The number of peaks varied between one and six, most often three. The intervals between the peaks in the PSTHs was about 1.3 ms, very similar to the periodicity of the repetitive waves visible in the volleys recorded simultane-ously from the DLF, as described previsimultane-ously (Maier et al. 2002; Shimazu et al. 2004). Figure 3D is typical with regard to the volleys, consisting in this instance of an early D-wave, followed by a series of I-waves, here I1-, I2-, and I3-waves.
In the example of Fig. 3, the timing of the peaks in the axon’s histogram corresponded closely to the waves in the volleys, so one can easily identify the peaks as D- and I-re-sponses. However, one discrepancy is apparent, in that this axon showed hardly any I1-response under these conditions. In
fact, the axon did fire at I1latencies on a few sweeps, when the
D-response was not present, which was also seen consistently when the stimulus was below threshold for the D-response (cf., Fig. 7).
Figure 4 shows four further examples from CS22. The first two histograms came from the same axon, stimulated at the
two M1 sites. Apart from the absence of the earliest peak (presumed D-responses) in the second histogram, the responses were very similar from the two stimulation sites, and, like those in Fig. 3, are easy to identify as I1, I2, and I3peaks. The axons
in the remaining two examples also gave periodic responses, but the absolute latencies of the peaks were different. Such variation between the different axons was typical, meaning that in general an individual peak was often not readily associated with a particular wave in the corresponding volley. This is not surprising, because of conduction velocity variation (by at least a factor of two in the current sample). To characterize the observed peaks, we therefore used the procedure described below.
Temporal Dispersion in Axonal Responses: Identification of PSTH Peaks
Predicting the effect of conduction velocity on these re-sponses would be easy if 1) the conduction velocities and 2) the distances from the cortex to the PT electrode were both accurately known. Neither of these was the case. However, the latencies following PT stimulation were known, so the con-duction times from the cortex should be a constant multiple of this time for each monkey (with due allowance for utilization time and the assumption that the conduction velocity is similar over different segments of the same axon). The calculation of the expected latency of any particular histogram peak, evoked by a 400-A stimulus, either a D- or an I-response for a given axon, was then predicted from the PT latency, via the fit of a simple model.
The model assumed that 1) there was a utilization time of 0.1 ms for PT stimulation and for direct stimulation of the axon in the cortex; 2) the activation of an I1-response in the cortex
occurred 1.3 ms after the stimulus; 3) each subsequent indirect activation occurred at multiples of 1.3 ms later. If the conduc-tion time from PT stimulaconduc-tion was t (0.1 ms less than the PT latency), then a D-response would be expected at a latency given by (kt⫹ 0.1) ms and an I1-response by (kt⫹ 1.3) ms, an
I2-response by (kt⫹ 2.6) ms, etc. The determination of k is best
explained graphically, with relation to the measured latencies of all the histogram peaks from M1 stimulation (both sites, 400 A) in CS22 (Fig. 5A).
Figure 5A is arranged as a raster of histogram peaks, each row (except the leftmost symbol) indicating the latencies of peaks in a single histogram. Only axons giving responses (n⫽ 32) are represented, most of these (25) by two rows, one from each of the M1 stimulation sites, as indicated by the blue and yellow symbols at the left of each row. The 32 axons were ordered according to their PT latency, which is the latency indicated by those leftmost symbols (diamonds). Thus the fastest axons appear in the lowest rows of the raster. The lines represent the model predictions, according to a particular value of k. For the faster axons, and for the relatively early responses, the points show obvious groupings.
To evaluate k we only need to choose one particular PT latency, to compare with one set of I-wave latencies. It seemed clear that, for the earliest PT latencies (0.6 ms, representing a conduction time of 0.5 ms), the corresponding five data points for histogram latencies between 2 and 3 ms represented I1
-responses. Their mean latency (2.4 ms) was therefore taken as representative, to give the value of k for this monkey as (2.4⫺
I I I I I I I I I I I
A
B
C
D
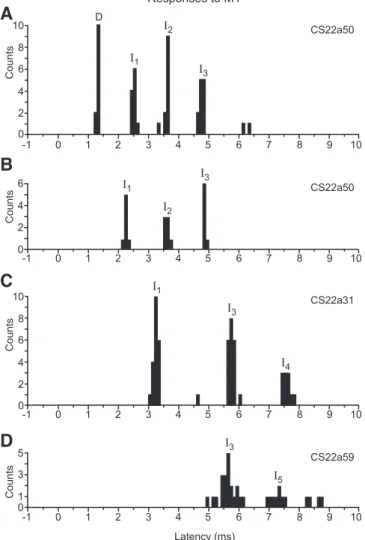
Fig. 4. Examples of PSTHs of responses in single axons to M1 stimulation. A: response of CS22a50 to 2nd M1 stimulation site (12 sweeps). Responses were classified as D, I1, I2, and I3. B: response of same axon (CS22a50) to default M1 stimulation site (7 sweeps). Responses were classified as I1, I2, and I3; no D-response was present. C: response of CS22a31 to default M1 stimulation site (21 sweeps). Responses were classified as I1, I3, and I4. D: response of CS22a59 to default M1 stimulation site (23 sweeps). Responses were classified as I3and I5. All responses were evoked with single 400-A stimuli. See text for peak identification procedure.
at SCDU Mediterranee on July 1, 2013
http://jn.physiology.org/
1.3)/0.5⫽ 2.2. Similar calculations for the other two monkeys gave the same value for k (2.2), so this value was adopted and used to predict all of the other lines for the D- and I-response latencies, as illustrated in Fig. 5A.
By eye the lines seem to be mostly a good fit to the points. This is illustrated more objectively in Fig. 5B, which summa-rizes the timing of all the axon responses from the three monkeys to a 400-A stimulus. This shows that the model
I I I I I I I I I I I I I I I I I I I I I
A
B
C
D
E
Fig. 5. Absolute and relative latencies of axon and surface volley responses to M1 stimulation. A: raster histogram of single-axon PSTH latencies to M1 stimulation at 400A for monkey CS22. Each symbol in a given row (except the
leftmost) indicates the absolute latency of a PSTH response
peak to M1 stimulation for a single axon (solid fill, default site; yellow fill, 2nd site). The leftmost symbol (diamond) indicates its latency to PT stimulation. Responses to an M1 default stimulation site are indicated in a row headed by a blue PT response and those for the same axon to the 2nd M1 stimulation site by the yellow PT response immediately above. Red PT responses indicate axons that were only tested for the 2nd M1 site. The 32 axons are ordered according to their PT latency: fastest axons appear in the lowest rows, slowest in the top rows of the raster. The colored lines represent the model predictions for D and I1to I6latencies, i.e., according to a particular value of k (see text). Peaks in the PSTH of each axon have been classified as D, I1, etc., according to these predictions and indicated by the color code shown at right. The five lowest points assigned as I1responses (circles) are those that were used to fit the model. B: histo-gram of the M1 PSTH response latencies relative to their predicted D-response latency for all three monkeys. Re-sponses to default and 2nd M1 stimulation sites are combined. Bin size: 0.2 ms. The responses at around 0 ms represent D-responses; those separated by multiples of about 1.3 ms represent clear clusters of I1, I2, I3, and I4responses. Bound-aries used to assign different PSTH subpeaks are indicated by tick marks on the horizontal bar. C: histogram of absolute M1 PSTH response latencies. Responses to default and 2nd M1 stimulation sites are combined. Note considerable overlap and weak clustering of the latencies compared with the relative latencies in B. Bin size: 0.2 ms. D: absolute latencies of PSTH responses plotted against their PT latencies, for all three monkeys. Responses to default and 2nd M1 stimulation sites are combined. Color code indicates response classification. Some of the points plotted involve overlap of two or more results, as follows: D, 16 responses (4 overlaps, 12 visible); I1, 61 responses (23 overlaps, 38 visible); I2, 49 responses (18 overlaps, 31 visible); I3, 69 responses (36 overlaps, 33 visi-ble); I4, 41 responses (9 overlaps, 32 visible); I5, 11 responses (3 overlaps, 8 visible); and I6, 7 responses (no overlaps).
E: histogram of latencies of waves in the volleys evoked from
M1 for all three monkeys. Note very clear clustering of D-, I1-, I2-, I3-, and I4-waves. Bin size: 0.1 ms.
at SCDU Mediterranee on July 1, 2013
http://jn.physiology.org/
successfully predicted grouped latencies of peaks, separated by 1.3 ms, for both D- and the I-responses, at least up to I3. We
therefore assigned all of the observed histogram peaks into categories D, I1, I2, . . . etc., according the predicted latency in
the model that was the closest to the observed latency. The data points in Fig. 5A are colored according to these assignments. It is clear that, for a few values near to the borderlines between the categories in Fig. 5B, the assignments were rather arbitrary, and they may appear even more arbitrary for the later responses (I4–I6), where the grouping is less clear, and more data might
indicate that intervals other than 1.3 ms were more appropriate between these later peaks. Nevertheless, we have retained the description for consistency. It does not imply that any particular intracortical circuit was responsible for a partic-ular type of response, but is merely an objective description of the latency of any particular response, taking into account the conduction velocity of the axon. Note that, although the grouping of latencies in Fig. 5A is not very clear for I5and
I6 categories, the peaks in the individual histograms were
often almost as narrow as those in the I1–I4categories (see
Fig. 11B for an example). Finally, in this section, the peaks shown previously in Fig. 4C, now identified as representing I1, I3, and I4 excitation in a relatively slowly conducting
axon (PT latency 1.2 ms), should be compared with those in Fig. 4D, now identified as a late I3and an early I5, in a faster
conducting axon (PT latency 0.7 ms).
It is of interest to see how the assignments of the peaks appear in a combined plot of observed latencies. This is illustrated in Fig. 5D, where all of the PT latencies are plotted against all the latencies of histogram peaks, color-coded for the D- or I-response categories (essentially a condensed version of Fig. 5A, but including data from all three monkeys). The main point of interest is how the absolute latencies of the different categories exhibit considerable overlap, which results in a continuous, rather than a grouped, distribution for the uncor-rected latencies overall (Fig. 5C). This is markedly different from the corrected distribution shown in Fig. 5B.
For comparison of the axon responses with those in surface-recorded volleys, Fig. 5E shows the latency histogram of 771 volleys evoked by M1 stimulation, measured to the negative peak of each wave in the averaged volley for each of 104, 556, and 111 recordings (both stimulation sites) in the three mon-keys (CS15, CS22, and CS23, respectively). Despite the rather continuous nature of the uncorrected axon data, the peak latencies of these surface-recorded waves were distributed into clearly separate groups.
D-responses Evoked from M1
The analysis described above indicated the presence of D-responses for 14 axons. One was in CS15, where only one M1 site was tested. Of the others, four gave D-responses from stimulation of the default site, seven from the second site, and two from both. These 14 axons will be described as D-respond-ers. All but one of these had relatively short latencies to PT stimulation (Fig. 5D, pink triangles) and therefore would have had relatively fast-conducting axons (the fastest around 80 m/s, the slowest about 40 m/s). D-responders were equally distrib-uted across this conduction velocity range.
Published estimates suggest that 400 A may excite large axons, such as those involved here, over a radius of up to 2 mm
(Ranck 1975; Tehovnik et al. 2006). We may therefore assume that the somata of the D-responding corticospinal neurons are likely to have been situated within that radius and therefore within M1 (see diagrammatic representation in Fig. 12). In fact, the data from CS22 and CS23, which both had their two M1 stimulation sites about 2.5 mm apart, support that view. If two circles of radius 2 mm are drawn with centers 2.5 mm apart, the ratio of the area of overlap to the total area encom-passed by the two circles is 1/6.7 (see Fig. 12). In these two animals, 13 D-responding axons were tested from both sites, and the ratio of those responding to both was 2/13, remarkably close to the area ratio, thus confirming the relatively focal direct action of the stimuli used.
The D-responders to M1 stimulation provide a critical test concerning how F5-evoked responses are conveyed to the spinal cord (see Introduction and Interactions Between
Re-sponses to M1 and to F5 Stimulation below). In theory, the
other axons (non-D-responders) could arise from any area of the cortex that supplied corticospinal fibers (see Dum and Strick 1991). In practice, the relatively fast conduction veloc-ities of all the axons here make them still likely to originate in M1 (seeDISCUSSION), but they cannot be considered to have the
level of proof that is present for the D-responders.
Figure 6, A and B, illustrates the characteristic features of D-responding axons. D-responders showed stronger I-responses than non-D-responders. First, the proportion of axons giving any I-response was significantly higher for the D-responders (100%) than for the non-D-responders: 13/13 vs. 44/98 (45%) from the default site, 12/12 vs. 22/70 (31%) from the 2nd site (2, P ⬍ 0.001 for both). Second, within those axons giving I-responses, the D-responders showed more peaks per histogram than the non-D-responders, the propor-tion of axons giving three or more peaks being 11/13 vs. 20/44 for the default site and 9/12 vs. 12/22 for the 2nd site (significant for the default site,2, P⬍ 0.05, but not for the 2nd site). Third, the number of spikes per stimulus was significantly higher for the D-responders than for the non-D-responders (average ⫾ SD: 3.16 ⫾ 1.34 vs. 1.24 ⫾ 0.87 for the default site and 3.48⫾ 1.03 vs. 1.80 ⫾ 0.98 for the 2nd site, t-test P ⬍ 0.001 for both).
Responses of Axons to Different M1 Sites
For any one axon, the pattern of I-responses evoked from the two M1 sites was usually similar, as is illustrated in Fig. 6C. Of the 80 axons tested from two sites, only 7 gave an I-response from one site and not from the other, 29 gave responses from both, and the remaining 44 gave none. Figure 6C characterizes which categories of peaks were seen, with the axons being grouped as those responding with either or both an I1and an I2
peak (I1–2), either or both an I3and an I4peak (I3– 4), or any
peak I5 to I7 (I5–7). The figure then shows whether an axon
shows particular combinations of those groups (e.g., I1–2alone
or I1–2plus I3– 4, etc.) and compares these combinations evoked
from one site with the combinations evoked from the other. It can be seen that more than one-half of the axons (18) gave points on the diagonal, most of these (16) in the one identical combination of I1–2 plus I3– 4. This included 9/11 of the
D-responders. Note also that there were rather few responses in the late category I5–7, as is also clear from Fig. 5B.
at SCDU Mediterranee on July 1, 2013
http://jn.physiology.org/
Responses of Axons to M1 Stimulation at Different Intensities
In a small number of cases, we were able to test the effect of a range of different stimulus intensities on the axon’s response. One such case from CS22 is shown in Fig. 7. At the strongest intensity used (400A), this axon showed clear D-responses at 1.5 ms, followed by peaks at 2.2 ms, 3.6 ms, and 5.0 ms. These were assigned as I1-, I2-, and I3-responses (note that the
I2-wave in the surface volley was indistinct). The main effect
of reducing the intensity to 350A was that the D-responses almost disappeared (only one in response to 15 stimuli), while
the I-responses were unchanged. At 150 A, the I1- and
I2-responses were still present, but the I3-response had
van-ished; only an I1 volley was now clearly discernible in the
surface recording. Further reduction to 75A resulted in the loss of the I2-responses, but the I1-response was still present,
and this was still true even at only 30 A; at these low intensities no further volleys were visible in the surface record-ings. Similarly, in each of another three axons tested (which all showed several I-responses at high intensity), the I1-response
was the only one remaining at threshold.
Responsiveness of Axons to M1 Stimulation: Interanimal Variation
The proportion of axons giving I-responses from stimulation at the default M1 site was 21/25 (84%) in CS15, significantly more than the proportion in either CS22 (28/66, 42%) or in CS23 (8/19, 42%) (2, P⬍ 0.001 and P ⬍ 0.01, respectively).
Among those that showed I-responses, the numbers are small for statistical comparison, but nevertheless there were sugges-tions of interanimal differences, perhaps in the opposite direc-tion. In CS15, which had the highest proportion of responding axons, 0/21 showed more than three I-response histogram peaks, whereas 2/8 responding axons in CS23 showed five peaks and 7/28 responding axons in CS22 showed four peaks (only default sites counted).
Responses of Corticospinal Axons to Area F5 Stimulation
Of the 112 axons recorded, 100 were tested with single 400-A stimuli delivered to the F5 default site, and 33 axons showed responses. Thus fewer axons (33%) responded to F5 stimulation compared with M1 stimulation (55%, see Fig. 10A). Four examples are shown in Fig. 8; most responses from F5 consisted of discrete peaks in the PSTHs, and some were multiple (Fig. 8, A and B). For a given axon, the earliest response to F5 generally had a longer latency than that to M1 stimulation, as shown in Fig. 8E.
In general, the peaks of responses to F5 stimulation were rather broader and not so well defined as those from M1, but they were nevertheless clear enough to be assigned using same model as for the M1 responses (Fig. 5A) and according to the
I I I I I I I I I I I I I I I I I I I I I I I I
A
B
C
Fig. 6. Indirect (I-wave) axon responses to M1 (and F5) stimulation.
A: number of classified I peaks in PSTH responses per axon across all three
monkeys using a 400-A stimulus. These were counted separately for the M1 default site and for the 2nd M1 site. Data from default and 2nd F5 site are combined and included (white bars). Left: for non-D-responders; right: for D-responders. The majority of the non-D-responders showed no I-re-sponses to M1 and to F5 stimulation, i.e., had zero I peaks. In contrast, the majority of D-responders showed M1 I-responses: all showed at least two I peaks to M1 stimulation. Similarly, F5 responses were far more frequent in D-responders. B: number of spikes in the PSTH response per sweep and axon (i.e., a measure independent of the I-response classification). Mean (⫾SD) are shown for all axons with PSTH responses of the three monkeys calculated separately for the M1 default site and for the 2nd M1 site. Data from the default and 2nd F5 site were combined. Note the two- to threefold increase in the M1 response strength in D-responders compared with non-D-responders. N: number of axons. C: comparison of the response type (indirect effects only) between the default and the 2nd M1 stimulation. A circle represents one axon: gray for non-D-responders, and black for D-responders. Note that most responses fall on or close to the diagonal, indicating a similarity of the responses to the two M1 sites in a given axon. See text for explanation of response categories. NoR, no response.
at SCDU Mediterranee on July 1, 2013
http://jn.physiology.org/
latencies of the maxima in the peaks. The assignments of the peaks are shown in Fig. 9C, where all the PT latencies are plotted against all latencies of histogram peak responses to F5 stimulation. No D-responses were observed in any axon to F5 stimulation (Fig. 10A). The color-coded I-responses show that I1-responses were rare (3/33); the example in Fig. 8A was in a
relatively slowly conducting axon (PT latency 1.5 ms). Some axons, such as in Fig. 8, C and D, showed only later peaks. As
with M1, the absolute latencies of the F5 responses (Fig. 9B) were not clearly grouped, and the distribution of corrected latencies was less well-grouped than for M1 (compare Fig. 9A with Fig. 5B). I I I I I I
A
B
C
D
E
Fig. 8. Examples of PSTHs of single-axon responses to F5 stimulation.
A: response of CS15c20 to F5 stimulation (400A, 53 sweeps). Response was
classified as I1and I3. B: response of CS15c14 to F5 stimulation (250A, 123 sweeps). Response was classified as I2and I3. This axon was one of the fastest conducting, whereas that in A was one of the slowest. C: response of CS22a20 to F5 stimulation (400 A, 76 sweeps). Response was classified as I5.
D: response of CS22a24 to F5 stimulation (400A, 61 sweeps). Response was
classified as I5. All four axons showed I-responses to M1 stimulation, but only the axon shown in D showed a D-response. The average, surface-recorded volleys are shown below each PSTH: note that the volleys evoked by F5 stimulation, compared with those evoked from M1 (e.g., Figs. 3 and 7), were generally small and late. E: latency difference between PSTHs of earliest responses evoked from M1 and from F5 in a given axon, across the three monkeys. For axons with both an M1 and an F5 response, the difference was calculated between the first (earliest) F5 and first M1 PSTH I-response. Note: most F5-responses were later than those from M1 (positive lag). Calibration bar for volleys (A–D): 5V.
Fig. 7. PSTHs of single-axon responses as a function of M1 stimulation strength. A: PSTH of responses from axon CS22a18 (D-responder) and (below) concomitant volley for 400-A M1 stimulation (57 sweeps). PSTH response was classified as D, I1, I2, and I3. Volley shows a D, I1, I3, and a very weak I2 response. B: as in A, but 350-A stimulation (15 sweeps). PSTH response was classified as D, I1, I2, and I3. C: as in A, but 150-A stimulation (36 sweeps). PSTH response was classified as I1and I2. Note absence of D volley. D: as in
A, but 75-A stimulation (7 sweeps). PSTH response was classified as I1. Note absence of volley response. E: as in A, but 30-A stimulation (16 sweeps). PSTH response was classified as I1. Calibration bar for volleys: 20V. Note the very different number of sweeps used to construct the PSTHs for different stimulation intensities.
at SCDU Mediterranee on July 1, 2013
http://jn.physiology.org/
The surface volleys evoked from F5 were always smaller and less clear than those from M1, and a volley corresponding to a D-wave was never observed (see Fig. 8, A–C; cf., Shimazu et al. 2004). The largest I-waves in the volleys were typically around 40% of the volleys evoked by M1 stimulation. The latency distribution of the small surface volleys evoked from F5 was also less sharp than from M1 (compare Fig. 9D with Fig. 5E).
Responsiveness of Axons to F5 Stimulation
The percentage of responsive axons was 60% in CS15 (15/25), 25% in CS22 (15/59), and 19% in CS23 (3/16). In CS22, axons were also tested from a 2nd F5 stimulation site (2.2 mm from the default F5 site), from which 400-A stimuli evoked responses in 10 of the 37 axons tested (27%). Of the 36 axons tested from both F5 sites, only 4 gave an I-response from one site and not from the other, 8 axons gave responses from both sites, and the remaining 24 gave none. The response occurrence was, therefore, strongly correlated between the two F5 sites.
The individual responses showed fewer peaks from F5 stimu-lation than from M1: considering default and 2nd sites together, 20 PSTHs showed only one peak, 17 showed two peaks, and 6 showed three peaks (Fig. 6, A and B). Indeed, the proportion of PSTHs showing three or more peaks from the F5 default site (4/33) was significantly less than from both of the M1 sites (default 21/57, 2nd 21/34,2, P⬍ 0.001 for both). The proportion from the 2nd F5 site was similarly low (2/10) and significantly less than from the 2nd M1 site (2, P⬍ 0.05), but not from the default M1 site. Furthermore, the numbers of spikes per stimulus were also significantly lower, i.e., 0.78⫾ 0.40 (N ⫽ 33) for the default F5 site and 0.86 ⫾ 0.26 (N ⫽ 10) for the 2nd F5 site, compared with 1.68⫾ 1.28 (N ⫽ 57) and 2.40 ⫾ 1.27 (N ⫽ 34) for the M1 default and 2nd site, respectively (t-test, P⬍ 0.001 for both). Interanimal differences were also apparent. Of the three axons in CS23, two gave only an I1peak and one gave I3, I4,
and I5peaks; in CS15, the peaks were assigned mostly (17/21)
to I2-I3, with only 3/15 axons giving later peaks (I4 or I5).
However, only 4/45 peaks in CS22 (default plus 2nd sites) were assigned as I1-I3, and most axons (13/17) showed only
peaks assigned as I4-I7. I I I I I I I I I I I I I I
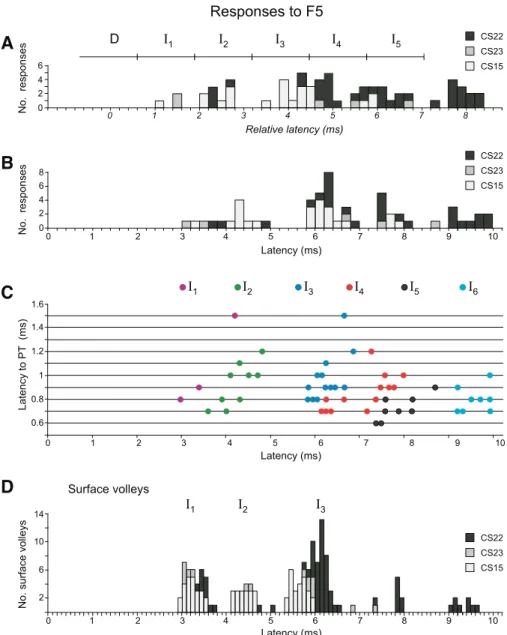
A
B
C
D
Fig. 9. Absolute and relative latencies of axon and surface volley responses to F5 stimulation. A: histo-gram of the F5 PSTH response latencies relative to their predicted D-response latency for all three mon-keys. Responses to default and 2nd F5 stimulation sites are combined (at 400A). Bin size: 0.2 ms. Boundaries used to assign different PSTH peaks are indicated by tick marks on the horizontal bar. B: ab-solute latencies of axons to F5 stimulation. C: abab-solute latencies of axon responses plotted against their PT latencies. Responses to default and 2nd F5 stimulation site are combined. Color code indicates response clas-sification (color code as in Fig. 5A). Some of the points plotted involve overlap of two or more results, as follows: D, 0 responses; I1, 3 responses (no over-lap); I2, 10 responses (1 overlap); I3, 15 responses (2 overlaps); I4, 16 responses (2 overlaps); I5, 9 re-sponses (1 overlap); and I6, 12 responses (4 overlaps).
D: histogram of latencies of waves in the F5 volleys,
for all three monkeys. Responses to default and 2nd F5 stimulation site are combined. Bin size: 0.1 ms.
at SCDU Mediterranee on July 1, 2013
http://jn.physiology.org/
Comparisons Between M1 and F5 Responses for Individual Axons
Of 99 axons that were tested with stimulation at both M1 and F5 default sites, 32 showed a response from both sites, and 46 no response from both sites. Twenty showed a response to M1 but not to F5 stimulation, and only one showed the reverse, i.e., a response to F5 but not to M1 stimulation. There was thus a strong correlation between the responsiveness of the axons to F5 and to M1 stimulation. Most importantly, 8/10 of the D-responders were among those showing I-responses from F5. However, unlike the comparisons between the two M1 sites, there did not seem to be any detailed correlation when responses of individual axons to F5 stimulation were compared with the corresponding M1 responses. Figure 10B shows the F5 responses plotted against the M1 responses (both from default sites) in the same terms as Fig. 6C; axons with D-responses to M1 stimuli are
again shown as filled circles. The patterns of these two plots are strikingly different. Consider the category I1–2⫹ I3– 4for the M1
default site. Note that the responses for the 2nd M1 site were mostly in the same category, whereas those for the F5 site occupied a wide divergence of response categories. Moreover D-responders were evenly spread across all of these, including the no-response category. Within the M1-responding axons, it might appear that more of the D-responders gave an F5 response (8/10) than non-D-responders (24/42), but this difference is not signifi-cant (Fisher exact test, P⫽ 0.13).
Interactions Between Responses to M1 and to F5 Stimulation
A total of 51 axons, of which 47 responded to M1 stimula-tion alone, were tested with a combinastimula-tion of M1 and F5 stimuli (Table 1). The parameters used for conditioning were not standardized, but were chosen in an attempt to optimize, within the recording time available for each axon, the chances of seeing a conditioning effect. This meant that the test M1 stimulus strength was usually chosen to be submaximal, and the timing of the conditioning F5 stimulus set so that F5 response (if present) coincided approximately with the timing of the M1 response(s). The most common timing was with the F5 stimulus 1.6 ms before the M1 stimulus. Sometimes more than one set of parameters was tested, and in a few instances double stimuli (3 ms apart) were used in F5.
Twenty-nine axons were tested that showed a response to an F5 stimulus alone (from at least one of the two sites), and 17 (59%) showed a conditioning effect (for an example, see Fig. 11C). Twenty-two axons where an F5 stimulus alone had not given a response were also tested, and the same proportion, 59% (13 axons), showed an effect (e.g., Fig. 11, A and B).
Most of the effects (23/30) consisted of facilitation alone (e.g., Fig. 11, A–C), i.e., a significant increase in the counts in a peak above the sum of the responses from the responses to M1 alone plus F5 alone. This could occur for a single histo-gram peak or for more than one. The effects in Fig. 11 consist of the following: A, facilitation of I3and I5peaks, but not of I4;
B, facilitation of the late I5peak, but not of the earlier I2and I4
and later I6peaks; and C, facilitation of D, I1and I3peaks. This
was the only example we encountered of facilitation of a D peak, and note that it was obtained with a double shock to F5 with the first shock delivered well in advance (6 ms) of the M1 shock. The apparent facilitation of the I2 peak in C was not
significant.
We found seven axons with evidence of suppression from F5. Three of these consisted of suppression of just one peak in the PSTH; the remaining cases showed a mixed effect, facili-tation of one peak and suppression of another. For example, in Fig. 11D, there was a significant reduction in the I3peak in the
conditioned response (F5⫹ M1), although, because the I2peak
was significantly facilitated, we cannot rule out occlusion as a cause for the suppression.
As is clear from Fig. 11, conditioning from F5 influenced peaks at a variety of latencies, although, as pointed out above, facilitation of early D and I1peaks was relatively rare (one D
peak, three I1 peaks) and required an extended C-T interval
(1.5 to 3 ms). Facilitation of later waves was more common (8 I2peaks, 14 I3peaks, 8 I4peaks, and 6 I5peaks). Facilitation
often involved a decrease in the latency of a peak. This was the case for 10/22 of the M1 responses that were present for a M1
I I I I I I I I I I I I I I I I I I I I I I I I
A
B
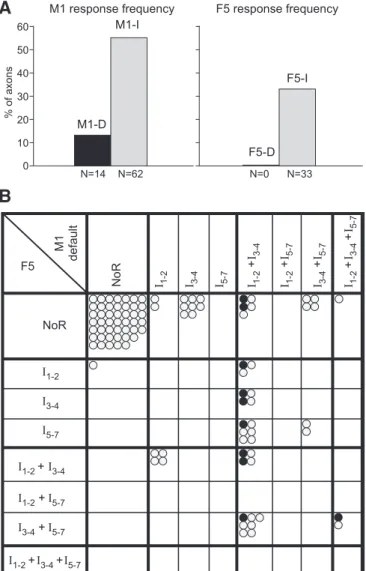
Fig. 10. Comparison between axon responses evoked by stimulation of F5 and of M1. A: comparison of the responsiveness of axons to M1 and F5 stimula-tion. Note presence of D-responses (M1-D) from M1, but absence (F5-D) from F5 stimulation. Note generally lower incidence of F5 (33%) compared with M1 stimulation (55%). N: number of axons. B: comparison of the response type (indirect effects only) to M1 default and F5 stimulation. Format is as in Fig. 6C. A circle represents one axon: gray for non-D-responders and black for D-responders. Note that most responses do not lie on the diagonal, indicating a dissimilarity of the responses to M1 and to F5 stimulation in a given axon.
at SCDU Mediterranee on July 1, 2013
http://jn.physiology.org/
I I I I I I I I I I I I I
A B
C D
Fig. 11. F5-M1 interaction effects in single axons and surface volleys. In each example, for both histograms and volleys, red indicates F5 stimulation alone; green, M1 stimulation alone; blue, conditioned response, i.e., M1 together with simultaneous or earlier F5 stimulation. Stimulus artifacts in volley recordings (and vertical arrows in PSTHs) show stimulus times. A: example showing a clear facilitatory effect on a single axon (CS22a46, non-D-responder). From top to bottom: F5 (400A): no clear response; M1 (200 A): no clear response; F5 and M1 (C-T interval ⫽ ⫺1.7 ms): significantly facilitated I3and I5responses. The conditioning of the I4-response did not reach statistical significance (73 sweeps/condition). Below, concomitant and superposed volley responses; conditioning facilitates the I3volley. B: example showing a clear facilitatory effect on a single axon (CS22a61, non-D-responder). F5 (400A): no clear response; M1 (400 A): clear I2-, I4-, I5-, and I6-responses; F5 and M1 (C-T interval⫽ ⫺1.5 ms): significantly facilitated I5-response. No significant conditioning effect in the I2-, I4-, and I6-responses, except a latency shift for I6(218 sweeps/condition). Below: volley responses; very little conditioning effect on the volley. C: example showing a clear facilitatory effect on a single axon (CS22a16, D-responder). From top to bottom: F5 (2⫻ 250A): clear response, classified as I4and I5; M1 (350A): a few D-responses followed by I2-responses; F5 and M1 (C-T interval⫽ ⫺3.1 ms): significantly facilitated D-, I1-, and I3-responses. No significant increase of the I2-response, but note latency shift (218 sweeps/condition). Below: volley responses. No responses to F5 shock double shock, but conditioned facilitation of I1-, I2-, and I3-waves, but not of the D-wave. D: example showing mixed suppression and facilitatory effect on a single axon (CS15c21, non-D-responder). F5: 400A, no clear response. M1: 300 A, weak I1- and I2-, and clear I3-response. F5 and M1 (C-T interval⫽ ⫺2.9 ms): facilitation of I2-response, but not of I1and a significant suppression of the I3-response (156 sweeps/condition). Below: volley responses. F5 alone gave both an I1and later waves. Conditioning enhanced the later waves evoked from M1. Calibration bar for volleys: 10V (A–C), 5 V (D).
at SCDU Mediterranee on July 1, 2013
http://jn.physiology.org/
stimulus alone and which showed facilitation from F5 (e.g., I5
in Fig. 11B), as well as for a few peaks that were not significantly facilitated (e.g., I6in Fig. 11B and I2in Fig. 11C).
The mean value for the latency shift of facilitated peaks was 0.23 ms (SD⫾ 0.21 ms), which was significantly larger than that of the nonfacilitated peaks (0.06⫾ 0.18 ms; P ⬍ 0.001). For nine axons, conditioning was tested from both of the F5 sites. In six of these, the effects were different from the two sites.
Relationship Between Axon and Volley Responses
The single-axon recordings here give useful insights into what the surface volleys from the DLF represent. The largest D- and I-waves in the volleys here were around 4 –7% of the volleys evoked by PT stimulation at 200 A (cf., Maier et al. 2002, p. 285), a stimulus which probably recruits most of the large PT axons (Maier et al. 1998). Although our axon recordings were biased toward larger axons, they are probably nevertheless representative of those responsible for the PT volley. Thus it is striking that 34% (37/110) of the axons here (penetrated at random) gave an I1peak from the default site and 27% (22/82) from the
second site, all involving one impulse per stimulus. Thus the average size of the I1peak in the volleys, if compared with
the PT volley, would greatly underestimate the descending impulse traffic, by a factor of three to eight times.
The explanation for this may be assumed to be the temporal dispersion and consequent phase cancellation of diphasic unit signals (Amassian et al. 1987), on account of both the jitter within the PSTH peaks and the conduction velocity variation. Note that temporal dispersion originating from conduction velocity variation alone is not sufficient to lead to such a great attenuation. The D-waves of the volleys, which should have been affected to a similar extent by the variation in conduction velocity, were much less attenuated. The D-waves were of similar size to the I1-waves, but the D-response occurrences in
the axons were lower (7/110, 6%, for the default site and 9/82, 11% for the 2nd site), figures much closer to amplitudes predicted from the PT volleys. Appropriately, the D-waves in the volleys were usually of shorter duration than the I-waves (e.g., Figs. 3 and 7). Temporal dispersion may account for the observation that, when the stimulation strength was reduced, the volleys showed a higher threshold than did the individual axons (Fig. 7).
One feature not represented in the volleys was the relatively common appearance of I4-responses in the axons (Fig. 5B).
I4-waves were rarely seen in the volleys. Another feature that
might suggest a discrepancy is the occurrence of I1-waves in
the F5 volleys, whereas there were very few I1-responses from
F5 in the individual axons. However, note that the I1-waves in
the F5 volleys were small compared with the later waves (Fig. 8). Finally, note that, for several of the tests for F5 conditioning of M1 responses, different effects were seen for individual axons compared with the effects in the volleys (Fig. 11).
DISCUSSION
These results give new insights into the corticospinal output evoked by electrical stimulation of the primate motor and premotor cortex. In keeping with previous studies, individual corticospinal neurons excited by a single intracortical shock to
M1 or F5 showed repetitive discharges at relatively fixed latencies: either D- and I-responses or multiple I-responses, in agreement with previous observations based on surface anodal stimulation (Kernell and Wu 1967; Phillips and Porter 1964) or based on transcranial magnetic (TMS) or electrical stimulation (Edgley et al. 1997). An important new result is that, while relatively few neurons responded directly to the tested stimuli, a remarkably high proportion, more than one-half, of the large-diameter axons sampled by our microelectrodes gave indirect, I-responses to single localized stimuli in M1 (Fig. 10A). Indeed, about one-third gave responses at the earliest latency (an I1 peak in their PSTHs). This compares with
approximately all the fast corticospinal axons being directly activated by a large TMS stimulus (Edgley et al. 1997). Although our results are mainly based on a 400-A shock, many axons continued to give indirect responses at much lower intensities (Fig. 7).
No doubt because of size-related bias in the recording, our sample of more slowly conducting axons was small (Fig. 2). Small corticospinal axons are known to far outnumber large, fast conducting axons (Firmin et al. 2011; Russel and DeMyer, 1961); there is a suggestion that those sampled here were somewhat less responsive to M1 stimulation than the fast ones (for the default sites, only 5/14 axons with latencies over 1.0 ms responded, compared with 52/96 for those with latencies of 1.0 ms or shorter; Fig. 5D), but the difference was not signif-icant (2, P⬎ 0.25).
Origin of Corticospinal Axons With Fast Conduction Velocities
Previous studies suggest that corticospinal neurons in nonpri-mary motor areas have smaller, slower axons than those in M1 [Macpherson et al. 1982 (supplementary motor area); Maier et al. 2002 (supplementary motor area); Vigneswaran et al. 2011 (area F5)]. If we assume that axons with the shorter ortho-dromic latencies (0.6 –1.0 ms, Figs. 2 and 5A), with estimated conduction velocities above⬃45 m/s, had their cell bodies in M1, then the above result strongly suggests that a very high proportion of these fast-conducting M1 neurons can be indi-rectly activated by cortical stimuli delivered to the M1 hand area. We suggest that most of the nonresponding axons origi-nated from other regions of M1 outside the hand area, such as the face and leg areas (Fig. 12). The high response rate is a testament to the high degree of connectivity within M1 (Fig. 12; Histed et al. 2009; Huntley and Jones 1991; Slovin et al. 2003; Stoney et al., 1968), but also provides a ready explana-tion to the somewhat surprising result from Maier et al. (2002) that the (indirect) excitatory postsynaptic potentials in forelimb motoneurons resulting from similar intracortical stimulation could often be as large as those in the same motoneurons from direct stimulation at the pyramid, despite much smaller cord dorsum volleys being evoked from the former than from the latter. The present results show that it is the I-waves in the volleys that are significantly underrepresented in the descend-ing impulse barrage. This result is different from that of Kernell and Wu (1967), where the D- and the I-responses in corticospinal axons appeared in numbers roughly proportional to the sizes of the corresponding waves in the surface volley. These authors used surface anodal stimuli very much stronger than used here (⬎10.5 mA), which evoked axonal responses
at SCDU Mediterranee on July 1, 2013
http://jn.physiology.org/
with very little latency variation (much less than in the present study) [compare Fig. 4 from Kernell and Wu (1967) with Fig. 3 here].
A little over 10% of the axons that we recorded were proven to originate in hand-area M1, on account of showing a D-re-sponse. This proportion is entirely within expectation, on the grounds that a 400-A stimulus would be expected to be effective over a distance of no more than 2.0 mm (Ranck 1975; see diagram in Fig. 12). If we assume that the arm and hand area of macaque M1 is around 95 mm2of unfolded cortical tissue (Rathelot and Strick 2006), then, if a circular area of tissue with radius 2.0 mm were directly excited by the 400A stimulus, this area (12.6 mm2) would represent around 13% of the M1 arm and hand area, and this is comparable with proportion of axons yielding a D-response compared with those with an I-response (default M1 site: 7/57; 12%). The D-responders gave stronger I-responses (more peaks in the PSTHs, more spikes per stimulus) than did the other axons responding to M1 stimulation. The simplest explanation for this is one of proximity. Stimuli must have been delivered close to the neuron concerned, and thus would have affected a higher proportion of the axons converging on that neuron (directly or indirectly) than for stimuli at more distant sites, as indicated diagrammatically in Fig. 12 (Butovas and Schwarz
2003; Histed et al. 2009; Nowak and Bullier 1998a, 1998b; Stoney et al. 1968; Tehovnik et al. 2000).
Responses in D-responding Axons
The importance of recording the D-responding axons is that their responses to F5 stimulation provides further direct evi-dence that corticospinal responses from electrical stimulation in F5 can be transmitted via M1 (Kraskov et al. 2011; Schmid-lin et al. 2008). By the logic above, the responses of a high proportion of the non-D-responding axons are also entirely consistent with this view. However, it should be noted that, since most of the responses from F5 were at longer latencies, we cannot rule out the involvement of circuits with a range of complexity, including the generation of indirect responses within F5, interneuronal relays within M1 (Kraskov et al. 2011), or even relays via neurons in regions beyond both F5 or M1. Thirty-three percent of the neurons tested fitted a “F5-to-M1 relay” function, but the proportion of corticospinal neurons influenced by F5 was actually 46%, if those in which F5 stimulation produced conditioning effects on M1 are also included.
This evidence is consistent with our laboratory’s earlier work showing facilitatory effects of F5 conditioning on corti-cospinal volleys or motoneuronal excitatory postsynaptic
po-non-responder D-responder non-D-responder C5 LCST layer V A BB C D M1 boundary D M1
a site of axonal activation CSTNs E default 2.5 mm 2nd cortical surface 2 mm D-responder non-D-responder D I1 generation a a a a
D site of D-responsegeneration generation, mostly late I-responses by local interneurons
Fig. 12. Schematic diagram showing possible mechanisms underlying electrical excitation of D- and I-responses in corticospinal neurons. A highly diagrammatic representation of the possible mechanisms involved in the generation of responses in corticospinal tract neurons (CSTNs) by single-pulse intracortical stimuli delivered to M1 cortex is shown. Stimuli are delivered either through a default electrode, or through a 2nd electrode, 2.5 mm away. The tips of both electrodes are shown to lie within layer V. A 400-A stimulus exerts its actions through activation of axons, not cell bodies: it excites directly large axons lying within 2 mm of the electrode tip (solid red circle for default site, dashed circle for 2nd site). Axons of CSTNs A and B (red) are excited directly from the default site, with a D-response being activated at the initial segment of their axons, marked “D”. CSTN B is also within range for direct excitation from the 2nd site, while A responds directly only to the default site. The stimulus also excites other intracortical axons (black horizontal lines), which mostly originate from local pyramidal neurons, but may also include cortical inputs from other brain regions. Bundles of these axons are shown running above and below layer V, and “a” indicates some sites of axonal activation. Impulses in axons that converge and terminate monosynaptically on CSTNs cause I1-responses (single arrowheads) (di Lazzaro and Ziemann 2013). Impulses convergent on local interneuronal circuits generate later, indirect (I) trans-synaptic responses (I2, I3, etc.) in CSTNs. These networks are indicated by double arrowheads. Networks near to the stimulating electrodes are most likely to be activated because more of their inputs are within the stimulated range, but also, within the networks, some of the thinner interneuron axons that are close to the electrodes may also be activated. Together, these provide a strong convergent input to D-responding CSTNS, like A and B, which also give multiple I-responses. Note that activation of any of the axons may involve various combinations of ortho- and antidromic conduction. More remote neurons, such as CSTN C (green), are beyond the range for direct activation, but do yield indirect responses. Axons emanating from this type of CSTN we have termed “non-D-responders” (green). Long-range corticocortical axons also excite some local interneuronal networks outside M1 (far right) to produce I-responses in a CSTNs such as CSTN E (another “non-D-responder”). Some CSTNs, such as CSTN D (black), receive little or no synaptic inputs excited by the stimulus; these are “nonresponders”. LCST, lateral corticospinal tract.
at SCDU Mediterranee on July 1, 2013
http://jn.physiology.org/


![Collins asymmetries in inclusive charged KK and Kπ pairs produced in e[superscript +]e[superscript -] annihilation](data:image/gif;base64,R0lGODlhAQABAIAAAP///wAAACH5BAEAAAAALAAAAAABAAEAAAICRAEAOw==)