E C O L O G Y
Let more big fish sink: Fisheries prevent blue carbon
sequestration—half in unprofitable areas
Gaël Mariani1*, William W. L. Cheung2, Arnaud Lyet3, Enric Sala4, Juan Mayorga4,5, Laure Velez1,
Steven D. Gaines6, Tony Dejean7, Marc Troussellier1, David Mouillot1,8
Contrary to most terrestrial organisms, which release their carbon into the atmosphere after death, carcasses of large marine fish sink and sequester carbon in the deep ocean. Yet, fisheries have extracted a massive amount of
this “blue carbon,” contributing to additional atmospheric CO2 emissions. Here, we used historical catches and
fuel consumption to show that ocean fisheries have released a minimum of 0.73 billion metric tons of CO2 (GtCO2)
in the atmosphere since 1950. Globally, 43.5% of the blue carbon extracted by fisheries in the high seas comes from areas that would be economically unprofitable without subsidies. Limiting blue carbon extraction by
fisheries, particularly on unprofitable areas, would reduce CO2 emissions by burning less fuel and reactivating
a natural carbon pump through the rebuilding of fish stocks and the increase of carcasses deadfall. INTRODUCTION
The continuous increase in CO2 emissions from fossil fuel burning
and other human activities is rising atmospheric CO2 concentration
[270 parts per million (ppm) before the preindustrial period versus 410 ppm now] and altering global climate with deleterious con-sequences on ecosystems, human health, and the economies (1, 2). In response, the Paris Agreement, adopted in 2015 at the 21st Con-ference of Parties under the United Nations’ Framework Conven-tion on Climate Change, has the objective to limit global warming below 2°C relative to preindustrial levels by keeping atmospheric
CO2 concentration below 490 ppm by 2100 (3). Meeting this target
will require multiple and urgent efforts to reduce CO2 emissions,
promote carbon sequestration, and develop negative-emission technologies.
In 2019, 66% of the signatories to the Paris Agreement have committed to include nature-based solutions (NBSs) in their climate change programs (4). These NBSs to climate change are the set of actions that protect or restore ecosystems to counter or mitigate
negative effects of global changes, including the reduction in CO2
atmospheric concentrations (4, 5). To date, most of these NBSs to climate change focus on carbon sequestration by primary producers in terrestrial or coastal ecosystems; these include, for instance, restoring forests or protecting mangroves (5, 6). The opportunities of NBSs to climate change in the ocean, with the exception of coastal ecosystems, have rarely been explored despite the fact that the ocean is a major carbon sink that sequester 2.5 billion metric tons of carbon
(GtC) per year, or 22% of the global anthropogenic CO2 emission
(1). In particular, the potential role of marine vertebrates, repre-senting an oceanic blue carbon stock of 0.7 Gt (7), has received little attention, even though these large animals can store carbon through different ways. For example, fish modify nutrient limitation and
promote the sequestration of carbon in coastal vegetated habitats, while coastal predators protect this blue carbon stock by limiting grazing (8, 9). The role of fish as direct carbon sink via carcasses dead-fall has only been speculated previously (10). In contrast, contribu-tions of whales to carbon sequestration have been quantified (11).
Yet, marine fisheries have depleted most fish stocks relative to preindustrial levels (12), thereby removing massive amounts of blue carbon from the ocean when fisheries catches were landed,
pro-cessed, and consumed, therefore emitting atmospheric CO2 (13).
Furthermore, government subsidies have enabled fishing fleets to travel vast distances and burn large amounts of fossil fuel to reach remote fishing grounds in the high seas. In addition, these subsidies sustain fishing activities even when fish stocks and catch rates are low because of overexploitation (14). Currently, it has been estimated that more than half of the high-seas fishing grounds would be eco-nomically unprofitable for fishing fleets to operate in the absence of subsidies (14). Therefore, overexploiting fish stocks has likely re-duced or even annihilated the contribution of marine vertebrates to blue carbon sequestration over vast ocean areas since decades.
Here, we focus on a previously underrecognized pathway of car-bon sequestration by fish: their capacity to sequester carcar-bon in the deep sea after their natural death. More precisely, we estimate how catching large fish from the ocean may have affected this carbon sequestration potential through the sinking of dead fish carcasses. On the basis of previous studies showing the deadfall of large pelag-ic fish into the deep sea (15, 16), we assume that, in the open ocean, carcasses of deceased fish sink to the bottom rather than being eaten in surface waters. We use global fisheries catches data since 1950 to estimate the spatial and temporal dynamics of the blue carbon ex-tracted from the ocean and released into the atmosphere as a result of fishing, instead of being sequestered in the deep sea. We also estimate the extent to which fishing remote unprofitable areas in the high seas, with the support of subsidies, expands the blue carbon
extirpation and contributes to CO2 emissions into the atmosphere.
To adopt a conservative strategy in our estimations, we only consider dense and large-bodied (>30 cm in total length) fusiform fish spe-cies, including most tunas, mackerels, sharks, and billfishes, since their carcasses are most likely to sink rapidly.
We use the Sea Around Us (SAU) database to assemble spatially explicit global fisheries catches since 1950 for 24 tuna, 20 mackerel, 1MARBEC, Univ Montpellier, CNRS, IFREMER, IRD, Montpellier, France. 2Changing
Ocean Research Unit, Institute for the Oceans and Fisheries, The University of British Columbia, Vancouver, BC, Canada. 3World Wildlife Fund, Washington, DC 20037, USA. 4National Geographic Society, Washington, DC 20036, USA. 5University of California, Santa Barbara, Santa Barbara, CA 93106, USA. 6Bren School of Environmental Science and Management, University of California, Santa Barbara, CA 93106, USA. 7SPYGEN, 17 rue du Lac Saint-André, Savoie Technolac, Le Bourget du Lac, France. 8Institut Universitaire de France, Paris, France.
*Corresponding author. Email: gael-mariani@hotmail.com
Copyright © 2020 The Authors, some rights reserved; exclusive licensee American Association for the Advancement of Science. No claim to original U.S. Government Works. Distributed under a Creative Commons Attribution NonCommercial License 4.0 (CC BY-NC). on November 6, 2020 http://advances.sciencemag.org/ Downloaded from
15 billfish, and 85 shark species (table S1), hereafter referred to as “large fish.” We assume that each individual fish contains, on average, 12.5% (±2.5%) of carbon relative to its whole-body wet weight (7, 17). We exclude areas shallower than 200 m and coastal upwelling regions, because these latter ecosystems can act both as a sink (upwelled nutrients stimulate phytoplankton productivity) and a source (up-welled waters are rich in dissolved inorganic carbon) of carbon (18). For each metric ton of carbon (tC) extirpated from the ocean by fisheries, we consider that 94% is emitted into the atmosphere as most of the body parts are either consumed or processed so the carbon is subsequently released through respiration, excretion, and waste treatment (13). The remaining 6% correspond to the carbon contained in fish bones, which is not reemitted into the atmosphere but rather sequestered in landfill (fig. S1) (19, 20). We estimate the average proportion of the extracted fish biomass that would have other-wise died from senescence and disease and sunk in the deep ocean if it had not been fished or predated (see the Methods and Supple-mentary Materials). Depending on the taxonomic group (i.e., tuna, mackerel, sharks, and billfish), we estimate that fishing prevents the sequestration of 28.8 to 94.6% of the extracted carbon (figs. S1 and S2). RESULTS AND DISCUSSION
Blue carbon extraction since 1950
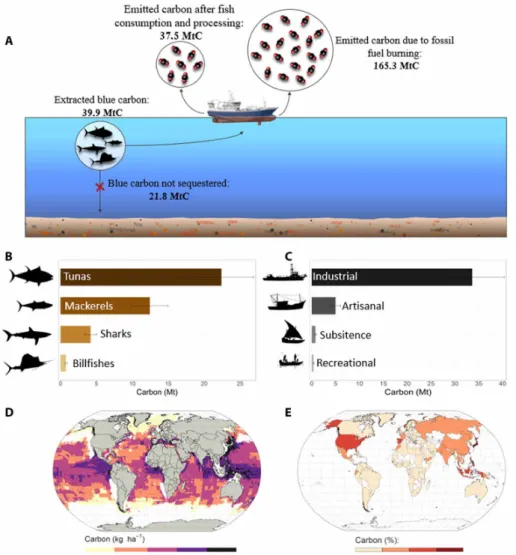
Between 1950 and 2014, the world’s fishing fleets have extracted 318.4 million metric tons (Mt) of large fish from the ocean, equiva-lent to 37.5 ± 7.4 Mt of carbon (MtC) released into the atmosphere. This means that fishing has prevented the sequestration of 21.8 ± 4.4 MtC through the sinking of fish bodies into the deep sea, after accounting for the consumption of biomass from predation (Fig. 1A). Most of this blue carbon extirpation (87.4%) is due to the fishing of Scombridae species (56.2% for tunas and 31.2% for mackerels), while shark and billfish catches represent 10.5 and 1.9% of the total, re-spectively (Fig. 1B). Industrial fisheries have extracted 84.8% of the total (33.6 ± 6.7 MtC), while artisanal, subsistence, and recreational fisher-ies have extracted 12.3% (4.9 ± 0.9 MtC), 1.97% (0.8 ± 0.1 MtC), and 0.9% (0.37 ± 0.07 MtC), respectively (Fig. 1C).
The spatial distribution of fished blue carbon since 1950 reveals a marked heterogeneity with a maximum of 533 kgC per hectare extracted in the Western Pacific Ocean, while 26.5% of the ocean surface shows no blue carbon extraction. The Pacific Ocean, where most tuna fisheries concentrate, accounts for 71.1% of the total blue carbon extirpated, and 49.1% takes place in the equatorial strip (i.e., between 10°S and 10°N latitude; Fig. 1D). The national fishing fleets with the largest overall blue carbon extraction are based in Japan, Indonesia, and Taiwan, with 22.2, 6, and 5.1% of the total, respectively (Fig. 1E). Combined with fishing fleets from the Philippines, Spain, USA, Ecuador, China, South Korea, and Thailand, these 10 countries account for 62% of total blue carbon extirpated since 1950.
Like any other food production sector, fishing also emits CO2 by
consuming and burning fuel. In the fishing sector, fuel consumption represents the majority of its carbon footprint (21). Using an emission
intensity factor of 1.9 metric tons of CO2 emitted per metric ton of
fish landed (21), we estimate that 165.3 MtC were emitted between 1950 and 2014 due to the fuel consumption needed to extract blue carbon from the ocean. If we sum up large fish carbon exported (37.5 MtC) on land and the emissions due to fuel consumption (165.3 MtC; Fig. 1A), then we obtain a total of 0.2 GtC emitted in
the atmosphere since 1950 by fisheries, equivalent to 0.73 GtCO2.
Spatiotemporal dynamics of blue carbon extraction
Total blue carbon extraction from the ocean has increased steadily since 1950 (Fig. 2A). In 2014, fisheries extracted 1.09 MtC (±0.2 MtC) of large fish, while only 0.13 MtC were removed from the ocean in 1950 (±0.02 MtC), equivalent to an increase of almost one order of magnitude in 65 years. Among areas where blue carbon extraction occurs, 88.3% experienced an increase between 1950 and 2014 (Fig. 2A). Marine regions with the highest increase in blue carbon extraction from fishing are located in the Western Pacific and around the equatorial strip (Fig. 2B). In the early 1950s, blue carbon was mainly extracted in the Western Pacific and the Mediterranean Sea, while only 39% of ocean areas had reported extraction of large fish (Fig. 2C). Despite the high economic cost of fishing in the high seas (14), there has been a progressive expansion of exploited areas, reaching 72% of the ocean surface by the early 2010s (Fig. 2D and fig. S3). Recent hotspots of blue carbon extraction are located near the coasts of East and Southeast Asia (both in Indian and Pacific Oceans), as well as in the western equatorial strip of the Pacific Ocean due to the development of tuna fisheries (Fig. 2D). Considering that this blue carbon, expect bones, exported to land from the ocean through
fisheries catches and landings is emitted as CO2 (3.75 MtCO2),
combined with CO2 emissions due to fuel consumption by the fishing
fleets (16.6 MtCO2), a total of 20.4 MtCO2 were estimated to have
been emitted in 2014. This is equivalent to the annual emissions of 4.5 million cars, so 11.7% of the total number of cars registered in
France or 0.05% of the global CO2 emissions in 2014. This also
rep-resents almost 17% of the decrease in CO2 emission in Europe
be-tween January and April 2020 due to the corona virus disease 2019
forced confinement (~123 MtCO2 less compared to the same period
in 2019) (22).
The profitability of blue carbon extraction
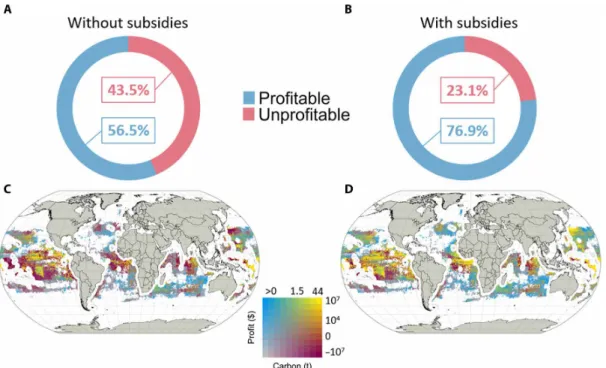
Reducing fisheries subsidies is being pursued as a policy to improve the ecological (23) and socioeconomic (14, 24) status of fisheries in the high seas (25). To evaluate whether subsidies reduction policies also contribute to carbon mitigation, we analyze catches of large- bodied fish from the high seas in 2014 and combine it with data on fisheries subsidies. Specifically, on the basis of published data on the profitability of high-seas fisheries (14), we separate areas that are either estimated to be profitable or unprofitable to fish without sub-sidies. We estimate the proportion of blue carbon extracted from each of these areas relative to the total catches from the high seas. Globally, 43.5% of the extracted blue carbon in the high seas comes from areas that would be unprofitable in the absence of subsidies (Fig. 3A). These unprofitable fishing grounds include some areas with the highest amounts of blue carbon extracted (in red in
Fig. 3, C and D). These unprofitable and highly CO2 emitter areas
are mainly located between 20°S and 10°N latitude and along the Japanese coasts, in Central Pacific, South Atlantic, and North Indian Oceans. However, the proportion of unprofitable areas reduces to 23.1% if government subsidies are included (Fig. 3B). Almost half of the areas that are estimated to emit carbon from fishing activities while being economically unprofitable become profitable with sub-sidies. This profitability shift of the main blue carbon extraction areas mainly occurs in the central Pacific and Atlantic Oceans (from red to yellow in Fig. 3, C and D). Some areas would remain profit-able to fish even without subsidies (blue cells in Fig. 3C) because of lower costs of fishing that are dependent on the characteristics of the fisheries, e.g., ship size, gear type, and engine (14). Our findings
on November 6, 2020
http://advances.sciencemag.org/
thus show that government subsidies, through supporting large-scale exploitation of large-bodied fish that is economically unviable, exacerbate the depletion of a natural carbon sink.
Rebuilding fish stocks as a NBS to climate change?
Limiting or preventing blue carbon extraction at least on the un-profitable areas of the high seas while managing all fisheries to main-tain the long-term viability and productivity of fish stocks would rebuild fish biomass and benefit carbon storage in three ways. First,
reducing overall fishing effort would lower CO2 emissions by
burn-ing less fuel. Second, rebuildburn-ing fish stocks would increase livburn-ing biomass of large-bodied fish and thus promote the short-term carbon sequestration in the living compartment. Third, more abun-dant large-bodied fish would induce higher natural long-term carbon sequestration by increasing carcasses deadfall.
Previous studies evaluating the effectiveness, cobenefits, disbenefits, and governability of ocean solution to address climate change sug-gest that eliminating overfishing and setting up marine-protected
areas can support climate adaptation (26). Our findings further highlight the potential contributions of these interventions to climate mitigation through restoring blue carbon from eliminating over-fishing in the high seas. This is in addition to a wide range of other ecological and socioeconomic benefits of effective fisheries manage-ment and spatial planning in the high seas, such as conserving bio-diversity, reducing modern slavery in fisheries and inequalities between countries (14, 24, 27), improving the viability of small-scales fisheries (28), and, in general, achieving several sustainable develop-ment goals (29–31).
Our analyses provide solid, yet conservative, estimates on how fisheries, mainly industrial, have affected blue carbon sequestration since 1950. However, further studies are needed to provide compre-hensive estimations of blue carbon potential from marine vertebrates and impacts of human activities on this sequestration pathway. Par-ticularly, we have only included fisheries targeting large-bodied fish in areas with a mean depth of more than 200 m and excluded up-welling areas; thus, only 9.5% of the total catches in 2014 are considered Fig. 1. Total blue carbon extraction of large fish since 1950. Fate of blue carbon and associated emissions (A). Blue carbon extracted by taxon (B) and by fishing sector
(C). Error bars represent the lower and upper bounds of carbon content in fish bodies (10 and 15%, respectively). Spatial distribution of the blue carbon extracted since 1950 by fisheries (D). Percentage of countries' contribution to blue carbon extraction since 1950 (E). Countries in white have no reported catches.
on November 6, 2020
http://advances.sciencemag.org/
in our study. To fully assess the effectiveness of measures promot-ing blue carbon sequestration by all marine vertebrates includpromot-ing mammals and small pelagic and mesopelagic species, it would be necessary to estimate the amount of carbon sequestered after natu-ral death by more species. For example, if skipjack tuna (Katsuwonus
pelamis) stocks could recover to their preexploitation level only in
the Western Pacific Ocean (32), then 1.63 MtC would be sequestered annually. This is only 6.8% of the annual amount of carbon se-questered by mangroves (24 MtC per year) (33); but if we include a recovery, even partial, of marine mammals and all other pelagic, Fig. 2. Temporal and spatial changes in blue carbon extraction of large fish by fisheries. Temporal trends in the amount of blue carbon extracted from the oceans
since 1950 by year (A). Annual difference of blue carbon (kilogram per year) extraction between the periods 1950 to 1954 and 2010 to 2014 in 0.5° × 0.5° cells (B). Average annual carbon extraction (per year and hectare) between 1950 and 1954 (C) and 2010 to 2014 (D).
Fig. 3. Impact of government subsidies on blue carbon extraction in the high seas. Percentage of blue carbon extracted in profitable areas and unprofitable areas
without subsidies (A) and with subsidies (B). Spatial variability of carbon extraction and economic viability without subsidies (C) and with subsidies (D).
on November 6, 2020
http://advances.sciencemag.org/
benthopelagic, and mesopelagic fish species, then we may expect far more (34–36). This means that we have likely underestimated not only the true role that marine vertebrates can have on carbon sequestration but also the impact of fisheries on this carbon seques-tration. We suggest that measures to rebuild fish stocks to sustainable
level, e.g., biomass above maximum sustainable yield (MSY; >BMSY)
(37), could induce a much higher amount of carbon sequestered by large marine vertebrates, comparable to other coastal NBSs to cli-mate change such as carbon mitigation potential of coastal wetland restoration (54 to 233 MtC per year) (38). A broader range of NBS, including different scenarios of ocean management, can be explored to understand how blue carbon from marine vertebrates can be re-stored and/or enhanced most effectively.
It is also important to consider the broader trade-offs of fish blue carbon–related NBSs with other society changes that aim to promote sustainable development. For example, limiting catches of large pelagic species on the high seas might lead to substitution of sea-food by other sources of proteins and nutrients with bigger environ-mental and social footprints. Particularly, the carbon footprint of products derived from marine fisheries and destined to human con-sumption is much lower compared to other sources of animal protein (e.g., beef, lamb, and pork) (21). A replacement of fish protein by livestock protein would promote carbon sequestration by unfished
large pelagic species but would simultaneously increase CO2
emis-sions from the agricultural sector. However, given that many fish stocks are currently below their production potential because of overfishing (12), rebuilding overexploited fish stocks can ensure more sustainable seafood production, limiting the shift toward livestock protein while enhancing blue carbon sequestration with more large- bodied fish and sinking carcasses.
Conclusions and perspectives
Our findings provide a foundation to include other physiological and ecological processes influencing the carbon budget of a fish during all its life stages. Fish contributes to the inorganic carbon cycle
through respiration (source of CO2) (39) and the production of
car-bonate (CaCO3), a by-product of osmoregulation process (40, 41).
The sinking of the carbonate crystals could increase carbon
seques-tration, while the chemical reaction also produces some CO2 and
modifies ocean chemistry (40). The large-scale removal of ocean apex predators can shift the structure and functioning of ecosystems (42). In some cases, overfishing predators can induce trophic cascades that induce an increase in abundance of forage fish that are smaller bodied and lower in trophic level, a decrease in zooplankton bio-mass because of increased grazing by forage fish, resulting in an increase in phytoplankton biomass (43). Consequently, catching large fish could decrease carbon sequestration by zooplankton but increase that of phytoplankton. However, these cascading effects are not consistent across the ocean, and the effects of depleting large fish populations do not always spread toward the lowest trophic levels (44). If the loss of apex predators negatively affects the sequestration of carbon in coastal ecosystems (8), there is, to our knowledge, no evidence of this indirect impact in pelagic systems. Moreover, there is growing evidence that these apex predators provide nutrients via processes like excretion and defecation (9). Some species, such as sperm whales, play a key role in the creation of biogeochemical hotspots, promoting phytoplankton inflorescences and increasing the export of carbon in the deep ocean (45). Thus, species like tunas, billfishes, and sharks would certainly boost nutrient provision in some
oligotrophic zones of the high seas, which, by extension, would in-crease carbon sequestration in the deep ocean through marine snow sedimentation.
This study provides a first global and conservative estimate on how fisheries have contributed to reduce the carbon sequestration potential of large fish by removing them from the ocean. Since 1950, fisheries have emitted 0.2 GtC into the atmosphere and prevented the sequestration of 21.8 ± 4.4 MtC through blue carbon extraction. This direct impact of fisheries on blue carbon sequestration is much less than the annual sequestration capacity of ecosystems like man-groves (24 MtC per year) (33) or seagrasses (104 MtC per year) (46). However, we raise the issue of rapidly assessing the effect of mea-sures promoting the recovery of fish stocks, on the reactivation of the natural capacity of large fish to sequester carbon through the sinking of their carcasses or through their potential indirect effect on the sequestration of carbon by other living compartments (i.e., phytoplankton). This would improve estimates to assess whether rebuilding fish stocks can be considered an additional NBS to cli-mate change that has been ignored so far.
MATERIALS AND METHODS
Species and areas selection
We assume that a fish, when it is not fished or eaten by a predator, dies naturally and sinks in the deep ocean at such a rate that it does not have time to be degraded in the water column before it settles on the substrate. Then, the carbon contained in its body will be se-questered in the deep ocean over several decades or even millions of years (47, 48). Conversely, when an individual is fished, the carbon contained in its body is exported on land instead of being seques-tered in the deep ocean. We chose to include in this study large (>30 cm) pelagic fishes (dense and/or fusiform) and large demersal sharks (already close to the substrate), which include pelagic and demersal sharks, Scombridae (tuna and mackerel), and billfishes. Only landings were included because discards are considered as sequestered in the deep ocean, at a rate that would be higher than if they were not fished. Other species (small pelagic, marine mammals, etc.) could have been included, but we adopted a conservative approach in estimating the impacts of fisheries on blue carbon sequestration, since these spe-cies are more likely to die from predation (little pelagic) or float after death (right whales and dolphins). Also, we excluded areas of the ocean with shallow depths (cells with average bathymetry of less than 200-m depth), where stored carbon could be remobilized in the water column. In addition, coastal upwelling systems can be a sink or a source of carbon (18). They act as a carbon sink when upwelled water, rich in nutrients, stimulates phytoplankton productivity, which promotes export of organic carbon. At the same time, upwelled waters are rich in dissolved inorganic carbon (DIC), which can lead to an
outgassing of CO2 (18). However, we ignore which part of the
exported carbon can be sequestered and which part can be remineral-ized as DIC and outgassed. Therefore, we have chosen to remove catches in the four major eastern boundary upwelling systems (i.e., California, Peru-Chile/Humboldt, Canary, and Benguela upwelling systems). This very conservative approach in estimating impacts of fisheries on blue carbon sequestration undoubtedly provides underestimated values.
Catch data since 1950
Catch data from 1950 to 2014 were extracted from the SAU data-base. These data are reconstructed catch data. The SAU uses the
on November 6, 2020
http://advances.sciencemag.org/
United Nations’ Food and Agriculture Organization’s reported catch data as baseline, combined with a catch reconstruction methodology, to provide a better estimate of world catches (49, 50). This method-ology provides catch data from all fishing sectors (industrial, artisanal, subsistence, and recreational) not only by year, flag state (country), and catch type (landings versus discards) but also by functional and commercial group (50). Catch data are spatialized onto a grid of 0.5° × 0.5° latitude and longitude cells.
Catch data from the SAU database are in metric tons of fresh biomass. To estimate the amount of blue carbon extracted because of large fish fisheries, data were converted to metric tons of carbon. We assumed that all fish have the same fraction of carbon in their biomass. On the basis of a study by Czamanski et al. (17), the aver-age percentaver-age of carbon in an individual belonging to the species
Scomber scombrus (Atlantic mackerel, Scombridae) is 12.3 and 11%
for S. japonicus (Spanish mackerel, Scombridae). Another study used a percentage of 15% for mesopelagic fishes (7). To take into account the potential variability in carbon content between species, we took three percentages of carbon: 10% (low estimation), 12.5% (17), and 15% (7). By summing all catches (C) in each cell, we estimated the
amount of carbon extracted (Ecarbon) within each 0.5° latitude × 0.5°
longitude grid cell
E carbon = C × 0.125 (± 0.025)
We estimated the contribution to blue carbon extraction for each taxon (tuna and tuna-like species, mackerel, sharks, and billfishes), fishing sector (industrial, artisanal, recreational, and subsistence), and fishing fleet (country) since 1950.
Estimation of carbon emitted and carbon not sequestered
Carbon reemitted into the atmosphere and the carbon that has not been sequestered in the deep ocean were estimated from the extracted carbon. The former corresponds to the carbon reemitted into the atmosphere after being consumed on land. Carbon contained in fish body is reemitted into the atmosphere, except carbon contained in fish bones, which is mainly buried and sequestered in landfills (19). Bones in tuna and mackerels species (87.4% of the total catch considered in this study) account for 6% of the total body weight (20, 51). Therefore, we removed 6% of the total catches so
that bones are not included in our conservative estimates of CO2
emitted. All the carbon contained in the 94% remaining fish
bio-mass is released into the atmosphere as CO2 through respiration,
excretion, and waste treatment (13). Therefore, we assumed that the amount of carbon reemitted into the atmosphere is equal to 94% of the amount of carbon extracted by fisheries (fig. S1). Conversely, the amount of carbon that is not sequestered in the deep ocean is lower than the amount of carbon extracted by fisheries because only the portion of individuals that died from senescence or disease would have sequestered carbon. The other portion (the ones that would have died of predation if not fished) would not have seques-tered carbon in the deep ocean. Therefore, we accounted for the loss of biomass production potential from the exploitation of standing fish stocks that would have contributed to the export of the blue carbon into the deep ocean. Using the Thompson and Bell’s catch equation (52) and assuming that each population is at equilibrium, i.e., recruitment of young fishes = loss from predation, fishing, and other causes (largely senescence and disease), we estimated the an-nual average proportion of the extracted biomass that would have
died from senescence and disease if it had not been fished between 2005 and 2014. Because of the differences in exploitation status (from under- to overfished) across fish stocks, regions, and time period, we conservatively estimated the rate of carbon production by assuming that the stocks are fished at levels approximately required for MSY. We obtained a mortality rate from senescence and disease for each major taxonomic group (tuna, mackerel, sharks, and billfish) by following the method bellow (fig. S1).
At each time t, the biomass (B) decreases because of mortality such that
dB
─dt = − ZB (1)
where Z = total mortality rate (predation, fishing, senescence…) . The integration of the Eq. 1 gives the biomass that survived
be-tween t0 and t1 (Bt)
B t = B 0 ∙ e − Z t ∙( t 1 − t 0 ) (2)
where B 0 is the initial biomass at t 0 .
To estimate the proportion of the biomass that died from senescence
and disease between t1 and t2, we had to estimate the biomass that died
from fishing (C), defined by the Thompson and Bell’s catch equation
C t 1 , t 2 = ( Z ─ F ) ∙ ( B t 1 − B t 2 ) (3)
where F is the fishing mortality rate and F ─
Z is the proportion of biomass
died from fishing.
Putting Bt2 in the form of Eq. 2 gives the following catch equation
B t 2 = B t 1 ∙ e − Z t ∙( t 2 − t 1 ) and B t 2 = B t 1 − ( Z ─F ∙ C t 1 , t 2 )
C t 1 , t 2 = ( F ─Z ) ∙ B t 1 (1 − e − Z t ∙( t 2 − t 1 ) ) (4)
With the same approach, the fished biomass that would have died from senescence and disease (noted as SB for sinking biomass)
be-tween t1 and t2 is
SB t 1 , t 2 = ( N ─Z ) ∙ B t 1
(
1 − e − Z t ∙( t 2 − t 1 ))
(5)where N is the mortality rate from other mortalities (senescence, dis-ease, and other causes ) .
Using Eqs. 4 and 5, we obtain the fished biomass that would have sunk in the deep ocean if not fished with fishing at MSY, for each species i for which the required data for the calculations are available
C MSY ─ F = B t 1 (1 − e − Z t ∙( t 2 − t 1 ) ) ─ Z and SB ─ N MSYi = B t 1 (1 − e − Z t ∙( t 2 − t 1 ) ) ─ Z
SB MSY,i = C ─MSY,i M i ∙ N where M = F at MSY i (6)
In our study, CMSY corresponds to the average annual blue
car-bon extracted between 2005 and 2014 (from the SAU database). N
on November 6, 2020
http://advances.sciencemag.org/
is the mortality rate from senescence and disease, and M is the nat-ural mortality rate (equal to the fishing mortality rate, F, with fishing at MSY). Several values of N and M at the species level were obtained from outputs of Ecopath with Ecosim models (http://ecobase. ecopath.org/#docs) and FishBase, respectively. As we do not have a value of N and M for each species, we grouped the estimates of SB by major taxonomic group (i.e., tuna, sharks, mackerel, and
billfish). By dividing the biomass that would have sunk (SBMSY)
by the biomass extracted from ocean (CMSY), we lastly obtained
several sequestration factor when fishing at MSY (SMSY,i) for each
species i
S MSY,i = SB ─ C MSY,i
MSY,i (7)
We applied to catches of each species considered in this study
the median value of the SMSY of the major taxonomic group to
which it belongs to obtain the total extracted biomass that would
have sunk in the deep ocean if not fished with fishing at MSY (SBTot;
figs. S1 and S2)
SB Tot =
S
j=1n C j ∙ med( S MSY,ij ) with n = 4 (8)where med(SMSY,ij) is the median value of SMSY of all species i
be-longing to taxonomic group j, and Cj is the total catch of taxonomic
group j from 1950 to 2014.
Two scenarios are possible once the carcass arrives on the sub-strate. The flesh of the carcass can be consumed by deep-sea scaven-gers at rates up to 32 kg per day (15) to be used for its metabolism. In this case, the carbon contained in the carcass is going to be rem-ineralized in the deep sea and sequestered for decades to hundreds of years (47, 48). Otherwise, the carcass (mainly bones) is buried in the sediment, and the carbon is sequestered over several million years (47, 48). To our knowledge, no carcass burial rate exists, so we cannot distinguish between these two scenarios.
We mapped the spatial evolution of areas where carbon was re-moved. We estimated the average annual variation in the amount of carbon extracted in each cell between 1950 and 2014 by comput-ing the variation in amount of blue carbon extracted annually on average between 1950 to 1954 and 2010 to 2014 and dividing this delta by 65 (number of years). We also mapped the average amount of blue carbon extracted by hectare each year in each for all decades since 1950.
Impact of government subsidies on blue carbon extraction
Using data from the study of Sala et al. (14), we assessed the extent to which fishing unprofitable areas, with the support of government subsidies, contribute to the blue carbon extirpation in the high seas. By computing the cost of fishing in the high seas (that takes into account fuel, labor, repair/maintenance transhipment, and fuel re-plenishment costs) and the incomes of high-seas fisheries (based on global catch and their landed value), they estimated the global profits of high-seas fisheries with and without government subsidies. We combined these data with the catch data of large fish from the SAU database in 2014 that occurred only in the high seas. We estimated the amount of blue carbon extracted in profitable and unprofitable areas with and without subsidies by mapping the profitability of fishing each 0.5° × 0.5° cells and coupling these estimates to the amount of blue carbon extracted in each cell.
SUPPLEMENTARY MATERIALS
Supplementary material for this article is available at http://advances.sciencemag.org/cgi/ content/full/6/44/eabb4848/DC1
REFERENCES AND NOTES
1. P. Friedlingstein, M. W. Jones, M. O’Sullivan, R. M. Andrew, J. Hauck, G. P. Peters, W. Peters, J. Pongratz, S. Sitch, C. LeQuéré, D. C. E. Bakker, J. G. Canadell, P. Ciais, R. B. Jackson, P. Anthoni, L. Barbero, A. Bastos, V. Bastrikov, M. Becker, L. Bopp, E. Buitenhuis, N. Chandra, F. Chevallier, L. P. Chini, K. I. Currie, R. A. Feely, M. Gehlen, D. Gilfillan, T. Gkritzalis, D. S. Goll, N. Gruber, S. Gutekunst, I. Harris, V. Haverd, R. A. Houghton, G. Hurtt, T. Ilyina, A. K. Jain, E. Joetzjer, J. O. Kaplan, E. Kato, K. K. Goldewijk, J. I. Korsbakken, P. Landschützer, S. K. Lauvset, N. Lefèvre, A. Lenton, S. Lienert, D. Lombardozzi, G. Marland, P. C. McGuire, J. R. Melton, N. Metzl, D. R. Munro, J. E. M. S. Nabel, S. I. Nakaoka, C. Neill, A. M. Omar, T. Ono, A. Peregon, D. Pierrot, B. Poulter, G. Rehder, L. Resplandy, E. Robertson, C. Rödenbeck, R. Séférian, J. Schwinger, N. Smith, P. P. Tans, H. Tian, B. Tilbrook, F. N. Tubiello, G. R. van der Werf, A. J. Wiltshire, S. Zaehle, Global carbon budget 2019. Earth Syst. Sci. Data 11, 1783–1838 (2019). 2. O. Hoegh-Guldberg, D. Jacob, M. Taylor, T. G. Bolanos, M. Bindi, S. Brown, I. A. Camilloni,
A. Diedhiou, R. Djalante, K. Ebi, F. Engelbrecht, J. Guiot, Y. Hijioka, S. Mehrotra, C. W. Hope, A. J. Payne, H. O. Portner, S. I. Seneviratne, A. Thomas, R. Warren, G. Zhou, The human imperative of stabilizing global climate change at 1.5°C. Science 365, eaaw6974 (2019). 3. United Nations Framework Convention on Climate Change, COP 21 Climate Agreement
(UNFCCC, Paris, 2015); https://unfccc.int/resource/docs/2015/cop21/eng/l09r01.pdf. 4. N. Seddon, B. Turner, P. Berry, A. Chausson, C. A. J. Girardin, Grounding nature-based climate solutions in sound biodiversity science. Nat. Clim. Change 9, 84–87 (2019). 5. B. W. Griscom, J. Adams, P. W. Ellis, R. A. Houghton, G. Lomax, D. A. Miteva,
W. H. Schlesinger, D. Shoch, J. V. Siikamaki, P. Smith, P. Woodbury, C. Zganjar, A. Blackman, J. Campari, R. T. Conant, C. Delgado, P. Elias, T. Gopalakrishna, M. R. Hamsik, M. Herrero, J. Kiesecker, E. Landis, L. Laestadius, S. M. Leavitt, S. Minnemeyer, S. Polasky, P. Potapov, F. E. Putz, J. Sanderman, M. Silvius, E. Wollenberg, J. Fargione, Natural climate solutions. Proc. Nat. Acad. Sci. U.S.A. 114, 11645–11650 (2017).
6. J.-F. Bastin, Y. Finegold, C. Garcia, D. Mollicone, M. Rezende, D. Routh, C. M. Zohner, T. W. Crowther, The global tree restoration potential. Science 365, 76–79 (2019). 7. Y. M. Bar-On, R. Phillips, R. Milo, The biomass distribution on Earth. Proc. Natl. Acad. Sci.
U.S.A. 115, 6506–6511 (2018).
8. T. B. Atwood, R. M. Connolly, E. G. Ritchie, C. E. Lovelock, M. R. Heithaus, G. C. Hays, J. W. Fourqurean, P. I. Macreadie, Predators help protect carbon stocks in blue carbon ecosystems. Nat. Clim. Change 5, 1038–1045 (2015).
9. J. E. Allgeier, D. E. Burkepile, C. A. Layman, Animal pee in the sea: Consumer-mediated nutrient dynamics in the world's changing oceans. Glob. Chang. Biol. 23, 2166–2178 (2017).
10. O. J. Schmitz, P. A. Raymond, J. A. Estes, W. A. Kurz, G. W. Holtgrieve, M. E. Ritchie, D. E. Schindler, A. C. Spivak, R. W. Wilson, M. A. Bradford, V. Christensen, L. Deegan, V. Smetacek, M. J. Vanni, C. C. Wilmers, Animating the carbon cycle. Ecosystems 17, 344–359 (2014).
11. A. J. Pershing, L. B. Christensen, N. R. Record, G. D. Sherwood, P. B. Stetson, The impact of whaling on the ocean carbon cycle: Why bigger was better. PLOS ONE 5, e12444 (2010).
12. C. Costello, D. Ovando, T. Clavelle, C. K. Strauss, R. Hilborn, M. C. Melnychuk, T. A. Branch, S. D. Gaines, C. S. Szuwalski, R. B. Cabral, D. N. Rader, A. Leland, Global fishery prospects under contrasting management regimes. Proc. Natl. Acad. Sci. U.S.A. 113, 5125–5129 (2016).
13. I. Muñoz, L. M. I. Canals, A. R. Fernandez-Alba, Life cycle assessment of the average Spanish diet including human excretion. Int. J. Life Cycle Assess. 15, 794–805 (2010). 14. E. Sala, J. Mayorga, C. Costello, D. Kroodsma, M. L. D. Palomares, D. Pauly, U. R. Sumaila,
D. Zeller, The economics of fishing the high seas. Sci. Adv. 4, eaat2504 (2018). 15. N. D. Higgs, A. R. Gates, D. O. B. Jones, Fish food in the deep sea: Revisiting the role
of large food-falls. PLOS ONE 9, e96016 (2014).
16. J. C. Drazen, D. M. Bailey, H. A. Ruhl, K. L. Smith Jr., The role of carrion supply in the abundance of deep-water fish off California. PLOS ONE 7, e49332 (2012). 17. M. Czamanski, A. Nugraha, P. Pondaven, M. Lasbleiz, A. Masson, N. Caroff, R. Bellail,
P. Treguer, Carbon, nitrogen and phosphorus elemental stoichiometry in aquacultured and wild-caught fish and consequences for pelagic nutrient dynamics. Mar. Biol. 158, 2847–2862 (2011).
18. G. Turi, Z. Lachkar, N. Gruber, Spatiotemporal variability and drivers of pCO2 and air–sea
CO2 fluxes in the California Current System: An eddy-resolving modeling study.
Biogeosciences 11, 671–690 (2014).
19. R. A. Nicholson, Bone degradation in a compost heap. J. Archaeol. Sci. 25, 393–403 (1998). 20. E. Garrido-Gamarro, W. Orawattanamateekul, J. Sentina, T. K. Srinivasa Gopal,
By-products of tuna processing (FAO, GLOBEFISH Research Programme, Vol. 112, Rome, 2013); http://www.fao.org/3/a-bb215e.pdf.
on November 6, 2020
http://advances.sciencemag.org/
21. R. W. R. Parker, J. L. Blanchard, C. Gardner, B. S. Green, K. Hartmann, P. H. Tyedmers, R. A. Watson, Fuel use and greenhouse gas emissions of world fisheries. Nat. Clim. Change
8, 333–337 (2018).
22. C. Le Quéré, R. B. Jackson, M. W. Jones, A. J. P. Smith, S. Abernethy, R. M. Andrew, A. J. De-Gol, D. R. Willis, Y. Shan, J. G. Canadell, P. Friedlingstein, F. Creutzig, G. P. Peters, Temporary reduction in daily global CO2 emissions during the COVID-19 forced
confinement. Nat. Clim. Change 10, 647–653 (2020).
23. G. O. Crespo, D. C. Dunn, A review of the impacts of fisheries on open-ocean ecosystems.
ICES J. Mar. Science 74, 2283–2297 (2017).
24. D. Tickler, J. J. Meeuwig, K. Bryant, F. David, J. A. H. Forrest, E. Gordon, J. J. Larsen, B. Oh, D. Pauly, U. R. Sumaila, D. Zeller, Modern slavery and the race to fish. Nat. Commun. 9, 4643 (2018).
25. M. D. Smith, Subsidies, efficiency, and fairness in fisheries policy. Science 364, 34–35 (2019).
26. J.-P. Gattuso, A. K. Magnan, L. Bopp, W. W. L. Cheung, C. M. Duarte, J. Hinkel, E. McLeod, F. Micheli, A. Oschlies, P. Williamson, R. Bille, V. I. Chalastani, R. D. Gates, J. O. Irisson, J. J. Middelburg, H. O. Portner, G. H. Rau, Ocean solutions to address climate change and its effects on marine ecosystems. Front. Mar. Sci. 5, 337 (2018).
27. E. Popova, D. Vousden, W. H. H. Sauer, E. Y. Mohammed, V. Allain, N. Downey-Breedt, R. Fletcher, K. M. Gjerde, P. N. Halpin, S. Kelly, D. Obura, G. Pecl, M. Roberts, D. E. Raitsos, A. Rogers, M. Samoilys, U. R. Sumaila, S. Tracey, A. Yool, Ecological connectivity between the areas beyond national jurisdiction and coastal waters: Safeguarding interests of coastal communities in developing countries. Mar. Policy
104, 90–102 (2019).
28. A. Schuhbauer, R. Chuenpagdee, W. W. L. Cheung, K. Greer, U. R. Sumaila, How subsidies affect the economic viability of small-scale fisheries. Mar. Policy 82, 114–121 (2017). 29. G. G. Singh, A. M. Cisneros-Montemayor, W. Swartz, W. Cheung, J. A. Guy, T. A. Kenny,
C. J. McOwen, R. Asch, J. L. Geffert, C. C. C. Wabnitz, R. Sumaila, Q. Hanich, Y. Ota, A rapid assessment of co-benefits and trade-offs among sustainable development goals.
Mar. Policy 93, 223–231 (2018).
30. C. M. Duarte, S. Agusti, E. Barbier, G. L. Britten, J. C. Castilla, J.-P. Gattuso, R. W. Fulweiler, T. P. Hughes, N. Knowlton, C. E. Lovelock, H. K. Lotze, M. Predragovic, E. Poloczanska, C. Roberts, B. Worm, Rebuilding marine life. Nature 580, 39–51 (2020).
31. N. C. Ban, G. G. Gurney, N. A. Marshall, C. K. Whitney, M. Mills, S. Gelcich, N. J. Bennett, M. C. Meehan, C. Butler, S. Ban, T. C. Tran, M. E. Cox, S. J. Breslow, Well-being outcomes of marine protected areas. Nat. Sustain. 2, 524–532 (2019).
32. D. Ricard, C. Minto, O. P. Jensen, J. K. Baum, Examining the knowledge base and status of commercially exploited marine species with the RAM Legacy Stock Assessment Database. Fish Fish. 13, 380–398 (2012).
33. D. M. Alongi, Carbon cycling and storage in mangrove forests. Annu. Rev. Mar. Sci. 6, 195–219 (2014).
34. X. Irigoien, T. A. Klevjer, A. Rostad, U. Martinez, G. Boyra, J. L. Acuna, A. Bode, F. Echevarria, J. I. Gonzalez-Gordillo, S. Hernandez-Leon, S. Agusti, D. L. Aksnes, C. M. Duarte, S. Kaartvedt, Large mesopelagic fishes biomass and trophic efficiency in the open ocean.
Nat. Commun. 5, 3271 (2014).
35. C. N. Trueman, G. Johnston, B. O'Hea, K. M. MacKenzie, Trophic interactions of fish communities at midwater depths enhance long-term carbon storage and benthic production on continental slopes. Proc. Biol Sci. 281, 20140669 (2014).
36. V. J. D. Tulloch, E. E. Plaganyi, C. Brown, A. J. Richardson, R. Matear, Future recovery of baleen whales is imperiled by climate change. Glob. Chang. Biol. 25, 1263–1281 (2019).
37. B. Worm, R. Hilborn, J. K. Baum, T. A. Branch, J. S. Collie, C. Costello, M. J. Fogarty, E. A. Fulton, J. A. Hutchings, S. Jennings, O. P. Jensen, H. K. Lotze, P. M. Mace, T. R. McClanahan, C. Minto, S. R. Palumbi, A. M. Parma, D. Ricard, A. A. Rosenberg, R. Watson, D. Zeller, Rebuilding global fisheries. Science 325, 578–585 (2009). 38. S. Roe, C. Streck, M. Obersteiner, S. Frank, B. Griscom, L. Drouet, O. Fricko, M. Gusti,
N. Harris, T. Hasegawa, Z. Hausfather, P. Havlik, J. House, G. J. Nabuurs, A. Popp, M. J. S. Sanchez, J. Sanderman, P. Smith, E. Stehfest, D. Lawrence, Contribution of the land sector to a 1.5 °C world. Nat. Clim. Change 9, 817–828 (2019).
39. P. A. del Giorgio, C. M. Duarte, Respiration in the open ocean. Nature 420, 379–384 (2002). 40. R. W. Wilson, F. J. Millero, J. R. Taylor, P. J. Walsh, V. Christensen, S. Jennings, M. Grosell,
Contribution of fish to the marine inorganic carbon cycle. Science 323, 359–362 (2009). 41. C. T. Perry, M. A. Salter, A. R. Harborne, S. F. Crowley, H. L. Jelks, R. W. Wilson, Fish as major
carbonate mud producers and missing components of the tropical carbonate factory.
Proc. Natl. Acad. Sci. U.S.A. 108, 3865–3869 (2011).
42. D. J. McCauley, M. L. Pinsky, S. R. Palumbi, J. A. Estes, F. H. Joyce, R. R. Warner, Marine defaunation: Animal loss in the global ocean. Science 347, 1255641 (2015). 43. M. Scheffer, S. Carpenter, B. de Young, Cascading effects of overfishing marine systems.
Trends Ecol. Evol. 20, 579–581 (2005).
44. J. K. Baum, B. Worm, Cascading top-down effects of changing oceanic predator abundances. J. Anim. Ecol. 78, 699–714 (2009).
45. T. J. Lavery, B. Roudnew, P. Gill, J. Seymour, L. Seuront, G. Johnson, J. G. Mitchell, V. Smetacek, Iron defecation by sperm whales stimulates carbon export in the Southern Ocean. Proc. Biol. Sci. 277, 3527–3531 (2010).
46. C. M. Duarte, D. Krause-Jensen, Export from seagrass meadows contributes to marine carbon sequestration. Front. Mar. Sci. 4, 13 (2017).
47. H. W. Ducklow, D. K. Steinberg, K. O. Buesseler, Upper ocean carbon export and the biological pump. Oceanography 14, 50–58 (2001).
48. N. Jiao, G. J. Herndl, D. A. Hansell, R. Benner, G. Kattner, S. W. Wilhelm, D. L. Kirchman, M. G. Weinbauer, T. W. Luo, F. Chen, F. Azam, Microbial production of recalcitrant dissolved organic matter: Long-term carbon storage in the global ocean. Nat. Rev.
Microbiol. 8, 593–599 (2010).
49. D. Pauly, D. Zeller, Catch reconstructions reveal that global marine fisheries catches are higher than reported and declining. Nat. Commun. 7, 10244 (2016).
50. D. Pauly, D. Zeller, Catch reconstruction: concepts, methods and data sources (Sea Around Us, University of British Columbia, 2015); http://www.seaaroundus.org/ catch-reconstruction-and-allocation-methods/.
51. S.-S. Leu, S. N. Jhaveri, P. A. Karakoltsidis, S. M. Constantinides, Atlantic mackerel (Scomber
scombrus, L): Seasonal variation in proximate composition and distribution of chemical
nutrients. J. Food Sci. 46, 1635–1638 (1981).
52. W. F. Thompson, H. Bell, Biological statistics of the Pacific halibut fishery (2) Effect of change in intensity upon total yield and yield per unit of gear (International Fisheries Commission No. 8, 1934).
Acknowledgments: We thank G. Tsui (SAU team) for the help in obtaining catch data. Funding: PhD scholarship was given to G.M. from the University of Montpellier. W.W.L.C.
acknowledges funding supports from NSERC (Discovery Grant: RGPIN-2018-03864), SSHRC (Partnership grant: OceanCanada) and the Killam Faculty Research Fellowship. Author
contributions: D.M., M.T., A.L., W.W.L.C., and G.M. designed the study. G.M., W.W.L.C., and
L.V. managed catch data collection with the SAU. E.S. and J.M. provided the data on government subsidies and profitability of fisheries. G.M., W.W.L.C., M.T., and D.M. developed the methodology. G.M. carried out data analysis and produced the figures with regular periodic feedback from L.V., M.T., D.M., and G.M., with substantial input and revision from all authors. Competing interests: The authors declare that they have no competing interests. Data and materials availability: All catch data used in this study are available from the SAU website (http://www.seaaroundus.org/). Data of government subsidies and profitability of fisheries are present in the paper and/or the supplementary materials of Sala et al. (14).
Submitted 27 February 2020 Accepted 15 September 2020 Published 28 October 2020 10.1126/sciadv.abb4848
Citation: G. Mariani, W. W. L. Cheung, A. Lyet, E. Sala, J. Mayorga, L. Velez, S. D. Gaines, T. Dejean, M. Troussellier, D. Mouillot, Let more big fish sink: Fisheries prevent blue carbon sequestration— half in unprofitable areas. Sci. Adv. 6, eabb4848 (2020).
on November 6, 2020
http://advances.sciencemag.org/
DOI: 10.1126/sciadv.abb48486 (44), eabb4848.
Sci Adv
ARTICLE TOOLS http://advances.sciencemag.org/content/6/44/eabb4848
MATERIALS
SUPPLEMENTARY http://advances.sciencemag.org/content/suppl/2020/10/26/6.44.eabb4848.DC1
REFERENCES
http://advances.sciencemag.org/content/6/44/eabb4848#BIBL
This article cites 48 articles, 11 of which you can access for free
PERMISSIONS http://www.sciencemag.org/help/reprints-and-permissions
Terms of Service
Use of this article is subject to the
is a registered trademark of AAAS.
Science Advances
York Avenue NW, Washington, DC 20005. The title
(ISSN 2375-2548) is published by the American Association for the Advancement of Science, 1200 New
Science Advances
License 4.0 (CC BY-NC).
Science. No claim to original U.S. Government Works. Distributed under a Creative Commons Attribution NonCommercial Copyright © 2020 The Authors, some rights reserved; exclusive licensee American Association for the Advancement of
on November 6, 2020
http://advances.sciencemag.org/