HAL Id: hal-00305209
https://hal.archives-ouvertes.fr/hal-00305209
Submitted on 1 Jan 2002HAL is a multi-disciplinary open access archive for the deposit and dissemination of sci-entific research documents, whether they are pub-lished or not. The documents may come from teaching and research institutions in France or abroad, or from public or private research centers.
L’archive ouverte pluridisciplinaire HAL, est destinée au dépôt et à la diffusion de documents scientifiques de niveau recherche, publiés ou non, émanant des établissements d’enseignement et de recherche français ou étrangers, des laboratoires publics ou privés.
in the Mella River (Italian Alps)
R. Ranzi, M. Bochicchio, B. Bacchi
To cite this version:
R. Ranzi, M. Bochicchio, B. Bacchi. Effects on floods of recent afforestation and urbanisation in the Mella River (Italian Alps). Hydrology and Earth System Sciences Discussions, European Geosciences Union, 2002, 6 (2), pp.239-254. �hal-00305209�
Effects on floods of recent afforestation and urbanisation in the
Mella River (Italian Alps)
R. Ranzi, M. Bochicchio and B. Bacchi
Università degli Studi di Brescia, Dipartimento di Ingegneria Civile, Via Branze, 38, I-25123 Brescia, Italy E-mail for corresponding author: [email protected]
Abstract
River floods are influenced by factors such as the duration, intensity and spacial distribution of precipitation and the land-use as well as the morphological characteristics of the river basin. While the characteristics of the precipitation are tied to the climatology of the region and can change only over the long term, anthropogenic land use changes exhibit a more pronounced dynamic. However, the consequences of such changes on the increment in flood volumes and their frequency must be estimated objectively. To quantify the effects of the urbanisation on the flood volumes and peaks in the Mella river basin, 311 km² in size, changes in land use in the past 50 years have been compared using two land use maps; the first was based on aerial photographs taken in 1954 and the second on photointerpretation and surveys in 1994. The comparison showed an increase in the forested areas in the upper part of the basin as the use of wood for fuel had declined and an increase in urban development in the valley bottom. Correspondingly, cultivated areas decreased in size. The consequence of these changes is that surface runoff, simulated with a distributed hydrological model, changes insignificantly at the catchment scale, but with slightly reduced flood peaks and volumes in today’s conditions.
Keywords: floods, land use changes, afforestation, urbanisation
Introduction
The scientific and media debates on possible changes in flood regimes induced by climate and land-use changes have been lively in recent decades. Changes in climate can influence the water cycle dramatically over a time scale of tens of thousands of years, as exemplified by the Ice Ages that the Earth has experienced several times, while the impact on flood regimes of climate fluctuations measured over the past two centuries is only just perceivable. The short time series of reliable flood data prevents any reduction in the uncertainty of estimates of extremes in supposed changed climatic conditions. Over the even shorter time scale of decades, major land-use changes have been induced by man. These, together with the climate forcing and the soil hydraulic properties, determine the magnitude of flood peaks and volumes. Undoubtedly, urban expansion with the growth of population and its desire for further ‘civilisation’ has reduced the permeability of land surfaces and, hence, the time of concentration of floods, in the absence of mitigating solutions in the design of urban drainage systems. However, urbanised areas may be only a small fraction of
the surface of a basin, so that the impact of urbanisation may be negligible.
Another factor often blamed for increases in flood hazards is deforestation. If this is true all around the world for the recent past and is still of dramatic relevance for most equatorial and tropical forests, it is likely that the opposite is happening in many mountain catchments of Europe, for instance. There, significant anthropic pressure in the past led to forest exploitation without major limitations when wood, one of the most widely used sources of fuel and building material, had to compete with the needs for fields for agriculture and cattle-rearing. In the recent past, improvements in transportation systems and the search for major cultural and economic opportunities in cities reduced the pressure on the forests. Hence, natural regeneration of forests is occurring in many areas in the mountains and their foothills.
This paper seeks to detect such anthropic changes in the land-use in the Mella river basin, in the foothills of the Italian Alps; the basin is representative of such changes in the
degree of urbanisation and of forest cover. It then assesses the impact of such changes on flood intensity and volume by a quasi-quantitative method.
Following a description of the study area and its major geomorphological characteristics, the methodology is outlined, together with the distributed hydrological model adopted for the flood simulations. The methods used to detect land-use changes since the 19th century are quantified by the interpretation of aerial photographs, taken in 1954 and 1994. Finally, the possible impact on floods is quantified and discussed in the light of previous literature, on the basis of the simulation of major floods occurring in the past ten years using the hydrological model and assuming the land-uses of 1954 and 1994. The conclusions, although strictly model-dependent, are not trivial, and an overall neutral effect of land use changes on floods seems to result from the investigation.
The study area
THE MELLA RIVER BASIN
The hydrological basin is that of the Mella River at the outlet of Stocchetta, close to Brescia, in Northern Italy, between 45° 35’ 06” and 45° 51’ 34” N and 10° 06’ 37” and 10° 25’ 08” E. Altitude reaches its maximum at the Colombine peak, 2215 m asl. The stream gauge at the outlet is at 180.83 m and the official size of the gauged catchment is 311.08 km². A 250 m resolution Digital Elevation Model determined the basin area as 312.8 km² with an average altitude of 935 m (Fig. 1). Terrain slopes, a key geomorphological factor influencing the time response of overland and channel flow were distributed according to the frequency classes reported in Table 2; the most frequent slopes are between 0.33 and 1.0, too steep for mechanical cultivation which is confined to fields at the valley bottom.
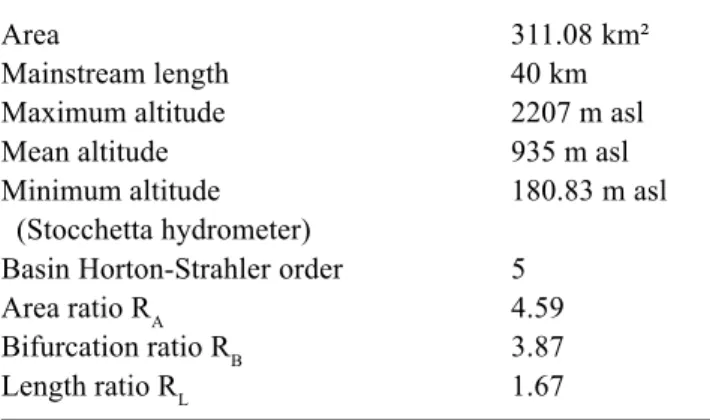
Other geomorphological parameters have been derived by direct analysis of the ‘blue lines’ on the official topographic maps at the scale 1:50 000. For instance, the river network, ordered according to the Horton-Strahler classification scheme, exhibits a power type scaling law for the number of streams, average drained area, and length v. stream order that are often observed in natural basins, other than the stream length. The length of the stream of highest order, five for the Mella River at the gauging station in Stocchetta, departs markedly from the scaling observed for lower order streams. Accordingly, the value of the length ratio Rl reported in Table 1 has to be taken with caution. The bifurcation ratio, Rb, and the area ratio, Ra, can be estimated more precisely from the observed scaling, although the fifth order stream proceeds downstream beyond the Stocchetta gauge.
The landscape of the basin varies. Near the outlet, the valley is wide as is the river channel, which has a ratio of water depth to channel width of about 15 during floods; agriculture is favoured, although it has to compete with the pressure of urbanisation and industry, much developed in this valley called Valtrompia. Rocks are basically limestone of medium or high permeability (Fig. 3). In its upper part, the valley and the river channel become narrower and deciduous forest mixed with pastures covers the slopes up to an altitude of 1800-2000m where permanent meadows predominate. In the valley upstream of the Bovegno gauge, metamorphic rocks of lower permeability prevail.
THE BASIN MONITORING SYSTEM
At the Stocchetta station, hourly runoff has been recorded since 1990. Three other stream gauges contribute to the hydrometric monitoring of floods (Fig. 1). In the upstream catchment, the gauge at Bovegno has monitored water levels from an 88 km² basin on a daily basis since 1955. Even before then, records were taken, but frequent floods damaged the instrumentation and modified the control section, so that extension into the past of the record of
Table 1. Major geomorphological characteristics and
variables of the Mella river basin at Stocchetta. The area corresponds to the official value. Hierarchical parameters are derived from the blue lines at the 1:50.000 scale. For the length ratio see the text.
Area 311.08 km²
Mainstream length 40 km
Maximum altitude 2207 m asl
Mean altitude 935 m asl
Minimum altitude 180.83 m asl
(Stocchetta hydrometer)
Basin Horton-Strahler order 5
Area ratio RA 4.59
Bifurcation ratio RB 3.87
Length ratio RL 1.67
Table 2. Distribution of slopes in the basin.
Slope Area [km2] % 0-10% 16.4 5.2 10%-30% 84.0 26.9 30%-100% 192.4 61.5 > 100% 20.0 6.4 Total 312.8 100.0
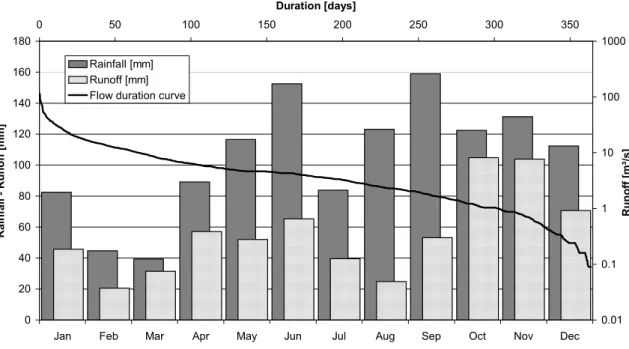
Mella river at Stocchetta: rainfall and runoff regimes (1992-2000) 0 20 40 60 80 100 120 140 160 180
Jan Feb Mar Apr May Jun Jul Aug Sep Oct Nov Dec
Rainfall - Runoff [mm] 0.01 0.1 1 10 100 1000 0 50 100 150 200 250 300 350 Duration [days] Runoff [m³/s] Rainfall [mm] Runoff [mm] Flow duration curve
Fig. 1. The 250 m digital elevation model of the Mella River basin at the Stocchetta outlet,
312.8 km2 in size, with the monitoring system used for the simulations.
Fig. 2. Rainfall and runoff regimes in the Mella River at Stocchetta for the 1992-2000 observation period.
Memmo ■■■■■ O S.Colombano
O Bovegno
■
Lumezzane
S. Vigilio ■ Mella at Stocchetta
Mella at Sarezzo Gobbia at Sarezzo O daily raingauge ■ hourly raingauge streamgauge
N
streamflows at that site is not feasible. An automatic station with real-time data transmission was installed in November 2000. Downstream on the Mella River, at Sarezzo, and on the Gobbia creek, a left-side tributary of the main river nearby, two automatic stations have recorded water level hourly since 1997. For the Mella at Stocchetta and at Sarezzo and for the Gobbia creek at Sarezzo, runoff rating curves were computed on the basis of discharge measurements at different stages (six for the Stocchetta gauge) and the hypothesis of steady-state flow.
Precipitation has been recorded in the basin since 1888 at the Memmo Meteorological Observatory in the upper catchment at an altitude of 1000 m. Hourly rainfall records are available for past periods there as well as at S. Vigilio near the basin outlet and, more recently, in Lumezzane, on the Gobbia creek. Daily rainfall records for the past have been collected for the S. Colombano and Bovegno stations. Mean annual precipitation from records at six stations from 1921 to 1970 is 1300 mm. Point Intensity-Duration-Frequency curves for the Memmo gauge from 49 years’ record of annual maxima of rainfall depth, h (mm), with duration, d (hrs), of 1, 3, 6, 12 and 24 hours have the equation
h=35 d0.38, when the 10 years’ return period EV1 quantiles
are fitted with a power law equation. The mean annual peak flow is 180 m³ s-1 and floods are more frequent in September
and October. Rainfall and runoff regimes computed for 1992-2000 are represented in Fig. 2; annual precipitation was 1260 mm and runoff 670 mm. As there are no major surface reservoirs or lakes in the basin, the 590 mm losses can be ascribed mainly to evapotranspiration and subsurface drainage.
Methods
ACQUISITION OF DATA ON LAND USE AND PERMEABILITY
Detecting the effect of land use changes on the flood regimes in the Mella River catchment requires information on the permeability of soils and rocks to implement a realistic model of the efficiency of the surface in partitioning rainfall into surface storage, runoff and infiltration. Hence, a map at a scale 1:10.000 was produced based on geological maps enhanced by interpretation of geomorphological surface features detected on aerial photographs and some point measurements of physical and hydrological properties of soil samples. Ninety soil samples were collected for texture classification and laboratory measurements of saturated hydraulic permeability with a variable head permeameter and retentivity curves using 5 bar and 15 bar Richards plates.
These data are still being processed to quantify the limits of the permeability classes. For this study, six classes were identified, by attributing, respectively, a high, medium and low permeability to bare rocks and soil layers. Figure 3 shows that impervious rocks dominate the upper part of the basin where the metamorphic geological unit of ‘Verrucano lombardo’ and filladic rocks are present; bare rocks with medium and high permeability occur in the medium and lower Mella basin, where limestone predominates, as in most of the foothills of the Central and Eastern Italian Alps. Soil alluvial deposits in the valley bottom and deposits of debris over lateral slopes have, on average, high and medium permeability. However, the permeability classes provide limited quantitative information. Hence, a conceptual hydrological model of the soil was used.
More accurate information on land use than was available in previously published statistical inventories (ISTAT, 1971, 1981, 1991), became available after 1980 by exploiting satellite data by the CORINE project, sponsored by the European Union. These provided more homogeneous and better standardised land-use classifications, as compared to the more subjective certificates formerly produced by individual landowners and verified by occasional sampling. It is unfortunate that satellite data were not available prior to 1980; this has prevented unbiased comparisons with past land-usage. However, aerial photographs on a scale of 1:30 000 taken by the Istituto Geografico Militare for the whole of Italy in the summer of 1954, were georegistered and digitised at 10 m resolution and land-use identified by photointerpretation. The classification included urban areas, crops, grass, wood, pastures and bushes.
For the current situation, the land-use map produced under the supervision of Regione Lombardia was used. It was produced on a 1:10.000 scale, based on aerial photography in the summer of 1994, similar to that of the 1954 map. Although the subjectivity of the operator cannot be avoided, a substantial homogeneity of the two maps, from a methodological point of view, is better ensured than using other sources of information.
THE SOIL COMPONENT OF THE HYDROLOGICAL MODEL
The hydrological flood model adopted, of the conceptual and distributed type, comprises two components. The first is the soil model that describes in a simple mathematical scheme the complex physical processes that include the interception of rainfall by vegetation, the storage in surface ponds and the partitioning of the resulting rainfall volume into infiltration and runoff. The choice of the class of model, of the ‘infiltration excess’ or of the ‘saturation excess’ type,
was based on the quality of the data available and the experience gained in simulating floods in several catchments in the Italian Alps.
Models assuming rapid response runoff volumes to be produced when the rainfall rate, i(t), exceeds a time-varying infiltration capacity threshold, f(t), as in the Horton (1938) or the Philip (1958) models, are very sensitive to the parameters adopted. The non-linearity of the soil model response to the rainfall input is mainly of the threshold type. In fact, the excess rainfall can suddenly become zero with rainfall rates below the capacity f(t), that largely depends on the saturated permeability of soils or rocks, Ks, a parameter difficult to measure for natural surfaces. In immature mountain soils, surface permeabilities of 10-5 to
10-6 m s-1 are often measured (see for instance Bacchi and
Ranzi, 2000, for results of field surveys in a catchment in the Italian Alps); these values approximate to the rainfall intensities experienced during floods in a Mediterranean climate. Hence, the computed excess runoff rates and volumes are very sensitive to the value of Ks and can become zero for many rainfall events where floods are observed. The set-up of models of this class is very subjective, when the data available on soil properties rather than just numerical calibration procedures are used. Dunne (1978), based on his experience and on experimental data, indicates how Hortonian overland flow seldom occurs in humid regions, because of high infiltration rates in those landscapes.
Models predicting surface runoff as a result of a partial saturation of surface storage incorporate a ‘weaker’ non-linearity, at least for flood events with significant rainfall volume. For many of them, surface runoff results when cumulated rainfall exceeds the saturation capacity of surface storages, such as interception and surface ponds; subsequently, rainfall is partitioned into surface and subsurface fluxes depending on the degree of saturation of soils. As the degree of saturation of the soil layer, or, similarly, the saturated fraction of the basin surface (Moore and Clarke, 1983; Beven and Kirkby, 1979; Todini, 1996), increases, the runoff tends to depend more linearly on the rainfall, irrespective of the time history of the hyetograph,
i(t). Accordingly, uncertainties in the assumed parameters
affect the runoff volume predicted less violently.
This is, possibly, the reason why a relatively simple model of the saturation excess type was adopted, satisfactorily, by several authors to simulate floods, many of them in the Italian Alps (Mancini et al., 1998; Brath and Montanari, 2000).
The model adopted was the Curve Number method investigated thoroughly by the Soil Conservation Service (U.S.D.A., 1986). This assumes that runoff volumes, P, are
proportional to the rainfall volumes, I, exceeding an Initial abstraction threshold, Ia, through a factor which is the ratio of the accumulated infiltration, F, to a storage capacity, S.
otherwise for I I;0, ) I -(I S F = P a > a (1)
Together with the continuity equation that, for I>Ia states that: P I F = I + a+ , (2)
the cumulative runoff volume becomes non-linearly related to the excess rainfall volume (I-Ia)
(
)
P = I - I I - I + S a 2 a (3) The non-linearity tends to disappear asymptotically for flood events with rainfall volumes exceeding the soil storage capacity S, the model’s key parameter. This parameter is important also in more sophisticated models with a higher degree of conceptualisation, such as that proposed recently by Mishra et al. (1999). They establish a relation between the infiltration model and the SCS-CN method, provided three additional parameters are introduced. Other authors (see Beven, 2000, for a critical review) consider the SCS-CN method is similar to an infiltration excess procedure, if a spatially variable but time constant infiltration capacity is assumed in the catchment. However, because the threshold effects peculiar to infiltration excess models disappear in the Curve Number procedure as soon as the initial abstraction volumes are saturated, it is more obvious to consider it as a saturation excess model as do several other authors.In this study, the dependence of the volume of initial abstraction on the storage capacity adjusted according to the precipitation volume in the five days preceding the event, API5, has been set according to the standard SCS-CN method, with minor modifications described in detail in Bacchi et al. (2001).
The storage capacity was set for each 250 × 250 m2 cell
of the digital representation of the catchment. A permeability class A-B-C-D, with A indicating pervious soils and D the most impervious ones was assigned using the relative order of permeability given by the permeability map. Then the sensitivity of the model’s results to the soil classes was investigated by assigning the A, B and C classes to the high to low permeability rocks and soils.
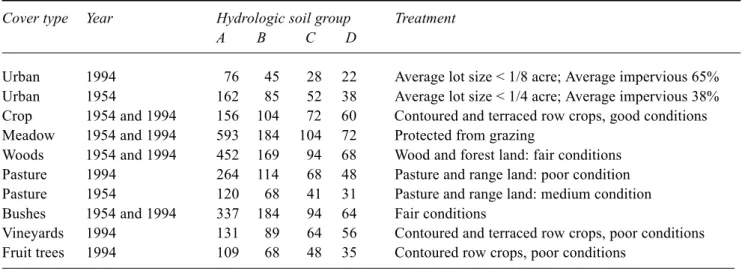
The assignment of the land-use class, the second information needed to estimate the soil storage, S, was more detailed and less subjective. Extensive experiments conducted worldwide facilitated quite a detailed
cross-reference table between land use classes, soil permeability and storage capacity. These tables are one of the key reasons for the wide diffusion of the SCS method in hydrological practice. More physically-based methods are more difficult to apply over large basins because of a lack of information on physical soil parameters in relation to different land-use practices. To assign land use to a specific class, the evolution of land usage in the Mella basin was considered; for the ‘urban’ and ‘pasture’ classes different parameters were adopted for the 1954 and 1994 conditions. Urbanised areas in 1954 were more likely to be pervious than the same
urbanised area in 1994, because stormwater systems and the major imperviousness of the paved surfaces were more efficient in producing surface runoff in 1994 than in 1954. Also, pastures were more extensively exploited in 1954 than in 1994, when the population of sheep and cattle decreased. Accordingly, the values adopted for the maximum storage capacity associated with land use and permeability classes are reported in Table 3 (from U.S.D.A., 1986).
By linking the permeability classes and the land-use classes for 1954 and 1994, a digital map of the storage capacity of the basin’s surface layer was produced; this enabled the computation, cell by cell, step by step of the runoff volumes feeding the routing component of the flood model.
THE FLOOD ROUTING COMPONENT OF THE HYDROLOGICAL MODEL
The model’s second component reproduces the routing mechanisms of the overland flow and of the channel flow. Detailed experiments on natural surfaces conducted by Emmett (1970) enable computation of a rating curve for overland flow of the type:
q = a.yb (4)
where q [m2 s-1] is the surface runoff rate per unit width, y
[m] the depth of the sheet of water over the slopes, a and b parameters depending on the type of flow, the surface roughness and the slope. For turbulent flow b = 5/3, while
b = 3 for laminar flow, the parameter a depends on the slope
and roughness for turbulent flow, the slope and viscosity for laminar flow. Shallow overland flow cannot be interpreted easily in terms of hydraulic relationships that are widely used for other open channel flows. These
Table 3. Maximum storage capacity S (mm) for the land use and permeabilty classes adopted in this study.
Cover type Year Hydrologic soil group Treatment
A B C D
Urban 1994 76 45 28 22 Average lot size < 1/8 acre; Average impervious 65% Urban 1954 162 85 52 38 Average lot size < 1/4 acre; Average impervious 38% Crop 1954 and 1994 156 104 72 60 Contoured and terraced row crops, good conditions Meadow 1954 and 1994 593 184 104 72 Protected from grazing
Woods 1954 and 1994 452 169 94 68 Wood and forest land: fair conditions Pasture 1994 264 114 68 48 Pasture and range land: poor condition Pasture 1954 120 68 41 31 Pasture and range land: medium condition Bushes 1954 and 1994 337 184 94 64 Fair conditions
Vineyards 1994 131 89 64 56 Contoured and terraced row crops, poor conditions Fruit trees 1994 109 68 48 35 Contoured row crops, poor conditions
Fig. 3. The quali-quantitative map of permeability of rocks and
differences affect both friction laws and processes related to sediment inception and transport (Pilotti and Menduni, 2001). The presence of local disturbances, as gravels, roots, vegetation, the formation of localised erosional patterns producing rills, and preferential paths is such that the parameters of Eqn. (4) can change widely from experiment to experiment. The experiments by Emmett (1970) indicated that the higher the slope, the smaller was the exponent b, on average. In particular, for the highest slopes of the natural plots selected in those experiments, the value of b was not far from one. For the site BL-2, with a slope of 0.332, a value of b = 1 and of a = 0.032 can be estimated from the graphs in the original report (Emmett (1970) page A37).
These values are encouraging because that slope is consistent with the class of most frequent slopes encountered in the Mella River basin. Then, because of the linearity of the runoff rate v. the water depth, overland flow can be represented as a linear reservoir. Its time constant, the average residence time of the water over the slope, can be estimated as one half of the time of concentration of runoff. For kinematic flow over the surface, the time of concentration [s] needed for a pulse of net rainfall p [m s-1]
to reach the slope bottom, of length L [m] is, assuming Eqn. (4)
Tc = [L.p(1-b).a-1]1/b . (5)
For the ‘linear’ model, the parameter a becomes the average velocity of the overland flow and its magnitude, 0.03 ms-1
is quite reasonable. However, when the departure from sheet flow is marked and erosion rills form over the slopes, the flow tends to concentrate over a narrower width and the water depth and velocity increase. During floods, the mean overland flow velocity is above 0.03 ms-1.
The length of the overland flow was taken to be 500 m, corresponding to a constant value of two cells for the support area of the channel flow. This value was derived from the drainage network reported by the ‘blue lines’ of the 1:10.000 hydrographic maps available.Surface runoff is routed through the cells of the lateral slopes, such that downslope cells receive higher water volumes in input and tend to saturate more rapidly than upstream cells, thus reproducing to some extent the topographic ‘saturation effect’ mechanism that is the core idea of the topographic model by Beven and Kirkby (1979).
As soon as the overland flow reaches the channel, the flood is routed according to a Muskingum-Cunge scheme (Cunge, 1969). This is based on the Muskingum scheme with the time constant parameter, K, derived from the hydraulic characteristics of the channel and the routed discharge, Q. Starting from the kinematic one-dimensional
flow equation
(
)
∂ ∂ ∂ ∂ Q t Q s +c = ⋅c qe qu− (6)where (qe-qu) represents the lateral flux per unit length of the channel sides, and c the celerity of the wave, by using a finite difference scheme for the derivatives in space and in time, the runoff at the spatial node i+1 and the time step
j+1 can be represented in a way that is similar to the standard
Muskingum scheme:
(
1 1)
4 1 3 2 1 1 1 1 + + + + + + = + + + − uj j e j i j i j i j i CQ C Q C Q C q q Q (7)The coefficients C1, C2 and C3 are the same as those of the Muskingum method
(
X)
t K X K t C ∆ + − − ∆ = 1 2 2 1 , (8a)(
X)
t K X K t C ∆ + − + ∆ = 1 2 2 2 , (8b) ( ) ( X) t K K t X C ∆ + − ∆ − − = 2211 3 , (8c)and C4 that has the dimension of a length, is given by
(
X)
t K t c C ∆ + − ∆ = 1 2 2 4 . (8d)By estimating the time constant K of the Muskingum method equal to the time needed for the wave, with celerity
c, to route through the distance ∆s, K=∆s/c, the coefficients
C1, C2, C3 and C4 of the Muskingum method correspond to those of the kinematic model (Eqn. 7). The dimensionless parameter X, that controls the way the flood is damped downstream, can be estimated by supposing that the numerical diffusivity Dn, introduced by the finite difference scheme adopted in Eqn. (7)
− ∆ =c s X Dn 2 1 , (9)
is the same as the hydraulic diffusivity Dh in the linear convection-diffusion wave propagation model
(
)
∂ ∂ ∂ ∂ ∂ ∂ Q t +c s= s + − Q Dh Q c qe qu 2 . (10)In this way, the damping of the flood downstream in the channel can also be reproduced. Considering that the hydraulic diffusivity can be estimated as (see, for instance,
Marchi and Rubatta 1981) f h i B Q D 2 ≈ , (11)
where B is the channel width and if its slope, the parameter
X can be computed as a function of the flow and of the
channel geometry, as ∆ − = s c bi Q X f 1 2 1 . (12)
Stability and accuracy of the numerical scheme are ensured when the computational time step is limited according to
2KX ≤ ∆τ ≤ 2K(1-X) . (13)
The left side condition corresponds to the criterion C1≥0 generally recommended to obtain an accurate solution of the scheme (see also Ponce and Theurer, 1982 for a discussion of the accuracy conditions). The right side limitation derives from stability conditions. To avoid divergence of the numerical scheme and the simulated flood wave amplifying unrealistically downstream, the numerical diffusivity Dn should remain positive; from Eqn. (9) this condition holds if, and only if, X ≤ 1/2 or, correspondingly, 1 ≤ 2(1–X).
The numerical dispersion reduces as the Courant number Cu=c∆t /∆s=∆t/K is small and, possibly, close to 1 as recommended by Cunge (1969) for the linear scheme. Orlandini and Rosso (1996) showed that, for higher values of Cu, for instance for Cu>3, numerical fluctuations occur
in the scheme adopted in Eqns. (7) and (8) to solve the nonlinear case of the kinematic flow equation adopted to simulate overland flow. As a result of these theoretical and empirical evidences the upper limit value Cu=1 is taken and the right hand side of condition (13) holds.
The key parameter, K, can be estimated on the basis of the current discharge and celerity. Ponce and Yevjevich (1978), on the basis of numerical simulations of a flood propagation over a 322 km long river, suggested that the celerity is a weighted mean of the current discharge computed at the previous space node, and the current node at the previous time step. The mass conservation was verified with a high degree of precision. The same assumption was adopted by Orlandini and Rosso (1998) who represented the channel geometry on the basis of geomorphological laws. This scheme is particularly suitable for real time applications, when the discharge is not known in advance. Ranzi et al. (2000), for instance, applied Eqns. (7) to (13) numerical scheme with the celerity and the diffusivity computed on the basis of the current discharge Qij to forecast
a flood in a river of the western Italian Alps and verified that the scheme was conservative with less than a 1% error. In the case of the Mella River, where the discharge was known in advance, a constant celerity estimated on the basis of a reference discharge Qref was adopted. Whichever scheme is adopted to estimate the celerity and the time constant K, the stability condition, Eqn. (13) is verified at each time step. Time steps of the order of 60 s were adopted, by considering that the average speed of the flow was, during floods, about 1–2 m s-1 and ∆s was 250 m for straight
channels between computational nodes.
Subsurface flow was then added with the simplified
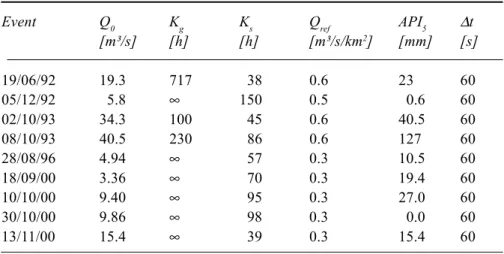
Table 4. Values of the baseflow Q0, the baseflow and subsurface flow time constants,
Kg and Ks, respectively, the reference runoff for the flood propagation Qref, the Antecedent Precipitation Index API5 and the computational time step ∆t for the selected events.
Event Q0 Kg Ks Qref API5 ∆t
[m³/s] [h] [h] [m³/s/km2] [mm] [s] 19/06/92 19.3 717 38 0.6 23 60 05/12/92 5.8 ∞ 150 0.5 0.6 60 02/10/93 34.3 100 45 0.6 40.5 60 08/10/93 40.5 230 86 0.6 127 60 28/08/96 4.94 ∞ 57 0.3 10.5 60 18/09/00 3.36 ∞ 70 0.3 19.4 60 10/10/00 9.40 ∞ 95 0.3 27.0 60 30/10/00 9.86 ∞ 98 0.3 0.0 60 13/11/00 15.4 ∞ 39 0.3 15.4 60 B
scheme of a linear reservoir that is filled by the infiltration volume F and is drained to the outlet cell by a time constant which is estimated from the recession curve of the hydrograph. Parameters of the model’s set up are reported in Table 4.
Land use changes
The natural regeneration of forest lands, the reforestation established on formerly forested areas and the afforestation on previously unforested land are monitored in several areas of Europe and in non-tropical areas. All three processes are, here, called ‘afforestation’; differences in their significance are caused mainly by changes in cultivation practices so they are mainly of anthropic origin.
In many regions of the Alps, forest-covered areas are recovering their original extent in the last two centuries. Since the Middle Aages, forests have been exploited intensively, initially for agricultural and farming purposes. Later, wood was in great demand as a fuel for heating for domestic and industrial requirements such as the fusion of salt, iron, silver and copper. Not until the 18th and the beginning of the 19th century was the importance of forests recognised with respect to hydrology; in several regions, for instance in the territory governed by Venice or in Tyrol, they were protected by special restrictive laws. Since then, forest-covered areas have increased in size in the Alps.
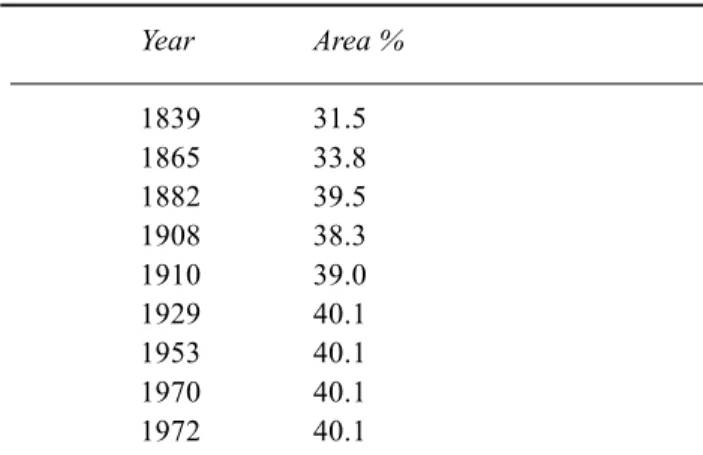
In the Tyrol region, formerly across Italy and Austria, as reported in Table 5, areas increased significantly in size since the beginning of the 19th century throughout the last century and are still increasing their size today. In the Province of Trento, at the western boundary of the Brescia territory, forest areas increased from 3053.70 km² to 3436.88 km² in about 30 years, from 1968 to 1996 (Provincia Autonoma di
Table 5. Forested area in the former region Tyrol
(1839-1910) and in the Province of Bolzano/Bozen (1929-1972) (From Provincia Autonoma di Bolzano, 1981).
Year Area % 1839 31.5 1865 33.8 1882 39.5 1908 38.3 1910 39.0 1929 40.1 1953 40.1 1970 40.1 1972 40.1
Fig. 4. The land use map for 1954, derived from the interpretation
of aerial photographs.
Fig. 5. The land use map for 1994, derived from the official 1:10000
scale maps based on the interpretation of aerial photographs. Trento, 1999). This tendency is confirmed for Italy as a whole, where the total forested area increased from 97 080 to 100 030 km² in the 1990 to 2000 decade, for Austria and
Switzerland (with an increase, respectively, from 38 090 km² to 38 860 km² and from 11 560 km² to 11 990 km² over the same period). These processes of natural regeneration of forests, reforestation and afforestation, seem to be diffused worldwide in non-tropical areas; FAO (2001) reported a net increase in forested areas of 2.9 million hectares for these regions during the period 1990 to 2000. This increase balances only part of the net decrease in forest of 12.3 million hectares in tropical areas, caused mainly by deforestation. The same afforestation tendency is being experienced in Valtrompia, a valley where quarries have been exploited since prehistory and wood was used both as a construction material and as fuel for melting metals (Rumi et al., 1996). Recently, these activities ceased as did farming in the uplands. Areas in the valley and in the nearby industrial town of Brescia became more attractive for the population. In consequence, urban areas increased in size significantly, as did the imperviousness of the valley soils and the area of cultivated crops was reduced. This land-use change and its hydrological impact have been monitored almost anywhere in the world. Hollis (1975), for instance, synthesises published results on this topic and shows how floods with a return period of 100 years may be doubled in size by a 30% paving of the basin. More novel, and documented more recently, is the increase in forest in the Mella basin; this can be seen by comparing the land use map produced for 1954 with that for 1994. (Figs. 4 and 5). As Fig. 6 shows, in greater detail, woods are slowly recovering their extent and pastures
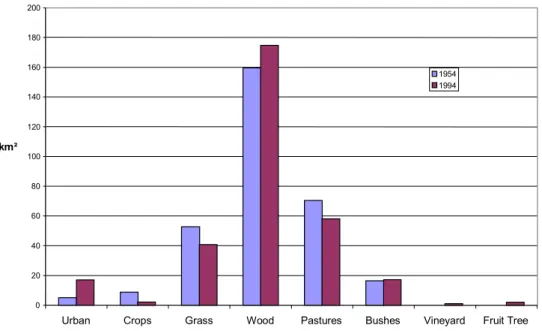
and meadows are decreasing slightly in size. Table 6 summarises such changes quantitatively. For instance, the growth of the urban area is 252% and the corresponding decrease in cultivated crops, vineyards and fruit trees is 42%. Forests and bushes increased by 9% and 5%, respectively, while pastures and meadows shrank by 17% and 23% respectively. The effect of these changes on floods cannot be estimated straightforwardly, because of the distributed nature of the processes involved in runoff production and flood propagation. The average storage capacity of the soil layer, however, increased slightly from 93.6 mm in 1954 to
Table 6. Land use in 1954 and 1994, detected from the
interpretation of aerial photographs.
Class 1954 1994 Difference km2 km2 km2 % Urban 4.9 16.9 +12.0 +245 Crops 8.8 2.2 –6.6 Vineyards - 0.9 +0.9 Fruit Trees - 2.0 2.0 –42 Grass 52.6 40.7 –11.9 –23 Wood 159.6 174.7 15.1 +9 Pastures 70.5 58.2 –12.3 –17 Bushes 16.4 17.2 +0.8 +5 Total 312.8 312.8
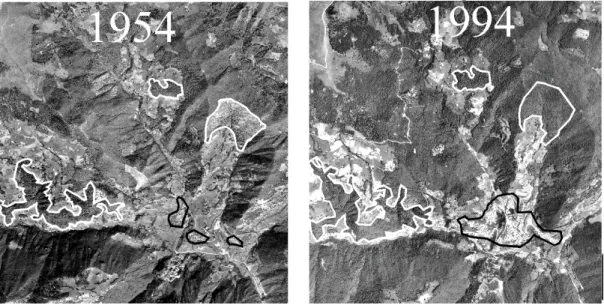
Fig. 6. Comparison of two aerial photographs taken in the mountain part of the Mella basin in 1954 (left) and 1994
(right). The afforestation during this period is evident from the change of the areas marked in white. Increase in the urbanised areas is evident from the change of the perimeters marked in black. Photographs collected under permission if IGM n°33 of 27-9-1985 and Regione Lombardia n°955 of 09/10 1991.
95.9 mm in 1994, with spatial standard deviations of 46.5 and 42.5 mm, respectively. In the model application, it seems that the increased storage capacity in forested areas goes some way to balancing the abrupt increase in urban areas, a result that would not be expected a priori.
Effects on floods
The impact of changes in forest cover on the hydrological cycle and on floods has been investigated by many authors. In Scotland, afforestation of moorland rough grazing has affected the hydrological cycle, through changes in evapotranspiration (Haria and Price, 2000). The impact of assumed land use changes in the 113.7 km² Huille catchment in Belgium was simulated by Bultot et al. (1990); they showed how coniferous forests, compared with pastures, would experience more frequent low flow days and fewer flood days.
With reference to the influence of the forest cover on storm flow response, Hewlett and Helvey (1970) report a detailed experiment in two experimental first-order catchments in the humid Appalachian Mountains. In one of the catchments, 0.44 km² in size, the mature hardwood forest was clear-felled completely after 18 years of hydrological monitoring, including 77 storms. After felling, the stormflow volume in the 30 flood events monitored in the three years’ treatment period increased by 11% overall and the mean peak flow by 7% after felling, the increase being more pronounced for larger floods. Stormflow was ascribed mainly to a variable source area concept rather than to substantial overland flow, the effect of forest being mainly a control on interception
storage and on soil storage capacity through evapotransporation.
Ziemer (1981) showed how clear-cutting 67% of the total timber volume in the South Fork catchment, a 4.24 km² basin in California, with a drier climate, produced a 4% increase in the peak flows after logging. In two small catchments of south-eastern Australia, with an even drier climate, and hydraulic conductivities in the surface layer ranging between 0.1 to 10 mm h-1, the effects of complete clearing of the
eucalypt forest were evaluated by Burch et al. (1987). Total runoff volumes were higher in the forest-cleared catchment than in the forested one for most of the 12 storm events selected for the investigations, the storm response being similar in the two catchments when initial soil moisture conditions were close to saturation.
To evaluate, quantitatively, the effect of land-use changes on flood peaks and volumes in the Mella basin, the model described earlier was applied to simulate the major floods measured since 1991. In this catchment, the land use changes in the forested areas differed somewhat from those reported previously in the sense that grasslands and pastures experienced natural forest regeneration and afforestation. Hourly rainfall data from the Memmo and S. Vigilio gauges and, for the autumn 2000 events, from the Lumezzane gauge were integrated with the daily manual observations in S. Colombano and Bovegno, disaggregated in time according to the hyetographs of the nearby hourly stations. Rainfall was then distributed over the basin by assigning to each cell the rainfall measured at the nearest station.
The model adopted was not calibrated because the parameters were fixed on the basis of the data acquired.
Fig. 7. Comparison between the size of the land uses classes in 1954 and 1994.
0 20 40 60 80 100 120 140 160 180 200
Urban Crops Grass Wood Pastures Bushes Vineyard Fruit Tree
km²
1954 1994
The shape factor of the channels, i.e. the ratio B/h of the channel width, B, to the water depth, h, was estimated from the geometry of some channel sections during floods, resulting in a fixed value of 15 that was assumed throughout the river network. This was assumed to follow the paths with maximum slope computed from the DEM, with a standard channel extraction algorithm (La Barbera, 1990). Also the channel Strickler roughness coefficient was fixed at the value of 33 m3s–1, estimated from available discharge
rating curves. It can be easily recognised that several of the model’s assumptions can be criticised. However, because of the huge number of parameters in a distributed model, the strategy for their adaptation should be chosen very carefully. It may be argued that, rather than use trial and
error or an automatic optimisation, the relative simplicity of the model should be kept with the parameters fixed and tested against data so as to identify measurements to be taken to guide the model’s improvements in the future (Dunne, 1983).
The model’s performances were verified by a visual inspection of the hydrographs (Fig. 8) and by computing the errors in the simulated peaks and volumes. The sensitivity of the results to the assumptions made on the soil permeabilty classes, those affected by major uncertainties, was investigated and summarised in Tables 7 and 8.
In the ‘control’ experiments the capability of the model to reproduce the rising limb, the peak and the recession curve
(a)
(b)
MELLA RIVER at STOCCHETTA 19/06/1992
0 50 100 150 200 250 300 350 400 0 20 40 60 80 100 120 Time [h] RUNOFF [m³/s] 0 2 4 6 8 10 12 14 16 rainfall [mm/h] Rain Q obs. Q simul. - 94 Q simul. - 54
MELLA RIVER at STOCCHETTA 02/10/1993
0 100 200 300 400 500 600 700 800 0 10 20 30 40 50 60 70 80 90 Time [h] RUNOFF [m³/s] 0 2 4 6 8 10 12 14 16 rainfall [mm/h] Rain Q obs. Q simul. - 94 Q simul. - 54
Fig. 8. Simulations of flood events (a) and (b), recorded at the Stocchetta gauge using the 1954 and 1994 land
use classification and the ‘control’ experiment permeability classes. The parameters of the soil and the runoff model were fixed a priori, based on the available information.
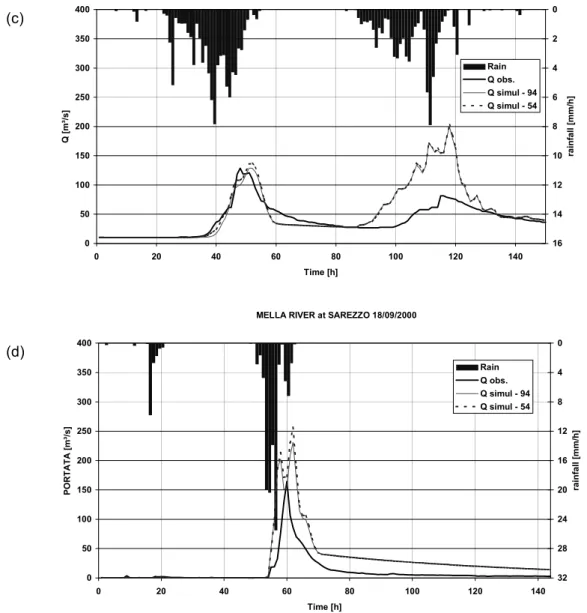
MELLA RIVER at SAREZZO 18/09/2000 0 50 100 150 200 250 300 350 400 0 20 40 60 80 100 120 140 Time [h] PORTATA [m³/s] 0 4 8 12 16 20 24 28 32 rainfall [mm/h] Rain Q obs. Q simul - 94 Q simul - 54 MELLA RIVER at STOCCHETTA 30/10/2000
0 50 100 150 200 250 300 350 400 0 20 40 60 80 100 120 140 Time [h] Q [m³/s] 0 2 4 6 8 10 12 14 16 rainfall [mm/h] Rain Q obs. Q simul - 94 Q simul - 54
Fig. 8. Simulations of flood event ( c) recorded at the Stocchetta gauge and of one event (d)recorded in Sarezzo using
the 1954 and 1994 land use classification and the ‘control’ experiment permeability classes. The parameters of the soil and the runoff model were fixed a priori, based on the available information.
of the floods is not excellent but, in general, is satisfactory, when considering that no model’s parameters were calibrated. Peaks tend to be overestimated and their timing exhibits some delay with respect to the observed ones. This may be due to the long residence time of water in the overland flow which, under the assumptions made, takes some hours to reach the bottoms of the slopes. Particularly, when subsequent floods are simulated, the second peak tends to be overestimated (Fig. 8c), possibly because the model does not take into account the drainage of soils just after the first peak. The model is also very sensitive to the initial soil moisture conditions reflected by the value of the API5 index.
With these limitations some useful observations can be
drawn from the simulations obtained when using the 1954 and the 1994 land use maps. The flood peaks and volumes are, on average, slightly higher for the 1954 conditions. The increased storage capacity of soils, estimated to be some 2.3 mm, on average, over the basin, induced a change in floods that is only just perceivable. This is a general result, throughout the events analysed and irrespective of the assumptions made on the soil classes, as the 1954 to 1994 trend is confirmed by the ‘sensitivity’ experiment.
This result seems not to depend on the spatial distribution of rainfall that was monitored at five gauging sites. Also, in the Sarezzo gauge indicated in Fig. 1, the afforestation seems to be capable of compensating for the increase in urban areas and floods tended to be slightly higher in 1954, as the
(c)
model’s simulations indicate (Fig. 7d). This ‘internal’ verification of the distributed model using the Sarezzo gauge is encouraging.
Conclusions
Land use has been changing in the Mella River since 1954. Forested areas increased (+15.1 km², +9%) as did urban areas (+12.1 km², +252%) while crops and pasture areas decreased. This is a result of social and economic changes in the valley where cessation of traditional mining and cattle
rearing activities led to the preservation of woods, formerly of major importance as a source of fuel and construction material, and the relocation of part of the population to the urbanised areas of the valley and the nearby cities. The capabilities of forests to store more water, as interception or in the soils rich in organic matter, than pastures and meadows is balanced by the increased imperviousness in the urbanised areas. The effect of such anthropic changes on flood volumes and peaks was estimated by a conceptual distributed model set up with the 1954 and 1994 land-use conditions assessed from aerial photographs. The effect of
Table 8. Changes in the flood volumes according to the hydrological simulations and assuming the 1954 and 1994 land use.
Simulations were performed assuming different permeability SCS-CN classes (B, C, D and A, B, C respectively in the ‘control’ and in the ‘sensitivity’ experiment). In brackets the percentage flood volume error.
Event Volume Volume Volume Difference Volume Volume Difference
observed simulated 1954 simulated 1994 1954-1994 simulated 1954 simulated 1994 1954-1994
classes B-C-D B-C-D B-C-D classes A-B-C A-B-C A-B-C
m3 × 103 m3 × 103 m3 × 103 [%] m3 × 103 m× 103 [%] 19/06/92 17401 13727 13307 (–23%) –3 3669 2877 –12 05/12/92 17661 13366 12746 (–28%) –5 5968 4948 –17 02/10/93 19820 18675 18161 (+44%) –3 16717 15943 –5 28/08/96 10197 4445 4361 (–57%) –2 276 191 –31 18/09/00 7647 23599 23443 (+206%) 0 9447 9262 –2 10/10/00 29774 48450 48185 (+62%) 0 35552 34752 –2 30/10/00 16556 24140 23572 (+42%) –2 11906 10879 –9 13/11/00 6887 6398 5886 (+88%) –8 1648 1030 – 38
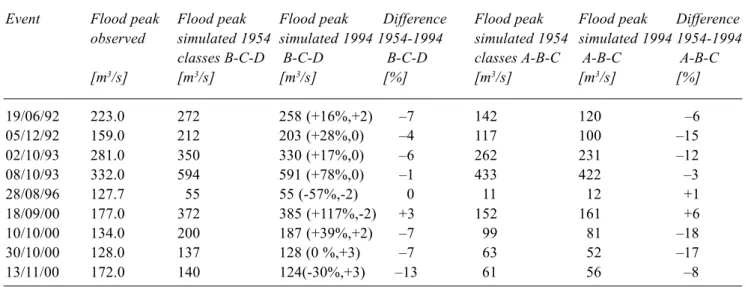
Table 7. Changes in the flood peaks according to the hydrological simulations and assuming the 1954 and 1994 land-use.
Simulations were performed assuming different permeability SCS-CN classes (B, C, D and A, B, C respectively in the ‘control’ and in the ‘sensitivity’ experiment). In brackets are reported the percentage peak error and the peak timing error, in hours.
Event Flood peak Flood peak Flood peak Difference Flood peak Flood peak Difference
observed simulated 1954 simulated 1994 1954-1994 simulated 1954 simulated 1994 1954-1994
classes B-C-D B-C-D B-C-D classes A-B-C A-B-C A-B-C
[m3/s] [m3/s] [m3/s] [%] [m3/s] [m3/s] [%] 19/06/92 223.0 272 258 (+16%,+2) –7 142 120 –6 05/12/92 159.0 212 203 (+28%,0) –4 117 100 –15 02/10/93 281.0 350 330 (+17%,0) –6 262 231 –12 08/10/93 332.0 594 591 (+78%,0) –1 433 422 –3 28/08/96 127.7 55 55 (-57%,-2) 0 11 12 +1 18/09/00 177.0 372 385 (+117%,-2) +3 152 161 +6 10/10/00 134.0 200 187 (+39%,+2) –7 99 81 –18 30/10/00 128.0 137 128 (0 %,+3) –7 63 52 –17 13/11/00 172.0 140 124(-30%,+3) –13 61 56 –8
the observed changes seems to be neutral, under the modelling hypotheses adopted, with a slight decrease in the flood peaks and volumes from 1954 to 1994. These conclusions depend on the modelling assumptions adopted and on the parameters set up, as in any modelling experiment, but a sensitivity experiment on the soil permeability classes adopted confirms the above tendency. Some deficiencies in the model’s capability to reproduce peak timings and flood volumes, especially when successive peaks are simulated, suggest the need for a measurement campaign to test some of the model’s hypotheses, thus making the model more adaptable for future applications.
Acknowledgements
The study was carried out under two research programmes: MURST-COFIN99 ‘Effetti Climatici ed antropici sui
processi idrologici’ and CNR-GNDCI ‘VAPI-RIVERS’
(Valutazione delle Piene-RIsposta di VERSante). The University of Brescia supported the grant of the second author. Comunità Montana della Valtrompia is thanked for having provided the permeability maps and some raingauge data. Other hydrological data were provided by ASM, Brescia and Genio Civile di Mantova. Two anonymous reviewers are thanked for their valuable suggestions.
References
Bacchi, B. and Ranzi, R. (Eds.), 2000. Runoff and Atmospheric Processes for flood Hazard Forecasting and Control. Contract ENV4-CT97-0552, Final Report, Brescia.
Bacchi, B., Bochicchio, M. and Ranzi, R., 2001. Modifiche d’uso
del suolo e loro effetti sui deflussi del fiume Mella. Univ. degli
Studi di Brescia, Dip. Ingegneria Civile -Technical Report, 1. Beven, K., 2000. Rainfall-runoff modelling, The Primer. Wiley,
Chichester, UK.
Beven, K. and Kirkby, M.J., 1979. A physically-based variable contributing area model of basin hydrology. Hydrolog. Sci. Bull.,
24, 43–69.
Brath, A. and Montanari, A., 2000. The effects of the spatial variability of soil infiltration capacity in distributed flood modelling. Hydrol. Process., 14, 2779–2794.
Bultot, F., Dupriez, G.L. and Gellens, D., 1990. Simulation of land use changes and impact on the water balance – a case study for Belgium. J. Hydrol., 114, 327–348.
Burch, G.J., Bath, R.K., Moore, I.D. and O’Loughlin, E.M., 1987. Comparative hydrological behaviour of forested and cleared catchments in southeastern Australia. J. Hydrol., 90, 19–-42. Cunge, J.A.,1969. On the subject of a flood propagation method
(Muskingum method). J. Hydraul. Res., 7, 205–230.
Dunne, T., 1978. Field studies of hillslope flow processes. In:
Hillslope Hydrology, M.J. Kirkby (Ed.), Wiley, Chichester, UK.
Dunne, T., 1983. Relation of field studies and modelling in the prediction of storm runoff. J. Hydrol., 65, 25–48.
Emmett, W., 1970. The hydraulics of overland flow on hillslopes.
Geological Survey Professional Paper 662-A.
FAO, 2001. State of the world’s forests, Rome.
Haria, A.H. and Price, D.J., 2000. Evaporation of Scots pine (Pinus
sylvestris) following natural re-colonisation of the Cairngom
mountains, Scotland. Hydrol. Earth Syst. Sci., 4, 451–461. Hewlett, J.D. and Helvey, J.D., 1970. Effect of forest clear-felling
on the storm hydrograph. Water Resour. Res., 6, 768–782. Hollis, G.E., 1975. The effect of urbanization on floods of different
recurrence interval. Water Resour. Res., 11, 431–435. Horton, R.E., 1938. The interpretation and application of runoff
plot experiments with reference to soil erosion problems. J. Soil
Sci. Soc. Amer., 56, 275–370.
ISTAT, 1971, 1981 and 1991. Censimento Generale dell’agricoltura.
La Barbera., P., 1990. Problemi di preannuncio di eventi estremi: modelli geomorfo-climatici: meccanica del debris-flow. Rapporto 1988 - Linea 3 del CNR-GNDCI, Genova, 11 pp. Mancini, M., Montaldo, N. and Rosso, R., 1998. Modellistica
distribuita degli eventi di piena in presenza di invasi artificiali nel bacino del Fiume Toce. Atti del XXV Convegno di Idraulica
e Costruzioni Idrauliche, Catania, 2, 237–248.
Marchi, E. and Rubatta, A., 1981. Meccanica dei fluidi, UTET, Torino.
Mishra, S.K., Kumar, S.R. and Singh V.P., 1999. Calibration and validation of a general infiltration model. Hydrol. Process., 13, 1691–1718.
Moore, R.J. and Clarke, R.T., 1983. A distribution function approach to modelling basin sediment yield. J. Hydrol., 65, 239– 257.
Orlandini, S. and Rosso, R., 1996, Diffusion wave modelling of distributed catchment dynamics. J. Hydrol. Eng., ASCE, 1, 103– 113.
Orlandini, S. and Rosso, R., 1998. Parameterization of srteam channel geometry in distributed modelling of catchment dynamics., Water Resour. Res., 34, 1971–1985.
Philip, J.R., 1958. The theory of infiltration. Soil Sci., 85, 333– 337.
Pilotti, M. and Menduni, G., 2001. Beginning of sediment transport of incoherent grains in shallow shear flows. J. Hydraulic Res., IAHR, 39, 115–124.
Ponce, V.M. and Theurer, F.D., 1982, Accuracy criteria in diffusion routing. J.Hydraul. Div.- ASCE, 112, 747–757.
Ponce, V.M. and Yevjevich, V., 1978. Muskingum-Cunge method with variable parameters. J. Hydraul. Div.-ASCE, 104, 1663– 1667.
Provincia Autonoma di Bolzano, 1981. Regolazione dei corsi d’acqua e difesa del suolo: ieri e oggi in provincia di Bolzano, Bolzano.
Provincia Autonoma di Trento, 1999. Le foreste del Trentino, Trento.
Ranzi, R., Bacchi, B., Grossi, G., Buzzi, A., Malguzzi, P., Ratto, C. and Corazza, M., 2000. Previsione di piena mediante un modello meteorologico ad area limitata: alcune esperienze applicative durante l’esperimento M.A.P.-S.O.P. Atti del XXVII
Convegno di Idraulica e Costruzioni Idrauliche, Genova 12-15 settembre 2000, 385-394.
Rumi, G., Mezzanotte, G. and A. Cova (Eds.), 1996. Brescia e il
suo territorio, Milano, 571 pp.
Todini, E., 1996. The ARNO rainfall-runoff model. J. Hydrol.,
175, 339–382.
U.S.Department of Agriculture, Natural Resources Conservation Service, 1986. Urban Hydrology for Small watersheds. Technical Release 55.
Ziemer, R.R., 1981. Storm flow response to road building and partial cutting in small streams of Northern California. Water