HAL Id: hal-03088299
https://hal.archives-ouvertes.fr/hal-03088299
Submitted on 26 Dec 2020
HAL is a multi-disciplinary open access
archive for the deposit and dissemination of sci-entific research documents, whether they are pub-lished or not. The documents may come from teaching and research institutions in France or abroad, or from public or private research centers.
L’archive ouverte pluridisciplinaire HAL, est destinée au dépôt et à la diffusion de documents scientifiques de niveau recherche, publiés ou non, émanant des établissements d’enseignement et de recherche français ou étrangers, des laboratoires publics ou privés.
of isotropic-shaped and rod-like particles tested through
mixer type rheometry
Nadia Sidaoui, Placido Arenas Fernandez, Georges Bossis, Olga Volkova,
Meloussi Mounir, Salah Aguib, Pavel Kuzhir
To cite this version:
Nadia Sidaoui, Placido Arenas Fernandez, Georges Bossis, Olga Volkova, Meloussi Mounir, et al.. Discontinuous shear thickening in concentrated mixtures of isotropic-shaped and rod-like particles tested through mixer type rheometry. Journal of Rheology, American Institute of Physics, 2020, 64 (4), pp.817-836. �10.1122/1.5138994�. �hal-03088299�
Discontinuous shear thickening in concentrated mixtures of isotropic-shaped and rod-like particles tested through mixer type rheometry
N. Sidaoui1, P. Arenas Fernandez2, G. Bossis1, O. Volkova1, M. Meloussi1,3, A. Salah3, and P.Kuzhir1*
1 University Côte d’Azur, CNRS UMR 7010, Institute of Physics of Nice, Parc Valrose 06108 Nice, France
2 University of Granada, Department of Applied Physics, Campus Fuentenueva s/n, Granada, Spain
3 M.B. Boumerdes University, Faculty of Technology, Department of Mechanical Engineering, Dynamic of Engines and Vibroacoustic Laboratory (LDMV), Algeria.
Abstract
In this work, the effect of rigid rods on the discontinuous shear thickening (DST) transition in mixtures of smaller isotropic-shaped (calcium carbonate - CC) and larger rod-like (polyamide or glass) particles dispersed in water is experimentally established. The CC suspension in water is considered as a shear thickening matrix filling the pores of the fiber network. The DST in the matrix originates from the competition between the applied shear stress and the steric repulsion between adsorbed superplasticizer molecules. It is characterized by a typical S-shape of the flow curves, irregular oscillations of the shear rate in response to the applied shear stress and some thixotropy. Addition of rods shifts the DST transition to lower critical shear rates, as explained by an increase of the suspension viscosity such that the shear rate to reach the onset stress of DST decreases. This behavior is satisfactorily reproduced by the reduced shear rate approach of Ohl and Gleissle [J. Rheol. 37, 381-406 (1993)] and to a lesser extent by the homogenization approach of Château et al. [J. Rheol. 52, 489–506 (2008)], both assuming random rod orientation. At fiber volume fractions, f 0.04, the mixture
undergoes jamming which is likely associated to the percolation threshold of the fiber network, nearly independent of the CC particle concentration. This idea is qualitatively supported by modified homogenization approach, assuming that viscous dissipation mostly occurs in the vicinity of the contacts between fibers. The results of this work are believed to be useful for optimal formulations of fiber-reinforced cementitious materials.
I. Introduction
Discontinuous shear thickening (DST) is an abrupt (by orders of magnitude) increase of viscosity above a critical value of the applied shear rate or shear stress. The DST transition is mostly encountered in hard or soft particle suspensions and has been reported in numerous papers – see reviews by Brown and Jaeger [1], Denn et al. [2] and the references therein. Sigmodal (S-)shape of the flow curve measured in controlled shear stress mode and regular or chaotic oscillations of the measured shear rate at a constant applied shear stress above the threshold value c are two macroscopic features reminiscent for the DST transition [3].
Unsteady shear rate response at >c can be accompanied by vorticity banding and particle
migration [2, 4]. In the case of non-Brownian inertialess particle suspensions considered in
the present paper, the DST is commonly admitted to occur as a consequence of a relatively sharp (but continuous) transition between lubricated and frictional contacts between suspended particles with increasing applied shear stress [5-7]. From the microscopic perspective, such a transition can arise when the compressive force between particles (stemming from the applied shear stress) overcomes the repulsive barrier provided by either electric double layer repulsion [8] or steric interactions between polymer brushes adsorbed onto particle surface [9], as has been demonstrated by interparticle force measurements [10]. Furthermore, DST transition is often related to volumetric dilatation of the particle network under shear, even though there might not be one-to-one correspondence between both phenomena, as first demonstrated by Metzner and Whitlock [11]. DST in dilatant suspensions can also be accompanied with flow instabilities, as has been found for the latex microspheres in ethylene glycol at volume fractions larger than 0.5 [12]. It is believed that in confined geometries, the dilatation is frustrated by boundaries and leads to normal forces on them. Above some critical shear stress, these normal forces are assumed to be transmitted through a network of frictional contacts between particles, which dramatically enhance the viscosity level – see the review by Brown and Jaeger [1]. This interpretation seems to join the above scenario of lubrication – to – solid friction transition [6]. Formation of transient particle clusters under shear as a result of competing hydrodynamic and short-range repulsion interactions between particles is another possible mechanism of shear thickening but it usually leads to mild continuous shear thickening (CST) – see review by Wagner and Brady [13], – although, simulations suggest that the CST behavior can be significantly enhanced in confined geometries [14].
The DST fluids are promising candidates for applications in body armor and in adaptive stiffness and damping devices [15]. On the other hand, the DST is an undesirable phenomenon for some other applications, such as casting of composite materials [16] or placing of self-compacting concretes [17, 18], both at high solid particle loadings. In case of fiber-reinforced self-compacting concretes, the presence of fibers usually strongly reduces the fluidity of the composite [19] and is expected to affect the shear thickening behavior [20]. To overcome this technological barrier, a fundamental understanding of the effect of rod-like particles on the DST transition in mixtures of isotropic-shaped and rod-like particles is required. To the best of our knowledge, such an effect has never been reported in literature for these mixtures, and the present paper is focused on the experimental study of this effect.
It has already been shown that adding large spherical particles to a concentrated cornstarch suspension shifts the DST transition to lower shear rates. This can be related to the two following effects: (a) appearance of highly sheared regions between the large particles in which the shear thickening matrix (cornstarch suspension) exhibits local DST transition at lower global shear rates as compared to the cornstarch suspensions without addition of large particles [21]; (b) local enhancement of the cornstarch concentration due to the excluded-volume shell surrounding the large particles [22]. The first effect can be simply seen as follows: the addition of large particles increases the viscosity of the bimodal particle mixture, therefore, the shear rate to reach the onset stress of DST becomes lower, under condition that this stress is independent (or slightly dependent) of the large particle volume fraction. Such
interpretation, particularly relevant for the stress controlled rheology, stems from the seminal work of Ohl and Gleissle [23], who supposed that, at the fixed shear stress, the shear rate in particulate suspension is reduced by a factor equal to the suspension relative viscosity. More recently, this approach has been successfully applied to describe CST in non-Brownian suspensions of spherical or cubic particles dispersed in shear thickening colloidal matrix [24, 25]. These last works report a possibility of the enhancement of CST by local confinements of the colloidal matrix in the spaces between suspended large particles.
In the case of the present study, when large rod-like particles are dispersed in a shear thickening matrix composed of small isotropic-shaped particles dispersed in a Newtonian liquid, we expect similar effects of the rods on the DST of the composite mixture. However, the DST transition is believed to be governed not only by the concentration ratio of the large and small particles but also by orientation state of the rods since it should affect both the local shear rates in the space between rods and the excluded volume and local confinement effects by tuning the size of the pores formed by the rods. From a general perspective, the rheology of shear thickening mixtures of isotropic-shaped and rod-like particles is expected to show behaviors reminiscent for shear thickening fluids and fiber suspensions, especially concerning the effects of the aspect ratio and the fiber orientation distribution on the suspension viscosity – see helpful reviews by Larson [26]; Petrie [27] and Bulter and Snook [28]. It is worth noticing that the DST transition has already been discovered in concentrated suspensions of relatively short (length-to-diameter ratio 1≤L/D≤9) non-Brownian polyethylene glycol rods and has been found to share similar qualitative features with DST in spherical particle suspensions without focusing on the effect of the rod orientation distribution [29].
In the present study, in order to reveal the effect of rods on the behavior of shear thickening mixtures, we use as a shear thickening matrix an aqueous suspension of micron-sized isotropic-shaped calcium carbonate (CC) particles dispersed in water and coated by a comb-like polymer acting as a superplasticizer. Rigid polyamide (PA) or glass fibers are added to the CC suspension at different volume fractions. The choice for the CC suspension is dictated by the facts that (a) it serves as a model for the rheology of cementitious materials (as opposed to other shear thickening fluids) [18] and it would be possible to extrapolate their behavior to the one of cement pastes; (b) its physico-chemistry is well documented [30, 31]; and (c) its DST behavior is well established [32] and understood in terms of the interplay between compressive hydrodynamic and repulsive steric forces [9, 33]. The PA and glass fibers with close aspect ratios L/D (ranging between 40 and 50) but different diameters are chosen to test possible effects of CC particle confinement (within the pores formed by rods) on the DST transition in the composite mixtures. The rheology of the mixture is tested through a mixer type rheometry, which was found to be free of numerous artefacts reminiscent for other geometries and gave the best reproducibility of experimental results. The effect of the volume fraction of rods and CC particles on the DST transition of the mixture is established and interpreted in terms of the concept of the local shear rate and percolation of the fiber network. Finally, two conceptually similar models based on the reduced shear rate approach of Ohl and Gleissle [23] and on homogenization approach of Château et al. [34] are developed with a special attention payed to orientation distribution of
rods. Predictions of these models are finally tested against experiments. In the following Section II, materials and experimental protocols are described in detail. The results are presented and discussed in Section III in a feed-back with existing and newly developed theoretical models. The conclusions and perspectives are outlined in Section IV.
II. Materials and methods
A. Particles, suspensions and suspension preparation
Our aqueous suspensions were composed of calcium carbonate (CC) particles (stabilized by a superplastisizer) and either polyamide (PA) or glass fibers.
CC particles (BL200 from Omya, Switzerland) were characterized in detail in previous works [9, 30]. Briefly, the particles have slightly irregular shape close to rhomboidal one. They have roughly equal sizes in all directions, in this sense they can be referred to as isotropic-shaped particles. The particle size distribution is relatively broad with a number-average and standard deviation of d=5.5±2.0 µm. The particle density and specific surface are respectively 2525 kg/m3 and 0.88 m2/g.
Calibrated PA fibers were purchased from Pinfloc (France) and used without any supplementary treatment. The glass fibers provided by Arkema (France) of initial length of 5 mm were manually milled in a ceramic mortar and seeded through a series of sieves in order to fit the average aspect ratio to that of the PA fibers. Optical microscopy snapshots of the both types of fibers dispersed in deionized water are shown in Fig. S1a and S1b in Supplementary Material [35] and do not reveal strong aggregation of fibers. These snapshots allowed measuring the fiber length distribution [Fig. S1c] and diameter distribution (not shown for brevity). PA and glass fibers exhibit a relatively narrow and a relatively broad length distribution, respectively, while narrow diameter distribution was found for both kinds of fibers. The measured geometrical and some physical (density , Young modulus E) properties are summarized in Table I for both kind of fibers.
Table I. Geometrical and physical properties of fibers
Fibers Mean length L (µm) Mean diameter D (µm) Mean aspect ratio r=L/D Ratio of fiber to CC part. diameter D/d Fiber length to gap ratio L/g Density (kg/m3) Young modulus E (GPa) Effective stiffness S at =100Pa PA 800 17 47 3.1 2.5 1.14 4.56 51 Glass 300 7.5 40 1.4 6.7 2.6 80 1.6103
The fiber rigidity can be evaluated by comparing the threshold stress buck of the
buckling instability with the applied shear stress . The expression for the ratio of both these stresses, called effective stiffness, takes the following form [36, 37]:
4 ln(2 ) 1.2 buck E r S r = , (1)
where r is the fiber length-to-diameter ratio called aspect ratio. Using this formula, we obtain the effective stiffness much larger than unity for both types of fibers (the values of S are reported in Table I) at the maximum applied shear stress =100 Pa in most of experiments. Both types of fibers are therefore considered as rigid.
A polymethacrylate backbone / polyethylene glycol (PEG) side chains comb polymer (59.3 wt % aqueous solution, provided by Chryso, France, and denoted as PCP-45) was used as a superplasticizer. The chemical structure of the polymer is shown in Fig. 3 of the previous paper [9]. The weight average and number average molar masses are respectively 52.7 kg/mol and 21.0 kg/mol (as recently specified by the provider); the average number of monomers per PEG chain is 45.
The suspensions were prepared using the following protocol. First, a CC-particle suspension without rods was prepared with a desired particle volume fraction p defined as
the ratio of the CC solid phase volume Vp to the volume Vm of the CC aqueous suspension in
water: p p m V V = . (2)
To this purpose an appropriate amount of PCP-45 aqueous solution was mixed with deionized water (resistivity of 18.2 Mcm) followed by addition of an appropriate amount of CC powder. Then, the suspensions was stirred for 5 min using a vortex mixer, placed in an ultrasound bath for 5 min, and vortex-stirred again for 5 min. Stirring intensity was fixed to a value slightly below the one provoking DST of the sample, allowing efficient mixing avoiding particle jamming. When using mixer type rheometry, the suspension was directly prepared and stirred in the cylindrical cuvette avoiding, as much as possible, contact with open air and minimizing water evaporation. After stirring/sonication steps, the suspension was stored at 4°C for three hours before starting rheometric experiments. This allowed achievement of thermodynamic equilibrium of different species (polymer, ions). The masses of the three components (water, CC and PCP-45) were chosen to respect the three following conditions: (a) the volume of the CC suspension was fixed to Vm=10 mL and 35 mL for
respectively plate-plate and mixer type rheometry; (b) the CC particle volume fraction p was
fixed to a desired value ranging between 0.6 and 0.68 (or 60 and 68 vol %); and (c) the weight concentration of the dry PCP-45 polymer was 2 mg PCP/g CC. The polymer is expected to be adsorbed to the particle surface by carboxylic groups of the polymethacrylate skeleton, while the ensemble of PEG side chains is expected to form a brush pointing out towards the solvent and thus ensuring steric repulsion between particles, while the surface zeta-potential and Debye screening length are relatively low (11 mV and 7 nm) such that electrostatic repulsion between particles is inefficient [9]. The aforementioned quantity of the added polymer corresponds to the beginning of the plateau of the adsorption isotherm with the number density of PEG chains on the CC particle surface equal to 0.14 nm-2 [30].
Suspension of CC particles with rods, called hereinafter CC-rod mixtures, were prepared by mixing either PA or glass fibers with freshly prepared CC-particle suspension,
followed by the vortex stirring and sonication steps as described above. The prepared mixtures were stored for 3h at 4°C before the measurements. The fiber volume fraction f was
varied in the range 0.01 – 0.04 (or 1 – 4 vol %) being defined as the ratio of the fiber solid phase volume Vf to the whole volume V of the CC-rod mixture:
f f f f m V V V V V = = + . (3) B. Measuring protocols
The shear rheology of CC suspensions and CC-rod mixtures was measured mainly by Anton Paar Physica MCR 301 rheometer using a mixer type geometry and in some cases by Thermo Haake RheoStress 600 rheometer using plate-plate geometry. Sample expulsion from the rheometer gap at the applied stresses above DST threshold, particle sedimentation and water evaporation encountered in plate-plate configuration did not allow reliable and reproducible measurements of the samples containing rods; only CC suspensions without rods using a single stress ramp gave reliable results. On the contrary mixer type configuration was found to be free of the above artefacts thanks to continuous sample mixing and low sample free surface – to volume ratio, at the expense of a complex flow field and stress distribution within the sample, as shown by numerical simulations for Newtonian fluid case [Fig. S2b]. Below, we describe in detail both rheometric tools and associated measurement protocols.
The plate-plate geometry of the RheoStress 600 rheometer is characterized by the upper plate diameter of 60 mm and rheometer gap set to 1.8 mm. To decrease wall slip, a sand paper of an r.m.s. roughness of 40 µm was glued to both rheometer plates. In order to decrease water evaporation, after placing a sample (CC suspension without rods) into the rheometer gap, a home-made water trap (Plexiglas cylinder with wetted washcloth fitted to inner surface of the cylinder) was placed around the upper plate and the temperature at the level of the lower plate was fixed to 14°C by a refrigerated circulating bath. A linearly increasing stress ramp was applied to the sample from a =0 Pa to a =100 Pa with a rate of
the stress increase of 0.33 Pa/s and the measured shear rate was recorded with a sample rate of 2 points per second. Once the maximum stress was achieved, a linearly decreasing stress ramp was applied from a =100 Pa to a =0 Pa at the same rate. In some cases, a second
increasing-decreasing (up-and-down) stress ramp was applied to check how the sample expulsion affected the rheological measurements. Once the flow curves were measured, the imposed apparent shear stress a was converted to the real shear stress using Mooney correction
[38]. This correction was subjected to substantial errors above the DST transition related to the numerical derivation of strongly oscillating a versus dependencies. However it neither
changed the qualitative appearance of the flow curves nor the average amplitude of shear rate oscillations above the DST.
The mixer-type geometry of the Physica MCR 301 rheometer is a stainless steel double helix shown in Fig. S2a, having external and internal diameters of 24 mm and 16 mm respectively, the height of 37 mm, the double helix thickness of 1 mm and the diameter of the central rod of 3 mm. As stated in Sec. II-A, the samples were prepared directly in the brass
cylindrical cuvette of the internal diameter of 29 mm. Before the measurements, the double helix was gently introduced into the cuvette and the latter was placed into the rheometer and the gap of 2 mm was adjusted between the cuvette bottom and the bottom part of the double helix. To avoid wall slip on the inner surface of the cuvette, horizontal and vertical grooves of a width of 0.5 mm and a depth of 0.25 mm were cut on this surface with a period of 0.5 mm. A water trap (wetted washcloth) was placed on the top of the cuvette, the cuvette was thermally isolated from the ambient air and the temperature at the base of the cuvette was adjusted to 14°C by a Peltier element integrated to the rheometer. Increasing-decreasing stress ramps were applied to the sample in a similar way than in the case of plate-plate geometry. Each time at least two up-and-down stress ramps were applied in order to check the effect of possible particle migration on the suspension rheology. To obtain the flow curve from raw rheological data, the applied torque was related to the shear stress and the measured rotational speed of the double helix – to the shear rate using the method proposed by Ait-Kadi et al. [39], as described in detail in Sec. B of Supplementary Material [35]. We warrant the reader that these rheometric conversions are valid for shear thinning power-law rheology but have not been validated for shear thickening rheology. Thus, the shear stress and shear rate measured in the double helix geometry will be hereinafter labeled as “apparent” quantities in all relevant figures but not in the text for the sake of easier reading. Notice also that in a complex flow field, possible extensional components of the rate-of-deformation fields could lead to the alignment of the rods along the extension axis and that lead to significant stress levels; however, this effect is believed to be relatively weak because the viscosity of the suspension of fibers dispersed in a Newtonian solvent perfectly fits to classical shear rheology models, as pointed out in Appendix A, see also Fig. 9. We believe therefore that the proposed rheometric conversions can be used for at least semi-qualitative comparison of rheological response of different bimodal mixtures considered in the present paper.
In some cases, the rheological measurements with double helix geometry were conducted in shear rate-imposed mode [Sec. III-E]. The rate of increase of the shear rate was adjusted to a value ensuring the same rate of increase of the stress in the stress controlled mode. All the measurements with both used geometries were repeated a few times in order to check their reproducibility.
III. Results and discussion
First, we will discuss the rheological behaviors that are qualitatively similar for the CC suspensions with and without fibers. These are sigmodal shape of the flow curve [Sec. III-A] and thixotropic behavior [Sec. III-B]. Then, we will describe the effect of rods on the rheology of the mixtures of isotropic-shaped and rod-like particles, more precisely the effect of the rod-to-particle diameter [Sec. III-C] and rod concentration [Sec. III-D]. After that, the rheological response at imposed shear stress is compared to the response at imposed shear rate in Sec. III-E. On the basis of the experimental findings of Sec. III-A – III-E, we propose in Sec. III-F two conceptually similar models allowing prediction of the flow curves of the rod-isotropic particles mixtures. Finally, jamming behavior above some critical volume fraction of fibers is considered in Sec. III-G.
A. Sigmodal flow curve
Experimental flow curves of the CC suspensions without fibers obtained from the increasing branch of the first stress ramp in double helix geometry are shown in Fig. 1 by dotted lines for four different CC particle volume fractions (p=0.62, 0.64, 0.66 and 0.68). The flow curves of
the samples containing fibers are qualitatively similar to those shown in Fig. 1 and will be discussed in detail in Secs. III-C and III-D. The flow curve of the CC suspension of a particle volume fraction p=0.62 shows a monotonic, stronger than linear increase of the stress with
shear rate, which is a signature of continuous shear thickening (CST). At higher volume fractions p≥0.64, the flow curves have a sigmodal (S-) shape reminiscent to DST with
irregular oscillations above the critical stress. Here, we introduce the critical shear stress c0
and the critical shear rate c0 of the DST as, respectively, the stress and the shear rate at the point where the slope of the flow curve changes from positive one to the negative one, as shown by arrows in Fig. 1. As expected, the critical shear rates decrease with increasing particle volume fraction as it approaches some maximal value, called jamming volume fraction. There exist different possible mechanisms for the DST transition listed in Introduction (Sec. I). Strictly speaking, we cannot directly support any of them without precise microstructural information on the spatial organization of particles within the suspension and on polymer conformation on particle surface affected by the applied stress. In what follows, we briefly discuss on several possible origins of the DST transition in our specific case.
Fig.1. Flow curves of isotropic shaped particle (CC) suspensions at different volume fractions p of CC particles measured for the ascending branch of the 1st stress ramp in mixer type geometry. The arrows show definition of the critical shear rate and shear stress in the stress-controlled rheometry. Labels “apparent” in the titles of axes recall that the reported shear rate and shear stress values stem from approximate rheometric conversions of the raw rheological data [Sec. II-B].
As stated in Introduction (Sec. I), the DST is often believed to arise due to transition between lubricated and frictional inter-particle contacts building percolated contact network of particles as the applied stress increases. Recent measurements on sliding friction between compressed polymer layers adsorbed on the particle surface find a direct correlation between boundary-to-hydrodynamic lubrication transition on the nanoscale and the DST transition at
the macroscopic scale [10]. The macroscopic physics of such a transition is qualitatively captured by the model of Wyart and Cates (WC) [6], which interpolates the suspension rheology between two Newtonian states: the low viscosity state at fully lubricated contacts and high viscosity state at fully frictional contacts. The WC model is detailed in Sec. C. of Supplementary Materials [35], and the fit of the flow curves by this model is shown in Fig. S3. Using different versions of the WC model [33, 40, 41], we did not succeed to reliably fit our flow curves above the critical stress c0. The discrepancy is very likely related to the WC
assumption of the Newtonian rheology in frictional regime. This assumption likely does not apply to our specific system where attractive colloidal interactions could in principle arise above some critical compression of adsorbed polymer layers, as point out below.
From the microscopic perspective, the DST transition could be related to the collapse of the polymer layers on the particle surface as a result of the compression of these layers when increasing applied shear stress pushes neighboring particles together. This scenario has been considered in more details in the previous work [9] and seems to not contradict to the macroscopic picture of the WC frictional transition scenario. Nevertheless the above hypotheses on the origins of the DST need to be checked by microscale measurements. The value of the critical stress 0 related to the polymer layer collapse can be evaluated by balancing the compressive force stemming from the applied shear stress and the repulsive steric force between compressed brushes at critical distance between solid particle surfaces taken to be on the order of equilibrium thickness of the non-deformed polymer layer, ≈5.4 nm. This gives the following scaling behavior [9]:
0
k T nB c3/ 2
d
, (4)
where k TB 410-21 J is the thermal agitation energy at ambient temperature, nc≈0.14 nm-2 is the grafting density of the PEG brushes on the CC particle surface and d≈5.5 µm is the average CC particle diameter [cf. Sec. II-A]. Evaluation gives 2
0 O(10 Pa)
= , which is consistent with the order of magnitude of the critical stress c0 of the DST transition, (see Fig. 1 for graphical definition of c0).
B. Thixotropic behavior
Experimental flow curves of the CC suspensions without fibers obtained from ascending and descending branches of several (up to four) consequent stress ramps. For the sake of brevity, only the ascending branches of the first and the second stress ramps are shown in Fig. 2 for the CC suspension at volume fraction p=0.68 measured in double helix (Fig. 2a) and
plate-plate (Fig. 2b) geometries. Remarkably, the sigmodal shape of the flow curve already disappears at the decreasing branch of the first stress ramp in double helix geometry. After that, increasing and decreasing branches of the second stress ramp collapse on the decreasing branch of the first ramp and distinguishable flow curve hysteresis is no longer observed. The same data collapse without hysteresis is observed for the third and the fourth stress ramps (not shown here). On the contrary, the sigmodal shape is always present in increasing and
decreasing branches of the first, the second and subsequent (not shown here) ramps in the plate-plate geometry but a noticeable and reproducible flow curve hysteresis is observed for each ramp (Fig. 2b).
Since evaporation, particle sedimentation and sample expulsion are minimized in double helix geometry, the change of the flow curve shape from S-like to monotonous one could be associated to the particle migration. In our previous studies [33], we have qualitatively observed particle migration using a high torque rheometer with a large diameter double helix geometry. Removing the double helix rotor from the flow cell, we observed a solid-like coaxial plug confined by the internal face of the double helix, while the rest of the suspension (situated between the double helix rotor and cylinder) showed fluid-like behavior. This observation suggests the particle migration towards the cylinder axis, along the radial direction shown by arrows in Fig. S2b. The suspension experiences lowest shear rates in the central region of the flow cell. Thus our observation seems to be consistent with particle migration towards the regions of small shear rates (and consequently smaller normal stresses), as suggested both by shear-induced and normal-stress induced scenarios [42, 43]. These migration mechanisms do not contradict to the stress controlled rheology or stress-activated percolated network of particles, as long as the coaxial plug can rotate as a solid body together with the double helix being subjected to lower stress levels than those expected in the gap between double helix and external wall. The particle migration changes the concentration and local stress distributions in the double helix geometry and this certainly affects the “effective” flow curve (obtained from the torque versus rotational speed relationship) measured by the rheometer. However, without direct access to concentration distribution and local rheological properties, it is impossible to predict how the effective flow curve changes as a consequence of particle migration.
Fig. 2. Effect of the flow history on the shape of experimental flow curves of the isotropic shape particle (CC) suspensions at CC particle volume fraction p=0.68 measured in mixer type (a) and plate-plate (b) geometries. All the reported flow curves correspond to the ascending branch of either the 1st or the 2nd stress ramp. Flow curves obtained during the 1st ramp in both rheometric geometries are compared in figure (c).
Conservation of the S-shape of the flow curves in plate-plate geometry remains poorly understood. On the one hand, this can point out to insignificant particle migration as typically observed for non-shear thickening suspensions in this specific geometry [44, 45]. On the other
hand, the particle migration could likely induce unsteady locally oscillating vorticity bands in plate-plate geometry [3,4]. Such vorticity banding probably slows down the variation of particle concentration on the scale of the rheometer plate. However, only local concentration measurements under shear can affirm or rule out the above hypotheses.
It is also noticeable that the flow curves measured in both geometries are mainly different in the vicinity of the DST transition which occurs at higher critical shear rates in the plate-plate geometry, as compared to double helix geometry, as is seen in Fig. 2c where increasing branches of the first ramp are compared for p=0.68. However, below the DST
transition increasing branches of the first ramps of the flow curves seem to collapse for both geometries within the statistical error of the measurements. These branches correspond to the beginning of the measurements when the particle concentration is expected to be roughly homogeneous. The same conclusions hold for two other volume fractions p=0.64 and 0.66
exhibiting DST.
In what follows, we will consider the quantitative effects of the rods on the rheology of rod-isotropic particles mixtures starting with the effect of the rod-to-particle diameter ratio. We will consider only the results obtained in mixer type geometry (because the plate-plate geometry generates numerous artefacts in mixtures with rods – see Sec. II-B) and using either increasing branch of the first stress ramp (to access the S-shaped flow curves) or increasing branch of the second ramp (to access monotonic flow curves not showing any hysteresis).
C. Effect of rod-to-particle diameter ratio
The effect of the ratio D/d of the rod diameter D to the CC particle diameter d, can be monitored by comparing the rheology of the mixtures containing PA or glass fibers of different diameters but roughly similar aspect ratio, recalling that both are considered as rigid in the considered stress range according to the evaluation of the effective stiffness [Sec. II-A, Table I]. Physically, the size ratio D/d together with the rod volume fraction f affects the
average size of the pores formed by the fiber network. For the two extreme orientation states of the fibers, the average distance between aligned fibers and the mean pore size of randomly oriented fibers are both roughly equal to
2 f
D
h
, (5)
under the high aspect ratio (r>>1) and low concentration (f<<1) limits [46, 47]. At the
highest rod volume fraction, f=0.03, for which the yield stress is still absent, the ratio h/d of
the average pore size to the CC particle diameter is on the order of 16 for PA fibers and 7 for the glass fibers.
The flow curves of the CC particle- rods mixtures with addition of either PA or glass fibers are presented in Fig. 3 for the CC volume fraction p=0.64 and for different volume
fractions f of rods (including 0 corresponding to the CC suspension without fibers – black
second (Fig. 3b) stress ramps are qualitatively similar to those already reported in Fig. 2a for the suspension without addition of rods. Second, we observe that the flow curves of the suspensions containing PA and glass fibers (respectively, red and blue curves in Fig. 3) are quite close to each other and the difference between them falls into the range of the statistical error arising because of flow instability above DST transition. Such quasi-collapse of flow curves for two types of rigid fibers at nearly similar average aspect ratio (r=47 for PA and
r=40 for glass fibers) is also observed for other fiber volume fractions (not shown here) and
indicates that the DST behavior of CC-rods mixtures is not considerably affected by the pore – to – particle size ratio, at least in the range 7<h/d<16. This result does not support the hypothesis of Cwalina et al. [25] that the shear thickening enhancement by addition of large particles to a shear thickening matrix composed of small particles comes in part from the confinement of small particles in the space between the large ones. Quantitatively, numerical simulations of Bian et al. [14] predict a mild enhancement of shear thickening at h/d=16 (Ly=8
in their paper) but a substantial enhancement at h/d=8, as inferred from Fig. 5 of their paper. This is apparently not the case for our system because the hydrocluster model employed in their simulations is likely less relevant for the DST behavior of our system.
Fig. 3. Effect of the ratio D/d of rod – to CC particle diameter on the experimental flow curves of mixtures of isotropic-shaped (CC) particles and PA fibers (red curves) or glass fibers (blue curves) measured in mixer type geometry for CC particle volume fraction p=0.64 and at different fiber volume fractions f. The D/d ratio is 3.1 for PA fibers and 1.4 for glass fibers. Figures (a) and (b) correspond to the ascending branch of the flow curve during the 1st and the 2nd stress ramps, respectively. The black curves on both graphs stand to the flow curves of CC suspensions without rods.
Since both types of fibers with different size ratios give quantitatively similar behavior, in what follows, we rule out the confinement effects induced by addition of rods and, unless otherwise specified, focus our attention on the behavior of suspensions containing PA fibers.
D. Effect of rods concentration
The flow curves of the CC-PA mixtures measured in double helix geometry are shown in Fig. 4 for three CC volume fractions p and for the ascending branch of the first stress ramp. For
mixtures are presented in Fig. S4, while the flow curves for the both ramps on CC-glass fiber mixtures – in Fig. S5. Thick solid black lines represent predictions of the reduced shear rate (left column in Fig. 4) and the homogenization (right column in Fig. 4) models that will be presented in Sec. III-F. Extensive discussion on the degree of agreement between the models and experiments will also be presented in Sec. III-F.
As is seen in Fig. 4, the flow curves shift to the left with increasing fiber concentration. As a consequence, the critical shear rate c of the DST transition is progressively shifted to lower values, while the critical shear stress c (see Fig. 1 for definition of both c and c) remains roughly constant up to fiber volume fractions
0.02
f
= but increases significantly at f =0.03 for all CC concentrations . The flow p
curve and cshift to lower shear rates points out to enhanced energy dissipation with addition of the rods. As stated in the Introduction (Sec. I), the addition of rods increases the viscosity of the CC-rod mixture, therefore, the shear rate to reach the critical stress of DST becomes lower, provided that this stress is nearly independent of the rod volume fraction at f<0.02.
This shift can also be interpreted in terms of local shear rates, as specified below, keeping in mind that both interpretations are essentially similar and consistent with the stress controlled rheology. In fact, at the fixed shear stress, the local shear rate loc in the shear thickening matrix between rods is by definition higher than the global shear rate (measured by the rheometer through the rotational speed of the double helix tool). The global shear rate in the CC-rod mixture is consequently lower than in the CC suspension without rods at the same applied stress. Applied to the DST threshold, this reasoning stipulates that, if the DST occurs at the same shear stress (at f ≤0.02), it should be shifted to lower global shear rates. A
variation of the critical stress with rod concentration at f >0.02, does not change this
qualitative conclusion. The quantitative dependencies of the critical shear rate and shear stress on the rods concentration will be analyzed in detail in Sec. III-F in comparison with the models.
The increasing branch of the second stress ramp (Fig. S4) gives oscillating but, in average, monotonous flow curves in agreement with the findings of Sec. III-B. Again, the flow curves are shifted to the left when the rods concentration increases. Despite an average monotonic increase of these flow curves, they seem to become very steep at the applied stress on the order of =100 Pa, and the slope increases with the rods concentration. It is therefore important to check whether or not the suspension stress will diverge at some critical shear rate in rheological experiments conducted at controlled shear rate at the second shear rate ramp. In addition to it, the definition of the critical shear rate c and critical shear stress c of the DST at the controlled stress experiment (Fig. 1) is sometimes subjected to uncertainties related to intermittent oscillations of the flow curve below the point where the sign of the flow curve slope changes to negative. It is therefore desirable to get a supplementary definition of c and c in controlled-rate experiments. These two aspects impose a separate study of the rheological response in controlled-rate mode.
Fig. 4. Effect of the fiber volume fraction on the flow curves of the mixtures of isotropic-shaped (CC) particles and PA fibers measured in the mixer type geometry for the ascending branch of the 1st stress ramp at different CC volume fractions. The first, the second and the third rows correspond to the CC volume fraction p=0.64; 0.66 and 0.68, respectively. Experimental flow curves on the left and right columns are identical for the each row. Simulated flow curves using RSR and H-model and assuming isotropic fiber orientation (A1212=1/15) are plotted on the left and right columns, respectively. Thin dashed color curves correspond to experimental flow curves; thick solid black lines – to predictions of both models [Sec. III-F], thick solid green line – to cubic spline interpolation of the experimental flow curve at f =0. Labels “apparent” in the titles of axes recall that the reported shear rate and shear stress values stem from approximate rheometric conversions of the raw rheological data [Sec. II-B]
E. Controlled-rate versus controlled-stress response
Figure 5 compares the flow curves measured at applied shear stress (red curves) and applied shear rate (blue curves) for the suspensions containing PA fibers at volume fraction f=0.02 and CC particles at volume fraction p=0.64 or 0.68. First of all, the rheological
response stemming from the first and the second shear rate ramp (respectively left and right columns of Fig. 5) are qualitatively similar and holds for subsequent ramps (not shown here). In particular, starting from some critical shear rate, the mixture exhibits either strong shear stress oscillations (at p=0.64, Figs. 5a, b) or an abrupt increase above the value of 3000 Pa at
which the rheometer was ordered to stop the measurements (at p=0.68, Fig. 5c, d). Both
these behavior point out to the DST transition in the rate controlled mode observed for the first and the second shear rate ramps. Notice that the controlled-rate experiments allowed only ascending branch of the flow curve because strong stress oscillations above the DST transition caused the rheometer to stop once the maximal allowable stress of 3000 Pa was achieved.
Fig. 5. Effect of the rheometric mode (stress- or rate-controlled) on the experimental flow curves of the mixtures of isotropic (CC) particles and PA fibers measured in the mixer type geometry for PA volume fraction f=0.02 and for the CC particle volume fraction p=0.64 (a, b) and 0.68 (c, d). The left and the right columns of figures correspond to the ascending branches of the flow curve during the 1st and the 2nd stress or rate ramps, respectively. The insets on each graph show the flow curves in extended stress scale. The arrows in (a) and (c) show the definition of the critical shear rate and critical shear stress for the rate-controlled mode.
We define the critical shear rate c and the critical shear stress c for the strain
controlled mode at the point of the first abrupt increase of the shear stress (see arrows in Figs. 5a and 5c), while c and c for the stress controlled mode are defined, as previously, at the point of the change of the sign of the flow curve slope (see arrows in Fig. 1). Interestingly, the flow curves measured in the stress and rate controlled modes coincide at low shear stress/shear rates, below the DST transition, while the critical values c and c seem to rather weakly depend on whether the stress or the rate are imposed. A quantitative analysis of the values c and c as function of CC and fiber concentrations will be presented in Sec. III-F. At
this point, it is important to stress that the Anton Paar Physica MCR301 rheometer is unable to reliably control the shear rate at fast dynamics of the samples. This results to non-vertical fluctuations of the shear stress above DST, as observed in insets of Figs. 5a and b. Even though the stress values above the DST cannot be considered safely, the onset of the DST transition is still reliably measured in the strain controlled mode.
F. Reduced shear rate versus homogenization approach. Comparison with experiments
On the basis of the main experimental findings of Sec. III-C and Sec. III-D, we can now develop models allowing a better and more quantitative understanding of the effect of fiber concentration on the DST transition of the mixtures of rods with isotropic shaped particles. The objective of the models is to predict the flow curve of the CC-rod mixtures on the basis of the experimental flow curves for the CC suspensions without rods.
Assuming a perfect scale separation between CC and rod-like particles, we consider that the rods are dispersed in a shear thickening matrix – aqueous CC suspension – considered as a continuum with the rheology independent of the presence of rods. Independence (within statistical errors) of the flow curves on the rod – to – particle diameter ratio D/d is an argument in favor of the scale separation hypothesis, which however will be revisited in Sec.III-G in conjunction to the jamming behavior. This hypothesis allows us to adapt the reduced shear rate (RSR) approach of Ohl and Gleissle[23] and the homogenization (H) approach of Château et al. [34], both developed for hard spheres dispersed in a non-Newtonian solvent. Both approaches employ essentially similar basic idea that the addition of particles to a non-Newtonian matrix induces higher local shear rates in the matrix at the same stress, and, consequently lower global shear rates in the suspension. Both models determine the local shear rate as function of the relative viscosity r( ) of a suspension of the same solid particles but dispersed in a Newtonian matrix at a given volume fraction . The models mainly differ in the way how these relationships are postulated. Furthermore, in the present case of CC-rod mixtures, the relative shear viscosity is the function of both volume fraction f
and orientation of rods, described by the shear component A1212 of the fourth-order orientation tensor (subscripts “1” and “2” stand for directions along the velocity and velocity gradient); the quantity A1212 is hereinafter called the orientation parameter.
The RSR-model relates the global (“macroscopic”) shear rate ( ) in the suspension to the (“reduced”) shear rate in the matrix m( )= ( , f =0) through a proportionality factor (shift factor) is simply equal to the relative viscosity [23]:
1212 ( ) ( ) ( , ) m r f A = . (6)
The H-model relates ( ) to m( ) through the condition that the energy dissipation in the whole suspension is equal to the energy dissipation in the suspending matrix [34]. This approach initially developed for the rate-controlled rheology is adapted to the present case of the stress-controlled rheology. The details of derivation are provided in Appendix A, and the model predicts the following relationship:
1212 1 ( ) ( ) ( , ) f m loc r f A − = , (7a) 1212 (1 ) ( , ) loc f r f A = − , (7b)
where loc is the local root mean square (RMS) shear stress in the suspending matrix, which is different form the macroscopic stress applied to the suspension boundaries because the applied stress is not uniformly distributed between the solid phase consisting of rigid rods and the suspending matrix. The principle difference between loc and is discussed in detail in Sec. E of Supplementary Materials [35]. The definition of the local shear stress is exact if the rods are dispersed in a Newtonian matrix. Therefore, it is approximately valid for the CC-rods mixtures below the critical stress of the DST transition, i.e. at c, where the matrix (pure CC suspension) shows approximately Newtonian behavior, as inferred from Fig. 1. However, as shown in Appendix B, equation (7b) remains approximately valid for the shear thickening matrix even above the DST transition, at c where the flow curve becomes nearly vertical.
The relative viscosity r( f,A1212) of the suspension of rods dispersed in a Newtonian
matrix (glycerol) was measured in the double helix geometry [Appendix A, Fig. 9]. The concentration behavior of r agrees relatively well with the phenomenological equation of Phan-Thien and Graham [48] [Eq. (A-7)] without adjustable parameters and with the fiber orientation nearly aligned with the flow and corresponding to the orientation parameter
1212 0.011
LH
A , as evaluated by Leal and Hinch model [49] [Eq. (A-8)].
The flow curves of CC-rod mixtures can be constructed in parametric form ( ( ), )
using Eq. (6) for the RSR-model and Eq. (7a) for the H-approach. To plot the flow curves predicted by the RSR model, we proceed as follows. Firstly, we smooth the fluctuations of the experimental flow curves of the CC suspensions (f=0) shown in Fig. 1 using a median
smoothing algorithm. Then, we interpolate the smoothed data by a continuous function ( )
m
using a cubic spline interpolation. Finally, we insert m( ) to Eq. (6) that allows us to construct theoretical flow curves of CC-rod mixtures on the basis of an experimental flow curve of the CC suspension without rods. A similar procedure is used for the H-model, except that the argument in the interpolated function ( ) m should be replaced by loc [Eq. (7b)] in order to get a continuous function m( loc), which is used in Eq. (7a).
As an example, in Fig. 6, we plot experimental and computed flow curves (obtained from the ascending branch of the first stress ramp) of the CC-PA mixture at the CC volume fraction p=0.66 and the rod volume fraction f =0.02. The predictions of the RSR- and
H-models are presented in Figs. 6a and 6b, respectively. In both figures, the thin dashed red curve represents experimental flow curve of the CC suspension without rods at p=0.66 and
the thick black curve is its cubic spline interpolation. The thin dashed blue curve represents the experimental flow curve of the CC-rod mixture, while the thick solid red curve corresponds to the prediction of both models. The simulated flow curves appear to be far from the experimental ones but relatively close to the flow curve of the shear thickening matrix. This indicates that in the present form, both models strongly underestimate the viscous dissipation in the CC-rod mixture.
Fig. 6. Comparison of experimental (thin dashed blue line) and simulated (thick solid red, blue and green lines) flow curves of the mixtures of isotropic (CC) particles and PA fibers for the ascending branch of the 1st stress ramp in the mixer type geometry for PA volume fraction f=0.02 and for the CC particle volume fraction
p=0.66. The predictions of the RSR- and H-models are presented in (a) and (b), respectively. Abbreviations “LH”, “Iso” and “CA” in the figure legend stand for the fiber orientations aligned with the flow (A1212≈0.011), random (A1212=1/15) and aligned along the compression axis (A1212=1/4), respectively. Thin dashed red and thick black solid curves are respectively experimental flow curve at f=0, p=0.66 and its cubic spline interpolation. The shaded region in (a) and (b) corresponds to the domain between the lower and upper bounds of the prediction of each model.
The most intuitive reason for this discrepancy is that the orientation distribution of the rods in the shear-thickening matrix is likely very different from the nearly aligned state observed in the Newtonian matrix (like in our experiments with PA fibers suspended in glycerol, cf. Fig. 9) and described by Eq. (A-8). It is highly possible that the formation of
transient clusters of CC particles below DST and the flow instability above DST strongly affect fiber dynamics and induce more isotropic fiber orientation. In the same vein, the network of frictional contacts between CC particles can make the rods aligned along the main axis of this network, which is the compression axis of the shear flow, making the angle -/4 with the flow direction [5]. The orientation parameter A1212 takes the following values for these two particular cases: 1212Iso 1/15
A = and 1212CA 1/ 4
A = , where superscripts “Iso” and “CA” stand for “isotropic” and “compression axis”. The orientation state along the compression axis will be hereinafter denoted by CA-orientation for brevity.
To take into account a correct orientation distribution of rods in shear-thickening matrix, an appropriate value of A1212 should be used in Eq. (A-7) for the relative viscosity
1212
( , )
r f f A
= , while computing the CC-rod flow curve. The simulated flow curves of the CC-rod mixture corresponding to both isotropic and CA orientation of rods are added to Figs. 6a and b by thick solid blue and green lines, respectively. The flow-aligned orientation provides the lowest relative viscosity r and predicts the smallest shift of the flow curve with addition of rods (thick solid red line), while the CA-orientation provides the highest relative viscosity and the largest flow curve shift (thick solid green line). If the models are correct, the experimental flow curve (thin dashed blue line) should fit into the shaded space between lower and upper bounds of the models corresponding to the two limiting simulated flow curves. This is the case for the RSR-model but not completely true for the H-model (for which the experimental flow curve leaves the shaded region at intermediate stresses), at least for the particular set of volume fractions (p=0.66 and f=0.02) of the data presented in Fig. 6.
To ensure the best agreement between the models and experiments, it would be possible to fit the experimental flow curves by adjusting the orientation parameter A1212values in Eq. (A-7) for the relative viscosity r( f,A1212). However, we prefer comparing
experimental flow curves with the model flow curves all calculated for a single fixed and physically relevant value of the orientation parameter, A1212= A1212Iso =1/15, corresponding to random fiber orientation, without necessity of any adjustable parameter. All the experimental flow curves of the CC-PA fiber mixtures shown in Fig. 4 and Fig. S4 are compared with the simulated ones (solid black lines), using the RSR-model (left columns) and the H-model (right columns). Thick solid green lines fitted to the experimental black flow curves of pure CC suspensions stand for the cubic spline interpolation. The qualitative difference between predictions of both models is that the RSR-model leads to the same critical shear stress of the DST transition independently of the volume fraction of rods, which is mainly supported by experiments for fiber volume fractions up to 0.02. In general, the RSR-model agrees better with experiments than the H-model at f ≤0.02. However, at higher volume fraction, f =0.03
it fails to predict substantial increase of the critical shear stress with respect to the one of the shear thickening matrix, while the H-model capture this increase, at least qualitatively. Furthermore, at each particle and rod concentrations, the H-model provides better prediction of the monotonously growing flow curves measured at the 2nd stress ramp [Fig. S4].
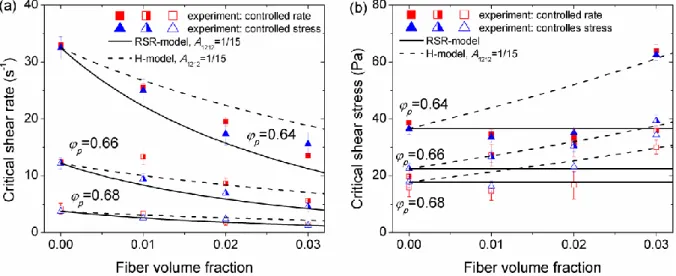
Let us now focus on the critical values of the shear stress and shear rate at the DST transition. Let c0 and c0 – critical shear stress and shear rate of the CC suspension without rods. The critical value of c for both models is obtained from Eqs. (6) and (7a) by replacing
by c and m by c0. The critical shear stress for the RSR-model is equal to that of the shear thickening matrix, since this model postulates only a horizontal shift of the flow curves. The critical shear stress for the H-model is obtained from Eq. (7b) by expressing the applied global stress through the local stress loc and then replacing loc by c0, and
by c. The final set of expressions covering both models read:0 1212 0 1212 / ( , ), for RSR-model; (1 ) / ( , ), for H-model; c r f c c f r f A A = − (8a) 0 0 1212 , for RSR-model; (1 ) ( , ), for H-model. c c c f r f A = − (8b)
Thus, using the last two equations, the values of c and c can be calculated as function of the rod volume fraction using experimental values of f c0 and c0 obtained from controlled stress [Sec. III-A] or controlled strain [Sec. III-D] experiments on pure CC suspensions for a given CC volume fraction . Simulated and experimental dependencies p
( )
c f
and are shown in Figs. 7a and 7b, respectively. Triangles and squares c( f)
correspond to experimental values on CC-PA suspensions measured for the ascending branch of the 1st ramp in stress controlled mode [Fig. 4] and strain controlled mode [Fig. 5], respectively. Continuous and dashed black lines correspond to the prediction of the RSR- and H-models, respectively, for a single value of the orientation parameter 1212 1212Iso 1/15
A = A =
corresponding to the isotropic rod orientation.
Firstly, a relatively good agreement, within the experimental statistical errors, is observed between two experimental modes of definition of the critical values c and . c Secondly, the RSR and H-models give reasonable agreement with experimental values of the critical shear rate. The RSR-model systematically underestimates experimental c values and the H-model overestimates them. As already mentioned, the RSR-model reproduces the independence of the critical stress on the fiber volume fraction at f≤0.02, while the H-model
predicts a continuous growth of c with f because it differentiate the average stress in the
suspending matrix (local stress loc) from the macroscopic applied stress and shifts the flow curves both vertically and horizontally, as clearly seen on the right column of Fig. 4. However this trend reverses at the highest considered fiber volume fraction f =0.03 for which the experimental values of c are noticeably larger that the corresponding values c0 in the absence of fibers. The H-model seems to follow this increase, while the RSR-model is unable to capture it. The discrepancy between experiments and RSR-model becomes more
dramatic at higher volume fractions, f 0.03, for which we observe the behaviors
qualitatively different from those reported above. They cannot be reproduced at all by the RSR-model and need a separate analysis.
Fig. 7. Simulated and experimental dependencies of the critical shear rate (a) and the critical shear stress (b) of the DST transition on the rod volume fraction. Experimental data are drawn from the ascending branch of the 1st ramp of CC-PA mixtures, measured in stress controlled (triangles) and strain controlled (squares) modes. Continuous and dashed black lines correspond to the prediction of the RSR- and H-models, respectively, for the isotropic orientation distribution in all mixtures (A1212=1/15). The error bars correspond to the standard deviation of a few measurements realized for each given value of p and f.
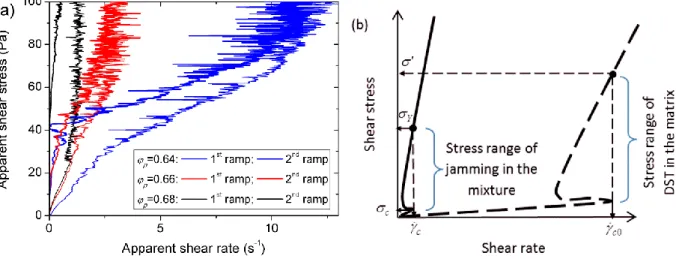
G. Jamming behavior
Experimental flow curves of the CC-PA mixtures at fiber volume fraction f =0.035 and at
different CC particle volume fractions p are shown in Fig. 8a for the ascending branch of the
1st (thin lines) and the 2nd (thick lines) stress ramps. During the 1st ramp, the flow curves show decreasing slope with increasing stress reminiscent to a shear thinning behavior (except for p=0.68), followed by an increasing slope with oscillations (shear thickening). The 2nd ramp
is characterized by a threshold stress below which the mixture does not flow, referred to as a yield stress, and by stronger fluctuations above the yield stress as compared to the flow curve fluctuations of the 1st ramp. The subsequent stress ramps show the similar behavior to that of the 2nd ramp. As stated in Sec. III-B, the difference in behaviors of the 1st and the 2nd stress ramps could be attributed to CC particle migration which changes the rheology on local scale. Notice that, at the fiber volume fraction above f ≥0.04, it was impossible to make the CC-PA
mixtures flow below the maximal achievable stress =3000Pa in our experiments with mixer type geometry. This indicates a jamming transition of the CC-PA mixtures at a critical fiber concentration f ≈0.04 independent of the CC particle concentration within the range
0.64≤p≤0.68 at which the shear thickening matrix (CC suspension alone) exhibits the DST
transition. It is therefore believed that the combination of the yield stress and shear thickening at f =0.035 reflects a transient behavior between purely shear thickening behavior at f ≤0.03
and jamming behavior at f ≥0.04. Notice that the term “jamming transition” should not be
liquid-solid transition at any small applied stress for particle concentrations near the compaction limit, while the second one is related to the liquid-solid transition above some non-zero critical stress at concentrations that can be well below the compaction limit.
Fig. 8. Experimental flow curves of the CC-PA mixtures at fiber volume fraction =f 0.035 and at different CC particle volume fractions p for the ascending branch of the 1st (thin lines) and the 2nd (thick lines) stress ramps (a). To explain jamming behavior of the CC-rod mixtures at the rod volume fractions f 0.04, a hypothetical flow curve of the CC-rod mixture is schematically presented in (b) by a solid line. The flow curve of the pure CC suspension at the same CC volume fraction is schematically presented by a dashed line in (b). The critical shear rate c in the concentrated CC-PA mixture is evaluated to be much lower than that, c0, in the pure CC suspension; while the yield stress Y [Eq. (D-5)] of the CC-PA mixture is related to a specific value of the local stress in the gap between fibers, tentatively assigned to the upper critical stress ' of the DST transition in pure CC suspension.
At this point, we try to find a physical mechanism for the jamming behavior at f
≥0.04. First, the jamming in a bimodal mixture of particles can simply occur due to a compaction limit imposed by geometrical constraints. Second, since the perfect scale separation between CC particles and PA fibers is not really fulfilled (even though confinement effects seem to be ruled out – cf. Sec. III-C), the jamming could arise as a result of excluded volume effects, as suggested by Madraki et al. [22] for bidisperse mixtures of spheres. These two effects are analyzed in detail in Appendix C. It is shown that the two scenarios predict that the jamming of the mixture strongly depends both on the particle volume fraction p and on the fiber volume fraction f , while in experiments it only depends
on f and independent of p within the range 0.64≤p≤0.68. The jamming scenario respecting
this experimental condition is related to the percolation threshold of the fiber network, which, to the first approximation, is expected to be independent of p.
In more detail, when the fiber concentration achieves the percolation threshold perc,
the force applied at the boundary is transmitted through the small gaps between rods (filled with shear thickening matrix). Due to small effective volumes of these gaps, and their small density in the suspensions of rods as compared to spheres, the local stress in these gaps is expected to be much higher than the global (macroscopic) applied stress, as typically observed for the force chains in granular media [50]. Consequently, the shear thickening