HAL Id: hal-02321367
https://hal.sorbonne-universite.fr/hal-02321367
Submitted on 21 Oct 2019
HAL is a multi-disciplinary open access
archive for the deposit and dissemination of
sci-entific research documents, whether they are
pub-lished or not. The documents may come from
teaching and research institutions in France or
abroad, or from public or private research centers.
L’archive ouverte pluridisciplinaire HAL, est
destinée au dépôt et à la diffusion de documents
scientifiques de niveau recherche, publiés ou non,
émanant des établissements d’enseignement et de
recherche français ou étrangers, des laboratoires
publics ou privés.
public transport generates walking
Basile Chaix, Tarik Benmarhnia, Yan Kestens, Ruben Brondeel, Camille
Perchoux, Philippe Gerber, Dustin Duncan
To cite this version:
Basile Chaix, Tarik Benmarhnia, Yan Kestens, Ruben Brondeel, Camille Perchoux, et al.. Combining
sensor tracking with a GPS-based mobility survey to better measure physical activity in trips: public
transport generates walking. International Journal of Behavioral Nutrition and Physical Activity,
BioMed Central, 2019, 16 (1), pp.84. �10.1186/s12966-019-0841-2�. �hal-02321367�
R E S E A R C H
Open Access
Combining sensor tracking with a
GPS-based mobility survey to better measure
physical activity in trips: public transport
generates walking
Basile Chaix
1*, Tarik Benmarhnia
2, Yan Kestens
3,4, Ruben Brondeel
3,4, Camille Perchoux
5, Philippe Gerber
5and
Dustin T. Duncan
6Abstract
Background: Policymakers need accurate data to develop efficient interventions to promote transport physical activity. Given the imprecise assessment of physical activity in trips, our aim was to illustrate novel advances in the measurement of walking in trips, including in trips incorporating non-walking modes.
Methods: We used data of 285 participants (RECORD MultiSensor Study, 2013–2015, Paris region) who carried GPS receivers and accelerometers over 7 days and underwent a phone-administered web mobility survey on the basis of algorithm-processed GPS data. With this mobility survey, we decomposed trips into unimodal trip stages with their start/end times, validated information on travel modes, and manually complemented and cleaned GPS tracks. This strategy enabled to quantify walking in trips with different modes with two alternative metrics: distance walked and accelerometry-derived number of steps taken.
Results: Compared with GPS-based mobility survey data, algorithm-only processed GPS data indicated that the median distance covered by participants per day was 25.3 km (rather than 23.4 km); correctly identified transport time vs. time at visited places in 72.7% of time; and correctly identified the transport mode in 67% of time (and only in 55% of time for public transport). The 285 participants provided data for 8983 trips (21,163 segments of observation). Participants spent a median of 7.0% of their total time in trips. The median distance walked per trip was 0.40 km for entirely walked trips and 0.85 km for public transport trips (the median number of accelerometer steps were 425 and 1352 in the corresponding trips). Overall, 33.8% of the total distance walked in trips and 37.3% of the accelerometer steps in trips were accumulated during public transport trips. Residents of the far suburbs cumulated a 1.7 times lower distance walked per day and a 1.6 times lower number of steps during trips per 8 h of wear time than residents of the Paris core city.
Conclusions: Our approach complementing GPS and accelerometer tracking with a GPS-based mobility survey substantially improved transport mode detection. Our findings suggest that promoting public transport use should be one of the cornerstones of policies to promote physical activity.
Keywords: Accelerometry, Global positioning system, Public transport, Transport, Walking
© The Author(s). 2019 Open Access This article is distributed under the terms of the Creative Commons Attribution 4.0 International License (http://creativecommons.org/licenses/by/4.0/), which permits unrestricted use, distribution, and reproduction in any medium, provided you give appropriate credit to the original author(s) and the source, provide a link to the Creative Commons license, and indicate if changes were made. The Creative Commons Public Domain Dedication waiver (http://creativecommons.org/publicdomain/zero/1.0/) applies to the data made available in this article, unless otherwise stated.
* Correspondence:basile.chaix@iplesp.upmc.fr
1Sorbonne Université, INSERM, Institut Pierre Louis d’Epidémiologie et de
Santé Publique IPLESP, Nemesis team, Faculté de Médecine Saint-Antoine, 27 rue Chaligny, 75012 Paris, France
Background
The public health community is engaged in the promo-tion of physical activity [1, 2]. A key strategy is to pro-mote active travel modes such as walking. However, walking is often unrealistic in longer trips. As increasing evidence suggests that public transport promotes walk-ing [3,4], a complementary strategy is to develop public transport as an alternative to private motorized vehicles.
The assessment of walking and physical activity in trips remains imprecise in studies, especially in trips combining walking with other modes. Previous studies, for example, have reported an increase in daily physical activity on days where public transport was used [5], which is an imprecise quantification that lacks informa-tion on the time spent in public transport trips on these days and on the exact related physical activity. Other studies have assessed physical activity in trips that were manually identified from GPS data for a restricted num-ber of trips (e.g., home-school trips [6] or home-work trips [7]), lacking an overall picture of physical activity in trips. A third group of studies have automatically detected trips with algorithms but had no information on travel modes [8]. Finally, some studies automatically detected trips and travel modes with algorithms, but did not confirm the travel mode information with partici-pants, so the resulting information might be unreliable and lack details on travel modes (e.g., two-wheel vs. four-wheel vehicle, or private vs. public transport ve-hicle). However, it is crucial to derive accurate data on the physical activity in trips with different travel modes, for example to provide policymakers with accurate quantitative evidence on the physical activity benefits of public transport use or as input data for subse-quent modeling of the population-level impacts on physical activity of scenarios of mode shift and transport policies [3, 9, 10].
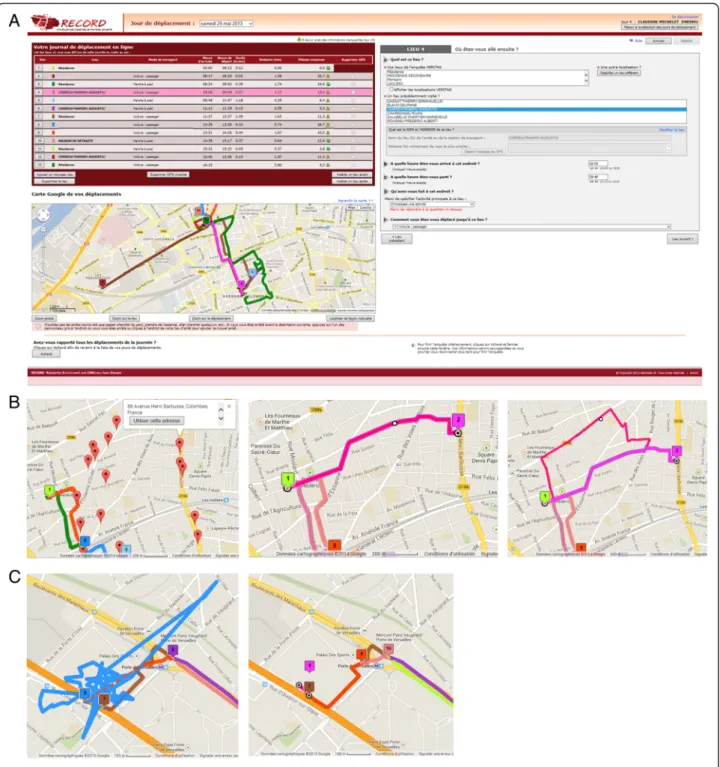
The present work develops novel technologies for the measurement of physical activity in trips. As illustrated in Fig. 1, we propose a novel GPS-based mobility survey strategy, improved compared to our previous work [3, 11], that decomposes trips into trip stages, cleans GPS tracks, and permits the accurate assessment of walking in trips. Table 1 refers to in-cremental levels of methodology (GPS tracking, accel-erometry, mobility survey, decomposition of trips into stages, and full edition of GPS tracks) and indicates the analytical opportunities offered at each level.
The methodological aim of this study was to provide information on the accuracy gains offered by this mobility survey, comparing the resulting travel distance and transport mode information to that obtained through the sole algorithm-based processing of GPS data (without mobility survey). Regarding empirical aims, using two alternative metrics (distance walked from GPS
and mobility survey and number of steps taken from accelerometry), (i) we compared the amount of walking in trips with different modes, e.g. in entirely walked trips, car trips, and public transport trips; and (ii) we quantified the overall contribution to transport walking of trips with different modes, including public transport.
Methods
Data collection and processing Population
Participants came from the RECORD MultiSensor Study [12] of the RECORD Cohort [13–17]. The RECORD MultiSensor Study combined various sensor tools (in-cluding a GPS receiver, a waist-worn accelerometer and in subgroups two thigh-worn and chest-worn accelerom-eters, a cardiac holter, a blood pressure monitor, and a smartphone for ecological momentary assessment) to investigate various aspects of the relationship between transport and health. Participants of the RECORD Co-hort were born between 1928 and 1978, were residing at baseline in 10 districts of Paris and 111 other municipal-ities of the Ile-de-France region, and were recruited without a priori sampling during preventive checkups performed by the IPC Medical Centre.
During the second wave of the RECORD Study, be-tween September 2013 and June 2015, after completing their health checkups, participants were systematically invited to enter the RECORD MultiSensor Study (ap-proved by the French Data Protection Authority) when there were devices available for the recruitment. Of the 919 persons invited to enter the MultiSensor study, 319 accepted to participate and signed an informed consent form. Twenty-seven participants withdrew from the study and the data collection failed for 6 participants, resulting in a final acceptation and completion rate of 31.1% (N = 286). Comparison of the RECORD participants who took part in the MultiSensor Study with those who were invited but refused to participate or abandoned showed that the likelihood to participate was twice lower among participants with a primary education or less than among those with an upper tertiary education. One par-ticipant who travelled to meet different family members out of the Ile-de-France region during the follow-up was excluded from this analysis (N = 285).
Collection and processing of GPS, mobility survey, and accelerometer data
Participants wore a QStarz (Taipei, Taiwan)
BT-Q1000XT GPS receiver [18] and an Actigraph
(Pensacola, FL) wGT3X+ tri-axial accelerometer [19] on the right hip for the recruitment day and 7 additional days. Participants completed a travel diary on the places visited, as supporting information for the mobility survey.
The GPS data (one point every 5 s) were uploaded in the TripBuilder Web mapping application where GPS data were processed with algorithms (Fig. 1) [20, 21]. These algorithms (i) identified the places visited by the
participants over 7 days; (ii) decomposed the trips be-tween visited places into segments of trips with unique modes; (iii) imputed information on the activities per-formed in each place based on the geolocated regular
Fig. 1 Screenshots of TripBuilder Web used for the GPS-based mobility survey in the RECORD MultiSensor Study. Panel a: Main screen of the application (top left: succession of places and points of change of travel mode visited; bottom left: map of trips; right: panel for the identification of places and characterization of places and modes). Panel b: A trip was not detected as the GPS receiver was left at home. The visited place was searched in the mobility survey application (first picture). When the adequate place was selected, the shortest trip to the place was generated (second picture). The trip itinerary was then manually edited (third picture). Panel c: The residual artefact in the GPS track persisting after the automatic cleaning (first picture) was manually removed during the mobility survey (second picture). The data shown in the Figure are not real participant data but data generated by the research staff
visited places of each participant pre-identified with the VERITAS application [22] and on geolocated points of interest; and (iv) imputed information on the travel mode used in each trip segment based on speeds, survey infor-mation on typical modes used by the participant, and on the presence of public transport stations of the same line or mode at the beginning and end of the trip segment.
Based on the TripBuilder Web application, a
GPS-based mobility survey was conducted through a
telephone interview as soon as possible after the data collection (median time of 10 days, interquartile range: 7, 15). Only the research assistants had access to the ap-plication described in Fig. 1, while participants had ac-cess to detailed screen copies of their trips sent by postal
mail. Using these computer and paper supports, the re-search assistants walked the participants through the dif-ferent days, reviewing and complementing information trip by trip. The research assistants confirmed the de-tected visits to places and trips between these places; they removed visits to places and trips that were in-correct; they could generate visits to places or trips to places undetected by the GPS receiver and/or algo-rithm (with itineraries then imputed as the shortest street network path and edited if needed, see Fig. 1). The research assistants manually edited each trip itinerary, if needed, to remove residual artefacts in the GPS track that would bias the assessment of the travel distance (Fig. 1). Finally, research assistants
Table 1 Comparison of our improved measurement of physical activity in trips to existing measurement approaches Methodology Added information Applications
Global and retrospective questionnaire assessment of transport activity (trips, modes)
- Studies of residential characteristics and qualitative outcomes on mode choice + GPS data collection & algorithm
processinga - Objective and accurate data on trips andplaces visited (timestamped start and end
times of segments, itineraries) instead of self-reported data
- Unreliable data on transport modes
- Environmental exposures in daily path areas - Route choice analysis
- Analyses focusing on aggregated groups of modes (e.g., motorized transport) and indicators of transport activity aggregated at the participant level (rather than trip-level information)
+ accelerometry & algorithm
processinga - Objective information on physical activityin trips - Participant-level analyses of environmentalexposures, transport mode profiles, and
physical activity (one observation per participant)
+ GPS-based mobility surveyb - Improved accuracy through the
confirmation of places visited, trips made, and modes used
- Added information on activities at places, social contacts, mood in trips, etc.
- Analyses of environments, transport modes, and physical activity disaggregated at the trip level, with reliable mode information
- Individual-level or trip-level analyses of determinants of visiting particular places (a sport facility, a fast-food restaurant, etc.) corrected from the selective daily mobility bias
- Analyses involving additional determinants, confounders, or outcomes collected at the trip level
+ spatial/temporal segmentation of trips into trip stages (algorithms + survey)c
- Validated information on timestamps and locations for transitions between unimodal trip stages and transfer stages between modes
- Refined analyses of transport mode used accounting for durations spent in the different modes
- Analyses of sensor-measured physical activity and personal environmental exposures (noise, air pollutants) by transport modes and during transfer stages between modes
- Calculation of exposures to geographic environments by transport modes using geographic information systems + manual edition of GPS itineraries
(deletion and completion)c - Accurate itineraries associated with eachtrip stage without artefacts - Analyses of distances covered with eachtransport mode
- Refined calculation of exposures to geographic environments using geographic information systems
a
Most studies using GPS and accelerometer data in public health have reached this level b
Our previous studies in the field [3,11] have emphasized the benefits of this approach c
confirmed or collected and modified the type of activ-ity practiced at each visited place and the travel mode used in each trip segment.
A SAS program generated a detailed timetable over 7 days indicating the succession of places visited and trips subdivided in trip stages. Within a trip, two trip stages are necessarily separated by an episode of transfer be-tween the two assigned to a punctual location. These transfer episodes coded with a spatial point in the mobil-ity survey typically last from 0 min to several minutes and correspond to no walking at all, walking few meters outdoor, or walking indoor, e.g., within a train or metro station (but these punctual transfer episodes cannot imply movement with any other mode). A transfer be-tween two trip stages by bus would be coded as a walk-ing trip stage if there was a detectable walkwalk-ing track between them, but would be coded as a punctual loca-tion if the two buses were few meters apart outdoor. Start/end times are available for each visited place, trip, trip stage, and episode of transfer between trip stages.
Due to costs, the mobility survey was only performed on days (i) where there was GPS data and (ii) where the additional sensors (VitaMove system, Zephyr BioPatch, etc.) employed in this study were worn by the partici-pants. On those days, the mobility survey was systemat-ically performed for the whole day, even if GPS data were partly missing. In the latter case, missing portions of itineraries were complemented during the mobility survey, so that the day had full distance information. On the opposite, if the two conditions above were not satis-fied, the whole day was excluded. The study data com-prised 1784 days of mobility survey for 285 participants, corresponding to a median of 7 days of follow-up per in-dividual (interdecile range: 4, 7) (i.e., 285 × 7–1784 = 211 days were excluded due to the aforementioned reason).
Choi default parameters applied to vector magnitude data as implemented in ActiLife 6.11.9 were used to iden-tify episodes of nonwear of the accelerometer [23, 24]. Trips that overlapped a nonwear period were flagged. The number of steps was estimated by ActiLife for each epoch.
Measures
Classification of trips
Mobility surveys mostly cover movement between desti-nations coded as street addresses, but they do not assess movement within the home garden or within an under-ground transport station. Each trip between two visited places (from a street address to a street address) comprises one or several trip stages (segments of trip with a unique mode). A fully unimodal biking trip is possible if the bike is taken from the departure place to the destination with-out any walking in the street. A fully unimodal car trip is also possible if parkings are available at the departure
place and destination, but if the car is parked in the street, then it would be a multimodal car and walking trip.
Based on the travel mode in each trip stage, a crude and a detailed classifications of trips were defined as fol-lows among trips with a unique mode or with a unique mode in addition to walking. The cruder version of the variable distinguished: entirely walked trips; biking or use of rollers or of a skateboard (“other active modes”); public transport; personal motorized vehicle; and other (long distance train and plane, i.e., non-local trips). A more detailed classification subdivided public transport into: bus/coach; metro (available in Paris and immediate surroundings); RER (fast trains traveling through Paris and the suburbs), train, or TER (trains from Paris towards suburbs or adjacent regions) (referred to below as subur-ban trains); and tramway. Personal motorized vehicle was subdivided into driving a personal motorized vehicle and being a passenger of a personal motorized vehicle (includ-ing taxi). In either the crude or the detailed classification, trips that comprised two stages or more with different non-walking modes (as defined in the corresponding clas-sification) were labeled as multi-mode trips.
Distance walked
We were able to calculate accurate walked and non-walked distances because the GPS tracks were carefully edited and cleaned and because missing trips or trip segments were recreated during the phone mobility survey in our web mapping application. The walked or nonwalked distance covered in each trip stage was the length of the corresponding polyline. By definition, there is no distance related to the episodes of change of mode within trips, as they are represented as point locations. For calculation purposes, we also aggregated the walked and nonwalked distances at the trip level.
A first definition of the intensity of walking in a walked segment was the average speed of walking in km/h.
Accelerometer-assessed steps
The accelerometer-assessed number of steps taken was aggregated for each trip stage and also for episodes of transfer between trip stages, according to the start/end times of each segment.
A second definition of the intensity of walking (in walked trips or trip stages) was the number of accelerometer steps taken per min.
Sociodemographic and geographic covariates
Age was used as a continuous variable. Education was coded in 4 categories: no education, primary education, or lower secondary education; higher secondary educa-tion and lower tertiary educaeduca-tion; intermediate tertiary education; and upper tertiary education. Employment status was categorized in 4 classes: stable job; unstable
and precarious job; unemployed; and other. The urbani-city degree of the area of residence was assessed with a 3-category variable: Paris; close suburb (first circle of counties adjacent to Paris); and far suburb (second circle of counties non-adjacent to Paris). Two participants who were in an alternative residence all over the observation period were assigned to the geographic location of this alternative residence within the Ile-de-France region.
Statistical analysis Analytical sample
The initial timetable for 285 participants comprised 31,115 segments of observation (either trip stages, episodes of transfer of mode, or places visited), corresponding to 9046 trips and 9369 (non-unique) places visited. We excluded from this timetable the episodes at the places visited, yielding a sample of trips (21,354 segments of observation, either trip stages or episodes of transfer).
The analyses excluded certain trip stages or segments of trips corresponding to non-trip movement. First, for sequences of movement over space between two places visited that included a reported segment by skiing or chairlift, the whole sequence of movement was deleted [n = 95 segments of observations (trip stages or episodes of transfer) corresponding to 5 trips]. Second, for sequences of movement over space that included a reported segment of jogging or walking a dog, only the corresponding segment was excluded together with the eventually preceding or subsequent short episodes of transfer (change of mode) (n = 96 segments of observa-tion), but trip stages with other modes within the trip were not deleted (e.g., driving or walking before or after the jogging episode itself). We did not exclude non-local trip stages with long distance trains (n = 15 trip stages) or planes (n = 4 trip stages), as they pertain to transport contrary to skiing, jogging, or walking a dog. The final sample comprised 8983 trips, corresponding to 21,163 segments of observation.
To analyze the accelerometer-derived number of steps, we further excluded a participant for whom the accelerometry follow-up did not work (n = 34 trips) and trips that overlapped a period of nonwear of the acceler-ometer (n = 221) (exclusion was made at the trip level even if there was nonwear only in some stages of the trip). The sample for analyzing accelerometry comprised 284 participants with 8728 trips corresponding to 20,564 segments of observation.
Quantification of accuracy gains from the mobility survey
To compare our approach combining GPS tracking and a mobility survey with the simpler approach only relying on GPS tracking and processing algorithms, first, we compared the estimated total distance covered per day by participants over the follow-up, as assessed in 3
different ways: (i) with the almost raw GPS data [i.e., the GPS data after the sole exclusion of GPS points that were below the speed limit of 1 km/h, as specified in the published algorithm on which we rely [20, 21]; (ii) with the trip distances calculated after the identification of places visited and trips between them through automatic algorithms [20, 21]; and (iii) with the trip distances de-termined after the manual edition and complementation of GPS tracks through the mobility survey.
Second, we compared data on transport modes auto-matically identified with algorithms from the GPS data [20, 21] to the transport mode data on the same set of trips derived from the full GPS-based mobility survey (i.e., eventually corrected during the survey). We report the percentage of time over which the two sources of mode information agree, overall and by transport modes.
Analysis of walking distance and number of steps taken
Sociodemographic characteristics were only used for the description of the sample. The distance walked and the accelerometer-assessed number of steps per trip were tabulated according to the main travel mode in the trip (crude and detailed classifications). Differences accord-ing to the mode used were tested with the Kruskal-Wallis test. We calculated the percentage of the overall distance walked and accelerometer-assessed steps that were covered in each type of trip according to the crude and detailed classification of modes at the trip level.
Results
Quantification of accuracy gains from the mobility survey
From the quasi-raw GPS data, the median distance cov-ered by participant per day was of 39.3 km (interdecile range: 16.9, 98.4 km). From the algorithm-based trip dis-tances (uncorrected through the mobility survey), this median distance was of 25.3 km (interdecile range: 8.7, 78.2 km). Finally, when considering the GPS-based mobility survey data, the distance covered by participant per day was reduced to a median of 23.4 km (interdecile range: 7.5, 77.6 km).
Of the time spent in transport as assessed from the GPS-based mobility survey, 72.7% was also identified as corresponding to transport with the algorithm (and re-ciprocally, 75.7% of the algorithm-based transport time was confirmed as transport time through the mobility survey). Among segments identified as transport with both the algorithm and the mobility survey (over a cu-mulated period of 86 days, 3 h and 59 min), the transport mode was correctly assessed by the algorithm processing of GPS data for 67% of the time (compared to the GPS-based mobility survey as our gold standard). When stratified by transport mode, the mode was correctly identified by the algorithm for 68% of time for personal
motorized vehicle, for 55% of time for public transport (i.e., 63% for the bus/coach, 69% for the metro, 45% for suburban trains, and 22% for the tramway), and for 88% of the time for walking.
Descriptive data on participants and trips
In the sample of 285 participants, mean age was 50.2 (interdecile range: 37, 63). Sixty-three percent of partici-pants were males; 73% had a permanent job, 3% a tem-porary job, and 4% were unemployed; 53% had 3 or more years of University education; 35% of the partici-pants were living in Paris, 45% in the close suburb, and 20% in the far suburb.
Considering observation periods covered by the mobil-ity survey, these participants spent a median of 7.0% of their total time including sleep time in trips (transport activity) (interdecile range among 285 participants: 3.6, 11.4%). The number of trips per day per participant (ex-cluding jogging, walking a dog, or skiing segments) had a median of 5 (interdecile range: 3, 7), corresponding to 8 trips stages per individual per day (interdecile range: 4, 13). In the distribution of trips, there were 1.75% (n = 157) of multi-mode trips (several modes in addition to walking) according to the crude classification, and 6.96% (n = 625) according to the detailed classification of modes. Among trips with a unique mode (or involving a unique mode in addition to walking), 42.3% of trips were entirely walked trips; 4.8% were biking/rollers/skate-board trips; 3.0% of trips were with buses/coaches, 6.2% with metros, 1.8% with suburban trains, and 0.8% with tramways; and 36.0 and 5.0% of trips relied on a per-sonal motorized vehicle as the driver or passenger, respectively.
Distance walked
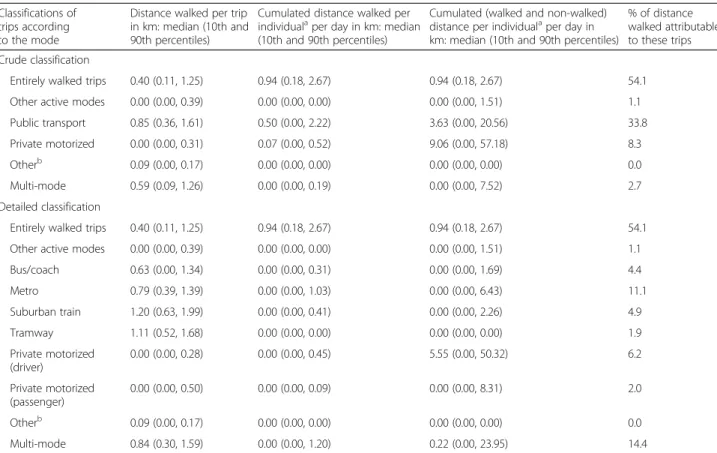
Participants covered a median (walked and nonwalked) distance of 22.1 km per day in trips (interdecile range: 7.1 km, 77.6 km). They walked a median of 2.1 km per day over all types of trips (interdecile range: 0.6 km, 4.5 km). As shown in Table 2, the median distance walked per trip was of 0.40 km for entirely walked trips, while it was of 0.85 km for public transport trips. As expected, the median distance walked was almost twice for trips including a stage with a surburban train (1.20 km) than for trips with metros or buses that are often spatially ac-cessible on a more local basis. Overall, 54.1% of the total distance walked in trips was covered in entirely walked trips, while as much as 33.8% of this total distance walked was accumulated during public transport trips, as compared to 8.3% in trips with a personal motorized vehicle.
Regarding geographic disparities, participants accumu-lated a median distance walked per day in all trips of 2.6 km in Paris, of 2.0 km in the close suburb, and of 1.5 km
in the far suburb. As shown in Table 3 (top part), the percentage of the total distance walked in trips accumu-lated in entirely walked trips was fairly comparable in Paris and in the close and far suburbs. However, the percentage of the total distance walked in trips that was covered in public transport trips decreased by 10 percentage points from Paris to the far suburb while the percentage that was accumulated in trips with a personal
motorized vehicle symmetrically increased by 10
percentage points.
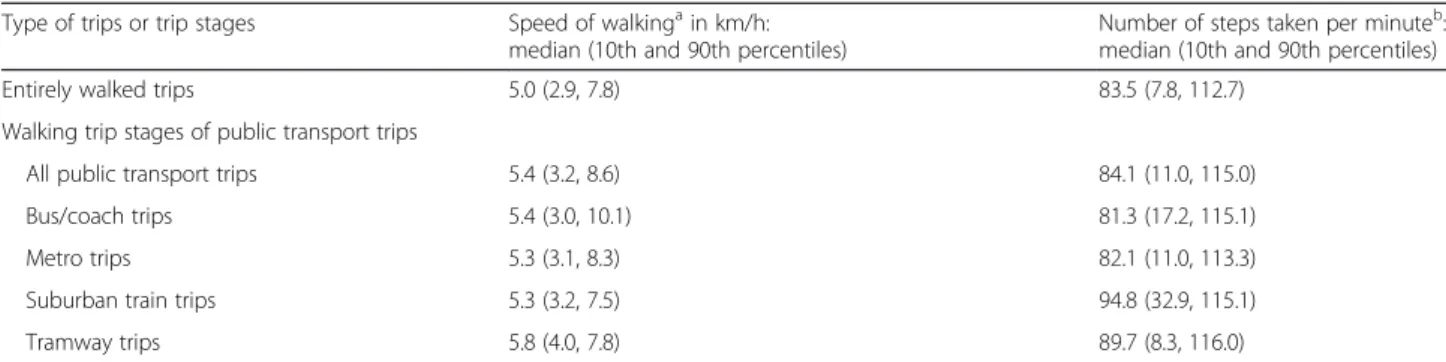
As shown in Table 4 (first column), the recorded
speed of walking in km/h was higher in the walking stages of trips with public transport than in entirely walked trips (Kruskal-Wallis test,p < 0.0001).
Accelerometer-derived steps
Over the mobility survey period, the accelerometer wear time per day had a median value of 14hr02min across the 284 participants (interdecile range: 10hr37min, 15hr48min). Participants accumulated a median of 4280 steps per unit of 8 h of accelerometer wear time (interdecile range: 2670 steps, 6842 steps). Over the entire accelerometer wear time, 39.6% of steps taken (interdecile range: 16.5, 59.6%) were accumulated during trips as opposed to visits at places.
As shown in Table 5, the number of steps taken per trip had a median value of 425 in entirely walked trips, while it was of 1352 in public transport trips. Again, trips relying on suburban trains were associated with a higher number of steps taken per trip (median = 1933) than trips with buses or metros. Overall, 43.2% of all steps taken during trips were covered in entirely walked trips, while 37.3% of such steps were covered in public transport trips, as compared to 11.7% in trips with a personal motorized vehicle.
Regarding geographic disparities, participants accumu-lated in all trips a median number of steps per 8 h of accelerometer wear time of 1994 in Paris, of 1442 in the close suburb, and of 1275 in the far suburb. Slightly differently than for the geographic disparities in distance walked, the percentage of trip-related accelerometer steps that were accumulated in entirely walked trips slightly decreased from Paris to the far suburb (Table3, bottom part). While the percentage of trip-related steps taken in public transport trips decreased by 10 percent-age points from Paris to the far suburb, the percentpercent-age of steps accumulated in trips with a personal motorized vehicle increased from 5.6% in Paris to 23.8% in the far suburb.
As reported in Table 4(second column), although the figures were close to each other, the recorded number of steps per minute was higher in walking trip stages of public transport trips than in entirely walked trips (Kruskal-Wallis test,p = 0.003).
Discussion
The present study developed novel methodologies for jointly collecting and processing GPS, mobility survey, and accelerometer data that enable an accurate assess-ment of physical activity in trips.
Strengths and limitations of the approach
The key novelty of the present study is its innovative GPS-based methodology involving a strong algorithmic pre-processing of GPS data, a phone-administered mo-bility survey, and a detailed manual correction and com-plementation of GPS tracks, allowing the timestamping and geolocation of each trip start and end points and points of change of mode within trips. To the best of our knowledge, the RECORD MultiSensor Study is the first to apply this comprehensive methodology in public health research, and the first to combine it with acceler-ometers and other sensors [12]. As recently reviewed [25], an alternative strategy is to ask study participants to report information on their trips in a paper or electronic diary [26], and to a posteriori link these travel mode data to trips identified from GPS data [7, 27]. However, the real-time reporting of information on ac-tivities and modes is burdensome and leads to high rates
Table 2 Overall distance and distance walked in trips according to the main mode used in the trip Classifications of
trips according to the mode
Distance walked per trip in km: median (10th and 90th percentiles)
Cumulated distance walked per individualaper day in km: median
(10th and 90th percentiles)
Cumulated (walked and non-walked) distance per individualaper day in
km: median (10th and 90th percentiles)
% of distance walked attributable to these trips Crude classification
Entirely walked trips 0.40 (0.11, 1.25) 0.94 (0.18, 2.67) 0.94 (0.18, 2.67) 54.1 Other active modes 0.00 (0.00, 0.39) 0.00 (0.00, 0.00) 0.00 (0.00, 1.51) 1.1 Public transport 0.85 (0.36, 1.61) 0.50 (0.00, 2.22) 3.63 (0.00, 20.56) 33.8 Private motorized 0.00 (0.00, 0.31) 0.07 (0.00, 0.52) 9.06 (0.00, 57.18) 8.3 Otherb 0.09 (0.00, 0.17) 0.00 (0.00, 0.00) 0.00 (0.00, 0.00) 0.0 Multi-mode 0.59 (0.09, 1.26) 0.00 (0.00, 0.19) 0.00 (0.00, 7.52) 2.7 Detailed classification
Entirely walked trips 0.40 (0.11, 1.25) 0.94 (0.18, 2.67) 0.94 (0.18, 2.67) 54.1 Other active modes 0.00 (0.00, 0.39) 0.00 (0.00, 0.00) 0.00 (0.00, 1.51) 1.1 Bus/coach 0.63 (0.00, 1.34) 0.00 (0.00, 0.31) 0.00 (0.00, 1.69) 4.4 Metro 0.79 (0.39, 1.39) 0.00 (0.00, 1.03) 0.00 (0.00, 6.43) 11.1 Suburban train 1.20 (0.63, 1.99) 0.00 (0.00, 0.41) 0.00 (0.00, 2.26) 4.9 Tramway 1.11 (0.52, 1.68) 0.00 (0.00, 0.00) 0.00 (0.00, 0.00) 1.9 Private motorized (driver) 0.00 (0.00, 0.28) 0.00 (0.00, 0.45) 5.55 (0.00, 50.32) 6.2 Private motorized (passenger) 0.00 (0.00, 0.50) 0.00 (0.00, 0.09) 0.00 (0.00, 8.31) 2.0 Otherb 0.09 (0.00, 0.17) 0.00 (0.00, 0.00) 0.00 (0.00, 0.00) 0.0 Multi-mode 0.84 (0.30, 1.59) 0.00 (0.00, 1.20) 0.22 (0.00, 23.95) 14.4
RECORD MultiSensor Study, 285 participants, 8983 trips, 21,163 trip stages a
In the second and third columns, distances are drawn from the distribution of cumulated distances over the 285 individuals, including those who do not use the corresponding modes
b
Long distance train and plane
Table 3 Percentages of distance walked and percentages of steps takenaattributable to trips with different modes
Paris Close suburb Far suburb % of distance walked
Entirely walked trips 54.4 53.6 54.3 Other active modes 2.0 0.5 0.1 Public transport 36.9 33.3 26.8 Private motorized 4.4 10.0 14.4
Otherb 0.0 0.0 0.0
Multi-mode 2.3 2.6 4.4 % of steps taken
Entirely walked trips 45.5 41.9 40.6 Other active modes 4.5 2.9 1.2 Public transport 39.7 38.4 28.1 Private motorized 5.6 13.5 23.8
Otherb 0.0 0.0 0.0
Multi-mode 4.7 3.4 6.4
Percentages tabulated for participants residing in different geographic environments (RECORD MultiSensor Study)
a
We consider the steps accumulated over the entire trip (including with non-walking modes and during transfer episodes)
b
of missing data [28]. Moreover, a challenge is that the two separately collected sources of data on the same trips, the GPS data and the diary data, then must be aligned using imperfect decision rules, which implies approximations [5,26].
The proposed GPS-based prompted recall mobility sur-vey approach, rooted in transport sciences [20, 29–31], aims to address these two concerns. First, our participants were asked to fill a simple travel diary. However, this is not our only source of information on travel modes, but
just a complementary tool to support the recall during the phone mobility survey, so missing data in this diary are less critical. Moreover, advanced algorithms aim to auto-matically identify visited places (on the basis of previously surveyed regular destinations and points of interest) and travel modes (on the basis of speeds, usual modes re-ported in a survey, and geographic location of public transport stations). This pre-identification is important to reduce the burden of the survey for both the participants and research assistants (who confirm the detected modes
Table 4 Speed of walking and number of steps taken per minute Type of trips or trip stages Speed of walkingain km/h:
median (10th and 90th percentiles)
Number of steps taken per minuteb: median (10th and 90th percentiles) Entirely walked trips 5.0 (2.9, 7.8) 83.5 (7.8, 112.7)
Walking trip stages of public transport trips
All public transport trips 5.4 (3.2, 8.6) 84.1 (11.0, 115.0) Bus/coach trips 5.4 (3.0, 10.1) 81.3 (17.2, 115.1) Metro trips 5.3 (3.1, 8.3) 82.1 (11.0, 113.3) Suburban train trips 5.3 (3.2, 7.5) 94.8 (32.9, 115.1) Tramway trips 5.8 (4.0, 7.8) 89.7 (8.3, 116.0)
Indicators of the intensity of walking are provided for walked trips and for walking stages of public transport trips (RECORD MultiSensor Study) a
In this calculation, the trips and trip stages were weighted according to the distance walked b
In this calculation, the trips and trip stages were weighted according to the duration walked
Table 5 Accelerometer-derived number of steps taken in trips according to the main modeaused in the trip Classifications of trips according
to the mode
Number of steps taken per trip: median (10th and 90th percentiles)
Cumulated number of steps in trips per individual per 8 h of accelerometer wear time:bmedian (10th and 90th
percentiles)
% of trip-related steps taken attributable to these trips
Crude classification
Entirely walked trips 425 (4, 1587) 554 (61, 2176) 43.2 Other active modes 283 (41, 1007) 0 (0, 123) 3.3 Public transport 1352 (499, 2453) 397 (0, 1913) 37.3 Private motorized 86 (10, 453) 120 (0, 549) 11.7
Otherc 14 (2, 26) 0 (0, 0) 0.0
Multi-mode 1213 (445, 2402) 0 (0, 234) 4.4 Detailed classification
Entirely walked trips 425 (4, 1587) 554 (61, 2176) 43.2 Other active modes 283 (41, 1007) 0 (0, 123) 3.3 Bus/coach 771 (169, 1910) 0 (0, 243) 4.3
Metro 1267 (576, 2292) 0 (0, 892) 12.6
Suburban train 1933 (859, 2876) 0 (0, 265) 5.4
Tramway 1286 (271, 1957) 0 (0, 0) 1.5
Private motorized (driver) 83 (10, 420) 72 (0, 476) 9.4 Private motorized (passenger) 118 (12, 705) 0 (0, 105) 2.2
Otherc 14 (2, 26) 0 (0, 0) 0.0
Multi-mode 1466 (638, 2480) 0 (0, 1165) 18.1
RECORD MultiSensor Study, 284 participants, 8728 trips, 20,564 trip stages a
We consider the steps accumulated over the entire trip (including with non-walking modes and during transfer episodes) b
The overall number of days of mobility survey could not be used as the denominator as there is nonwear of the accelerometer within it. As a consequence, we chose as the denominator the number of units of 8 h of accelerometer wear time
c
in each trip based on the diary and with the participant on the phone). Second, there is no need of imprecise a posteriori alignment of GPS trips and survey travel modes as in the alternative approach, since the travel modes are pre-identified and then confirmed / collected during the phone mobility survey on the basis of GPS trips.
Compared to the mobility survey that we implemented in our previous RECORD GPS Study [3, 9, 11, 32], in this new RECORD MultiSensor Study based on a novel GPS-based web survey application, we now perform a full and accurate correction and complementation of GPS tracks. Even after removing unreliable GPS points (e.g., with an excessive dilution of precision or excessive speed), numerous artefacts remain in the GPS tracks that completely preclude the reliable calculation of dis-tances covered from GPS data, an important information from a transport and public health perspective. We therefore carefully edited all the GPS tracks, removing any artefact in the tracks and complementing the tracks when needed, e.g., when short segments of walk before or after public transport episodes were missing. It enabled an accurate assessment of trip distances and walked distances, including within trips with heavier modes.
Our approach has its own limitations. Despite an improved precision, the timestamping of starts and ends of trips and of changes of modes within trips can lack accuracy, especially when GPS data are lacking and when research assistants then have to approximately assign timestamps. It could affect the assessment of accelerometer physical activity in short walking episodes, e.g., in indoor transfer walks between public transport stages.
Transfer walks from one to another rail-based trip stages often occur underground in the Paris region. Most instances of these transfers are coded in our mo-bility survey as point locations connecting two rail-based itineraries. While there is obviously no map distance associated with these transfer episodes in our survey, they have start and end times, and it is possible to calcu-late statistics on the number of accelerometer steps per minute during these very short transfer episodes. However, because the timestamps of these underground transfer episodes lack accuracy, the corresponding statistics are reported in Additional file1: Table S1. It is not clear whether the lower number of steps per minute in these transfer episodes than in other walked segments is attributable to the expected waiting times or also to imprecise timestamping.
Clearly, another limitation of the proposed approach is its cost. Depending on the data collected in the mobility survey, correcting and complementing 7 days of a partic-ipant’s data can take one full day of work for a research assistant. Trained research assistants able to apply a
large number of coding and processing rules are needed. However, we emphasize below and in Table1that GPS-based mobility surveys allow one to collect specific data offering analytical opportunities that would not be avail-able otherwise. And spending substantial amounts of money per participant to collect high quality data is common in research (e.g., for assessing genetic variants or biomarkers), so there is no reason why researchers should not similarly invest to collect reliable data on transport behavior, time budgets, places visited, and activities. Moreover, Table 1 shows that less time-consuming mobility surveys collecting a lower amount of data or with a lower accuracy than the one implemented here are also possible, depending on the research aims and analytical capabilities needed (e.g., collecting timestamps for trips but not for trip stages, or collecting detailed timestamps without manual editing of GPS tracks).
Accuracy gains from the mobility survey
When participants are at a fixed location (e.g., in a building) and the GPS receiver keeps logging data (through the windows), it often generates pseudo-ambulations over considerable (fake) distances. The substantial drop in the distance covered by participants when comparing the quasi-raw GPS data to the algorithm-processed data is attributable to the elimin-ation of a large share of these pseudo-ambulelimin-ations. Simi-larly, the additional although smaller drop in the total distance covered in trips from the algorithm-based to the mobility survey-based versions of the statistic was due to the manual elimination of residual pseudo-ambulations. This second drop in distance underesti-mates the extent of the manual correction, as on the other hand we also added trips that were missed by the GPS receiver.
In addition to an inadequate assessment of distances covered, the algorithm-processed GPS data (uncorrected through the mobility survey) were substantially mistaken in their distinction of transport time from time spent at a visited place; and they were also massively wrong in their identification of transport modes, and particularly so for public transport. Thus, our study reveals that it would be unwise to investigate the relationship between transport modes in trips and the corresponding physical activity, e.g., assessed with accelerometers, using these GPS-based algorithm-identified transport mode data.
Interpretation of empirical findings
Our method enabled to quantify physical activity in trips using two accurate metrics that provided coherent find-ings. For example, public transport trips were associated with a more than twice larger median distance walked per trip, and with a three times larger median number of
steps taken per trip, as compared to entirely walked trips. Also, the two metrics (distance walked and number of steps) indicated that, among public transport trips, trips involving a suburban train implied the larger walking activity per trip while those involving buses implied the lower walking activity. This observation is attributable to the typically shorter distance to reach bus stops than suburban train stations.
Over the observation period, 33.8% of the total distance walked during trips and 37.3% of all steps taken in trips were attributable to public transport trips. While these two figures are clearly coherent, the higher percentage at-tributable to public transport for the steps taken than for the distance walked is likely due to the fact that the metric of accelerometer steps also captures walking within trans-port stations and underground settings, including during transfer episodes coded as punctual locations in terms of spatial distance. These figures, as the main empirical find-ing of the paper, suggest that public transport is a major generator of physical activity. Promoting public transport use for trips that are difficult or impossible to walk or bike should be one of the cornerstones of public policies to promote physical activity.
Our analysis of geographic disparities showed that resi-dents of the far suburbs cumulated a 1.7 times lower dis-tance walked per day during trips and 1.6 times fewer trip-related steps per 8 h of accelerometer wear time than residents of Paris. This is attributable to the sharply lower reliance on the two main sources of transport physical ac-tivity in the far suburbs, where the number of walking trips per individual per day was more than two times lower and the number of public transport trips per indi-vidual per day three times lower than in Paris (as shown in Additional file1: Table S2). As a result, public transport trips had a lower contribution and trips with a personal motorized vehicle a higher contribution to the lower amount of transport-related walking in the far suburb than in Paris. These findings strongly support the idea that further developing public transport in the close and far suburbs of Paris would reduce geographic disparities in transport-related physical activity.
Finally, another illustration of the accuracy of our meth-odology is that the two metrics of the intensity of walking (speed of walking and number of steps per minute) coher-ently indicated a higher intensity of walking during the walking stages of public transport trips than during entirely walked trips. An obvious reason is the inflexible constraint related to the departure time of public transport vehicles in the former.
The importance of mobility survey data
Table 1 summarizes the analytical opportunities offered by GPS-based mobility surveys, describing the benefits associated with each additional layer of refinements
introduced in the survey. We discuss here the benefits of a GPS-based mobility survey against the simpler strategy involving only sensor-based tracking.
First, as illustrated in this paper, our reliance on a mobility survey in addition to the sensor-based data collection allowed us to provide accurate figures on the transport behavior and transport-related physical activity of participants that other methodologies such as the sole processing of sensor data by algorithms could not pro-vide. Such accurate figures are needed for the correct in-formation of policymakers and, as illustrated in previous articles [3,9,10], as input data for modeling the impact of various scenarios of interventions using simulation work. In this previous work, we modelled physical activity in trips in function of trip characteristics with random forests techniques in our small sensor-based sample, and then we applied this random forest algo-rithm to predict physical activity in each trip of partici-pants from a large representative transport survey, and finally used this large transport survey sample to assess through simulations the impact of scenarios of shift in transport modes (public policies) on population physical activity [9,10]. Such a work would not have been possible with a reasonable degree of accuracy without our GPS-based mobility survey. As detailed in Table1, the quality of study findings on transport activity will vary depending on the precision of the mobility survey (i.e., whether seg-mentation into trip stages and manual edition/comple-mentation of GPS tracks is conducted or not).
Second, such GPS-based mobility survey data provide a background of timestamped information on activities and travel modes against which to interpret the data col-lected with other sensors. For example, similar to what we did with accelerometry, when mobility survey data are combined with sound pressure and air pollutant data collected with wearable monitors, it is possible to isolate transport-related or even mode-specific exposures. Similarly, such mobility survey information can be used to calculate transport- or mode-specific built environ-mental exposures along GPS tracks with a geographic information system.
Third, a mobility survey provides a tool and opportun-ity for collecting other information, either on the expos-ure side or on the outcome side, disaggregated over space and time. For example, we used or are using such a mobility survey to collect data on recreational physical ac-tivity in trips and at visited places in our RECORD Multi-Sensor Study, on social contacts in our RECORD-HANC protocol, and on stress in trips in our MobiliSense protocol. Such spatially and temporally disaggregated data are needed to develop life-segment and momentary ana-lyses of relationships, as recommended elsewhere [25].
Fourth, collecting such data on activities at visited places is critical to address the selective daily mobility
bias discussed in previous articles [22, 25, 33]. For ex-ample, it is useful to collect information on places specifically visited to practice sports or to purchase or consume foods, because such places should not be con-sidered as reference locations when calculating the spatial accessibility to facilities in studies investigating accessibility effects on the corresponding behavior.
Conclusions
Combining a GPS and accelerometer data collection with a GPS-based mobility survey allowed us to explore the walking physical activity in transport using two
complementary metrics, i.e., distance walked and
accelerometer steps. Methodologically, our comparison of GPS-based mobility survey data with algorithm-only processed GPS data suggests that the latter substantially distort transport modes, and thus would yield biased findings. Empirically, our results, which might only apply to cities within a comparable urban structure and transport infrastructure, suggest that public transport is a major generator of physical activity, with a steady decrease from the core of Paris to the far suburb in the overall transport-related walking activity and in the contribution of public transport to walking activity.
Additional file
Additional file 1:Table S1. Number of steps taken per minute during episodes of transfer in public transport trips represented as point locations in the mobility survey (RECORD MultiSensor Study). Table S2. Average number of trips per individual per day according to the main mode in the trip and according to the geographic location of the residence (RECORD MultiSensor Study). (DOCX 17 kb)
Acknowledgements Not applicable. Authors’ contributions
BC had the leading role in the conception of the data collection and analytical design. He had the primary role in the analysis of the data and in the writing of the manuscript. TB provided comments during the conception of the analytical plan. TB, YK, RB, CP, PG, and DD provided critical comments related to the interpretation of study findings. All authors read and approved the final manuscript.
Funding
The RECORD MultiSensor Study was supported by the Ministry of Ecology (DGITM); Cerema (Centre for the Study of and Expertise on Risks, the Environment, Mobility, and Planning); INPES (National Institute for Prevention and Health Education); STIF (Ile-de-France Transportation Authority); and DRIEA (Regional and Interdepartmental Direction of Equipment and Planning) of Ile-de-France. The funding institutions had no role in the design of the study and collection, analysis, and interpretation of data and in writing the manuscript.
Availability of data and materials
The dataset analyzed in the current study is not publicly available due to confidentiality of mobility destinations of participants but may be available from the corresponding author on request.
Ethics approval and consent to participate
The RECORD MultiSensor Study was approved by the French Data Protection Authority. All participants signed an informed consent form.
Consent for publication Not applicable. Competing interests
All authors declare that they have no competing interests. Author details
1Sorbonne Université, INSERM, Institut Pierre Louis d’Epidémiologie et de
Santé Publique IPLESP, Nemesis team, Faculté de Médecine Saint-Antoine, 27 rue Chaligny, 75012 Paris, France.2Department of Family Medicine and Public Health & Scripps Institution of Oceanography, University of California in San Diego, 9500 Gilman Drive #0725, La Jolla, CA 92093, USA.
3Department of Social and Preventive Medicine, École de Santé Publique de
l’Université de Montréal, Centre de recherche du CHUM, Tour Saint-Antoine, 850 Saint-Denis, S03-280, Montréal H2X 0A9, Canada.4University of Montreal
Hospital Research Centre, Tour Saint-Antoine, 850 Saint-Denis, S03-280, Montréal H2X 0A9, Canada.5Luxembourg Institute of Socio-Economic
Research, Maison des Sciences Humaines, 11 Porte des Sciences, L-4366 Esch-sur-Alzette, Luxembourg.6Spatial Epidemiology Lab, Department of
Population Health, School of Medicine, New York University, 180 Madison Avenue, New York, NY 10016, USA.
Received: 14 November 2018 Accepted: 16 August 2019
References
1. Sallis JF, Bull F, Guthold R, Heath GW, Inoue S, Kelly P, et al. Progress in physical activity over the Olympic quadrennium. Lancet. 2016;388:1325–36. 2. Kohl HW 3rd, Craig CL, Lambert EV, Inoue S, Alkandari JR, Leetongin G, et al.
The pandemic of physical inactivity: global action for public health. Lancet. 2012;380:294–305.
3. Chaix B, Kestens Y, Duncan S, Merrien C, Thierry B, Pannier B, et al. Active transportation and public transportation use to achieve physical activity recommendations? A combined GPS, accelerometer, and mobility survey study. Int J Behav Nutr Phys Act. 2014;11:124.
4. Sahlqvist S, Song Y, Ogilvie D. Is active travel associated with greater physical activity? The contribution of commuting and non-commuting active travel to total physical activity in adults. Prev Med. 2012;55:206–11. 5. Saelens BE, Vernez Moudon A, Kang B, Hurvitz PM, Zhou C. Relation
between higher physical activity and public transit use. Am J Public Health. 2014;104:854–9.
6. Southward EF, Page AS, Wheeler BW, Cooper AR. Contribution of the school journey to daily physical activity in children aged 11-12 years. Am J Prev Med. 2012;43:201–4.
7. Costa S, Ogilvie D, Dalton A, Westgate K, Brage S, Panter J. Quantifying the physical activity energy expenditure of commuters using a combination of global positioning system and combined heart rate and movement sensors. Prev Med. 2015;81:339–44.
8. Jansen M, Ettema D, Pierik F, Dijst M. Sports facilities, shopping centers or homes: what locations are important for Adults’ physical activity? A cross-sectional study. Int J Environ Res Public Health. 2016;13:287. 9. Brondeel R, Pannier B, Chaix B. Associations of socioeconomic status with
transport-related physical activity: combining a household travel survey and accelerometer data using random forests. J Transp Health. 2016;3:287–96. 10. Brondeel R, Kestens Y, Chaix B. An evaluation of transport mode shift
policies on transport-related physical activity through simulations based on random forests. Int J Behav Nutr Phys Act. 2017;14:143.
11. Chaix B, Kestens Y, Duncan DT, Brondeel R, Meline J, El Aarbaoui T, et al. A GPS-based methodology to analyze environment-health associations at the trip level: case-crossover analyses of built environments and walking. Am J Epidemiol. 2016;184:570–8.
12. El Aarbaoui T, Meline J, Brondeel R, Chaix B. Short-term association between personal exposure to noise and heart rate variability: the RECORD MultiSensor study. Environ Pollut. 2017;231:703–11.
13. Chaix B, Kestens Y, Bean K, Leal C, Karusisi N, Meghiref K, et al. Cohort profile: residential and non-residential environments, individual activity
spaces and cardiovascular risk factors and diseases--the RECORD cohort study. Int J Epidemiol. 2012;41:1283–92.
14. Leal C, Bean K, Thomas F, Chaix B. Multicollinearity in the associations between multiple environmental features and body weight and abdominal fat: using matching techniques to assess whether the associations are separable. Am J Epidemiol. 2012;175:1152–62.
15. Chaix B, Jouven X, Thomas F, Leal C, Billaudeau N, Bean K, et al. Why socially deprived populations have a faster resting heart rate: impact of behaviour, life course anthropometry, and biology - the RECORD cohort study. Soc Sci Med. 2011;73:1543–50.
16. Karusisi N, Thomas F, Meline J, Chaix B. Spatial accessibility to specific sport facilities and corresponding sport practice: the RECORD study. Int J Behav Nutr Phys Act. 2013;10:48.
17. Perchoux C, Kestens Y, Thomas F, Hulst AV, Thierry B, Chaix B. Assessing patterns of spatial behavior in health studies: their socio-demographic determinants and associations with transportation modes (the RECORD cohort study). Soc Sci Med. 2014;119:64–73.
18. Duncan S, Stewart TI, Oliver M, Mavoa S, MacRae D, Badland HM, et al. Portable global positioning system receivers: static validity and environmental conditions. Am J Prev Med. 2013;44:e19–29.
19. Sasaki JE, John D, Freedson PS. Validation and comparison of ActiGraph activity monitors. J Sci Med Sport. 2011;14:411–6.
20. Wolf J, Oliveira M, Thompson M. Impact of underreporting on mileage and travel time estimates: results from global positioning system-enhanced household travel survey. Transp Res Rec. 2003;1854:188–98.
21. Wolf J, Schönfelder S, Samaga U, Oliveira M, Axhausen KW. Eighty weeks of global positioning system traces: approaches to enriching trip information. Transp Res Rec. 2004;1870:46–54.
22. Chaix B, Kestens Y, Perchoux C, Karusisi N, Merlo J, Meghiref K. An interactive mapping tool to assess individual mobility patterns in neighborhood studies. Am J Prev Med. 2012;43:440–50.
23. Choi L, Liu Z, Matthews CE, Buchowski MS. Validation of accelerometer wear and nonwear time classification algorithm. Med Sci Sports Exerc. 2011;43:357–64. 24. Choi L, Ward SC, Schnelle JF, Buchowski MS. Assessment of wear/nonwear
time classification algorithms for triaxial accelerometer. Med Sci Sports Exerc. 2012;44:2009–16.
25. Chaix B. Mobile sensing in environmental health and neighborhood research. Annu Rev Public Health. 2018;39:367–84.
26. Scully JY, Vernez Moudon A, Hurvitz PM, Aggarwal A, Drewnowski A. GPS or travel diary: comparing spatial and temporal characteristics of visits to fast food restaurants and supermarkets. PLoS One. 2017;12:e0174859. 27. Oliver M, Badland H, Mavoa S, Duncan MJ, Combining DS, GPS. GIS, and
accelerometry: methodological issues in the assessment of location and intensity of travel behaviors. J Phys Act Health. 2010;7:102–8.
28. Arentze TA, Dijst M, Dugundij E, Joh CH, Kapoen L, Krijgsman S, et al. New activity diary format: design and limited empirical evidence.
Transp Res Rec. 2001;1768:79–88.
29. Auld J, Williams CA, Mohammadian AK, Nelson PC. An automated GPS-based prompted recall survey with learning algorithms. J Transp Lett. 2009;1:59–79.
30. Bohte W, Maat K. Deriving and validating trip purposes and travel modes for multi-day GPS-based travel surveys: a large-scale application in the Netherlands. Transp Res Part C. 2009;17:285–97.
31. Stopher PR, Collins A. Conducting a GPS prompted recall survey over the internet. Washington, D.C: 84th Annual Meeting of the Transportation Research Board; 2005.
32. Brondeel R, Pannier B, Chaix B. Using GPS, GIS, and accelerometer data to predict transportation modes. Med Sci Sports Exerc. 2015;47:2669–75. 33. Chaix B, Meline J, Duncan S, Merrien C, Karusisi N, Perchoux C, et al. GPS
tracking in neighborhood and health studies: a step forward for environmental exposure assessment, a step backward for causal inference? Health Place. 2013;21:46–51.
Publisher’s Note
Springer Nature remains neutral with regard to jurisdictional claims in published maps and institutional affiliations.