Characterization of submicron aerosols at a rural
site in Pearl River Delta of China using an Aerodyne
High-Resolution Aerosol Mass Spectrometer
The MIT Faculty has made this article openly available. Please share
how this access benefits you. Your story matters.
Citation
Huang, X.-F. et al. “Characterization of submicron aerosols at a
rural site in Pearl River Delta of China using an Aerodyne
High-Resolution Aerosol Mass Spectrometer.” Atmospheric Chemistry
and Physics 11 (2011): 1865-1877. Web. 20 Oct. 2011.
As Published
http://dx.doi.org/10.5194/acp-11-1865-2011
Publisher
European Geosciences Union
Version
Final published version
Citable link
http://hdl.handle.net/1721.1/66521
Terms of Use
Creative Commons Attribution 3.0
www.atmos-chem-phys.net/11/1865/2011/ doi:10.5194/acp-11-1865-2011
© Author(s) 2011. CC Attribution 3.0 License.
Chemistry
and Physics
Characterization of submicron aerosols at a rural site in Pearl River
Delta of China using an Aerodyne High-Resolution Aerosol Mass
Spectrometer
X.-F. Huang1, L.-Y. He1, M. Hu2, M. R. Canagaratna3, J. H. Kroll4, N. L. Ng3, Y.-H. Zhang2, Y. Lin1, L. Xue1, T.-L. Sun1, X.-G. Liu2, M. Shao2, J. T. Jayne3, and D. R. Worsnop3
1Key Laboratory for Urban Habitat Environmental Science and Technology, School of Environment and Energy, Peking
University Shenzhen Graduate School, Shenzhen, China
2State Key Joint Laboratory of Environmental Simulation and Pollution Control, College of Environmental Sciences and
Engineering, Peking University, Beijing, China
3Aerodyne Research, Inc. Billerica, MA, USA
4Department of Civil and Environmental Engineering, Massachusetts Institute of Technology, Cambridge, MA, USA
Received: 21 October 2010 – Published in Atmos. Chem. Phys. Discuss.: 3 November 2010 Revised: 13 January 2011 – Accepted: 1 February 2011 – Published: 1 March 2011
Abstract. The Pearl River Delta (PRD) region in South China is one of the most economically developed regions in China, but it is also noted for its severe air pollution due to industrial/metropolitan emissions. In order to continuously improve the understanding and quantification of air pollu-tion in this region, an intensive campaign was executed in PRD during October–November 2008. Here, we report and analyze Aerodyne High-Resolution Aerosol Mass Spectrom-eter measurements at Kaiping, a rural site downwind of the highly-polluted central PRD area, to characterize the gen-eral features of submicron particulate pollution in the re-gional air. The mean measured PM1mass concentration was
33.1±18.1 µg m−3during the campaign and composed of or-ganic matter (33.8%), sulfate (33.7%), ammonium (14.0%), nitrate (10.7%), black carbon (6.7%), and chloride (1.1%), which is characterized by high fractions of inorganic ions due to huge emissions of SO2 and NOx in PRD. The
av-erage size distributions of the species (except BC) were all dominated by an accumulation mode peaking at ∼450 nm in vacuum aerodynamic diameter. Calculations based on high-resolution organic mass spectra indicate that C, H, O, and N on average contributed 56.6, 7.0, 35.1, and 1.3% to the total organic mass, respectively, corresponding to an or-ganic matter mass to oror-ganic carbon mass ratio (OM/OC) of 1.77±0.08. Based on the high-resolution organic mass spec-tral dataset observed, Positive Matrix Factorization (PMF)
Correspondence to: L.-Y. He
(hely@pku.edu.cn)
analysis differentiated the organic aerosol into three compo-nents, i.e., biomass burning (BBOA) and two oxygenated (LV-OOA and SV-OOA) organic aerosols, which on aver-age accounted for 24.5, 39.6 and 35.8% of the total organic mass, respectively. The BBOA showed strong features of biomass burning emissions and has been mainly attributed to the open field burning of crop residues after the harvest in PRD rural areas. The LV-OOA and SV-OOA were found to correspond to more aged (and thus less-volatile) and fresher (and semi-volatile) secondary organic aerosol (SOA), respec-tively. Analysis of meteorological influence supported that regional transport from the central PRD area was the major origin of the PM1observed at the Kaiping site.
1 Introduction
The Pearl River Delta (PRD) region lies in the southeastern coastal part of China and is noted for its flourishing man-ufacturing and export industries. The urbanization in PRD is now characterized by several big cities like Guangzhou, Shenzhen, and Hong Kong and many medium-small cities linked by dense highways. The rapid economic development and urbanization in PRD in the recent decades comes with the consequence of severe deterioration of its atmospheric environment from urban to regional scale. For example, the annual mean PM2.5 concentrations were reported to range
from 29 (for regional background site) to 71 (for urban site) µg m−3in PRD with organic matter and sulfate as the most abundant constituents (Hagler et al., 2006). The air pollution
problems in PRD have been a major concern of the national government of China and have raised global scientific in-terest (Streets et al., 2006; Zhang et al., 2008). As aerosol particles are a complicated mixture of various species, deep understanding of variation of aerosol chemical and physical properties is essential for the purposes of source identifica-tion and polluidentifica-tion control. Most previous aerosol studies in PRD were based on filter sampling followed by laboratory analysis, which provided datasets at a coarse time resolution like a day. The coarse time resolution of the aerosol datasets cannot match the actual faster variation of aerosol properties in the real atmosphere, which strongly favors highly time-resolved on-line measurement techniques.
In order to characterize in depth the variation of chem-ical and physchem-ical properties of fine particles in the atmo-sphere of PRD, an intensive monitoring campaign supported by the project “Synthesized Prevention Techniques for Air Pollution Complex and Integrated Demonstration in Key City-Cluster Region” launched by the Ministry of Science and Technology, China, was organized by Peking Univer-sity in PRD during October–November, 2008. As part of this campaign, we deployed an Aerodyne high-resolution aerosol mass spectrometer for measurement of submicron aerosol particles downwind of the most polluted central PRD area, in order to better characterize the particulate pollution features in the well mixed and more aged regional air. It was the first application of a high-resolution aerosol mass spectrometer in PRD. Utilizing the advantages of the high-resolution aerosol mass spectrometer, highly-time resolved species variations, elemental analysis and source apportion-ment of organic aerosol (OA) in the atmosphere of PRD were systematically studied in this paper.
2 Experimental methods 2.1 Sampling site description
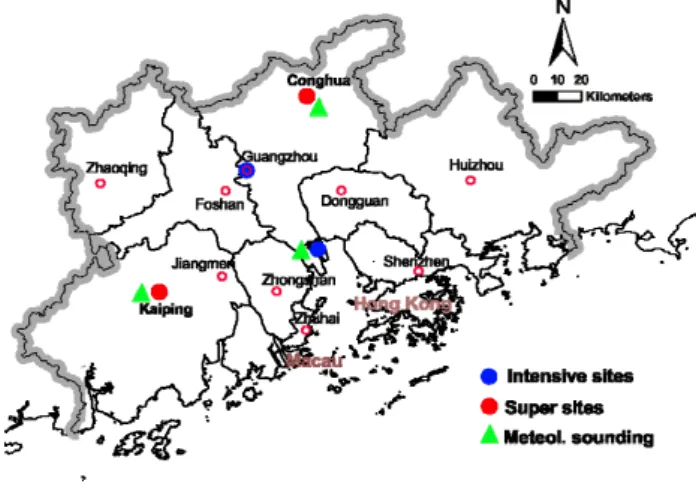
The landscape of PRD consists of a flat plain between the Nan Ling Mountains in the North and the South China Sea in the south. Hills surround PRD in the east, west, and north. In the campaign of this study, air monitoring sites were set along the northeast-southwest axis of PRD, as shown in Fig. 1, including two supersites in the rural areas, i.e., Con-ghua and Kaiping, respectively. In the period of October– November, under the influence of the East Asian monsoon, the prevailing wind in PRD is northeasterly and thus Con-ghua is upwind of the central PRD area, while Kaiping is downwind of the central PRD area, receiving pollutants through regional transport. The Kaiping supersite was lo-cated at a patriotic educational base (22.32◦N, 112.53◦E), about 120 km away from Guangzhou. This site was sur-rounded by shrubs and eucalyptus forest and was free of any significant local pollution emissions.
580 581 582
Fig. 1. The location of the Kaiping monitoring site in the PRD region.
22
Fig. 1. The location of the Kaiping monitoring site in the PRD
region.
2.2 HR-ToF-AMS operation
An Aerodyne High-Resolution Time-of-Flight Aerosol Mass Spectrometer (HR-ToF-AMS) was deployed in an air mon-itoring container settled at the Kaiping supersite from 12 October to 18 November 2008. A detailed instrumental description of HR-ToF-AMS can be found in DeCarlo et al. (2006). A PM2.5 cyclone inlet was supported on the
roof of the container to remove coarse particles and intro-duce air stream into the container through a copper tube with a flow rate of 10 l min−1. The HR-ToF-AMS sam-pled isokinetically from the center of the copper tube at a flow rate of 80 cc min−1. During the campaign, the HR-ToF-AMS operated in a cycle of 5 modes every 10 min-utes, including: 2 min V-mode to obtain the mass concen-trations of the non-refractory species; 2 min W-mode to ob-tain high resolution mass spectral data; 4 min separate PToF (particle time-of-flight) mode to determine size distributions of species under the V-mode; and 2 min Soft-EI mode us-ing a lower EI voltage (∼13 eV). The PToF mode was not run under the W-mode because of poor signal-to-noise. The Soft-EI mode data are not included in this paper. The HR-ToF-AMS was calibrated for inlet flow, ionization efficiency (IE), and particle sizing at the beginning, the middle and the end of the campaign following the standard protocols (Jayne et al., 2000; Jimenez et al., 2003; Drewnick et al., 2005). The calibration of IE used size-selected pure ammonium ni-trate particles and the particle size calibration was conducted using mono-disperse polystyrene latex spheres (PSL, den-sity = 1.05 g cm−3) (Duke Scientific, Palo Alto, California,
USA) with nominal diameters of 100–700 nm. For a better mass closure measurement of fine particles in the campaign, a Multi-Angle Absorption Photometer (MAAP, Model 5012, Thermo) coupled with a PM2.5cyclone was used for
simulta-neous measurement of refractory black carbon (BC), which cannot be detected by HR-ToF-AMS.
2.3 HR-ToF-AMS data processing
Mass concentrations and size distributions of the species measured with the HR-ToF-AMS were calcu-lated using methods outlined in DeCarlo et al. (2006). Standard ToF-AMS data analysis software pack-ages (SQUIRREL version 1.49 and PIKA version 1.08) downloaded from the ToF-AMS-Resources webpage (http://cires.colorado.edu/jimenez-group/ ToFAMSResources/ToFSoftware/index.html) were used to generate unit and high-resolution mass spectra from the V-mode and W-mode data respectively. For mass concentra-tion calculaconcentra-tions an empirical particle collecconcentra-tion efficiency (CE) factor of 0.5 was used to account for the incomplete detection of species due to particle bouncing at the vaporizer and partial transmission through the aerodynamic lens (Canagaratna et al., 2007). The relative ionization efficiency (RIE) values used in this study were 1.2 for sulfate, 1.1 for nitrate, 1.3 for chloride and 1.4 for organics (Jimenez et al., 2003, Canagaratna et al., 2007). A RIE value of 4.0–4.4 was used for ammonium based on the measurement of pure NH4NO3particles.
Positive matrix factorization (PMF) (Paatero and Tapper, 1994) analysis was conducted on the high-resolution (HR) mass spectra (m/z 12–150) using the PMF evaluation tool developed by Ulbrich et al. (2009). Compared with unit mass-resolution (UMR) spectra, HR mass spectra can pro-vide better separation of different organic components in PMF analysis (Docherty et al., 2008; Aiken et al., 2009, De-Carlo et al., 2010; Huang et al., 2010). The data and noise matrices input into the PMF analysis were generated with the default fragmentation waves in PIKA version 1.08. The noise values were calculated as the sum of electronic and Poisson ion-counting errors for the relevant high resolution ion frag-ment (Allan et al., 2003, Ulbrich et al., 2009). The average noise value observed for ions during low signal time periods was used as the minimum error value for the error matrix. The ions of H2O+, HO+, O+, and CO+were not included
into PMF running since they were determined according to their relationship with CO+2 and thus including them in the PMF analysis can introduce additional weight to CO+2 (Ul-brich et al., 2009). These ions were inserted back into the mass spectra of the resulted PMF components. Weak ions (0.2<signal to noise ratio <2) were downweighted by a fac-tor of 3 while bad ions (signal to noise ratio <0.2) were re-moved from the analysis (Paatero and Hopke, 2003; Ulbrich et al., 2009). More technical details of the PMF analysis can be found in another of our recent publication (Huang et al., 2010). Elemental analysis of the organic components iden-tified by PMF was carried out with the methods described previously (Aiken et al., 2007, 2008).
3 Results and discussion
3.1 Variations of PM1components
During the entire campaign from 12 October to 18 Novem-ber 2008, the average ambient temperature and relative hu-midity at the Kaiping site were 24±5◦C and 69±15%, re-spectively, as shown in Fig. 2a. A clear diurnal pattern of wind during the campaign can be observed in Fig. 2b: east-northeasterly wind usually blew during the day, bringing pol-lution from the central PRD area to Kaiping, while during the night the wind usually became calm. An exception, however, was that during 8–10 November a cold front passed through PRD, which was characterized by continuous lower temper-ature and stronger east-northeasterly wind. There were few rainfall events during the campaign that leaded to significant wet removal of air pollutants. These meteorological condi-tions were very typical of the fall in PRD.
Figure 2c–e present the time series of the PM1mass
con-centration (the sum of all components measured) and of PM1
components during the campaign. The corresponding statis-tical values of the concentrations are summarized in Table S-1. During the entire campaign, the PM1 mass
concentra-tion was observed to be in a range of 2.4–150 µg m−3, with a mean value of 33.1 µg m−3. The PM1variation traced closely
(R2=0.86) the particle volume variation measured with a collocated Scanning Mobility Particle Sizer (SMPS, TSI Inc.) and calculated based on the size distribution between 15 and 600 nm in mobility diameter by assuming spherical par-ticles. The mass concentrations of PM1components also
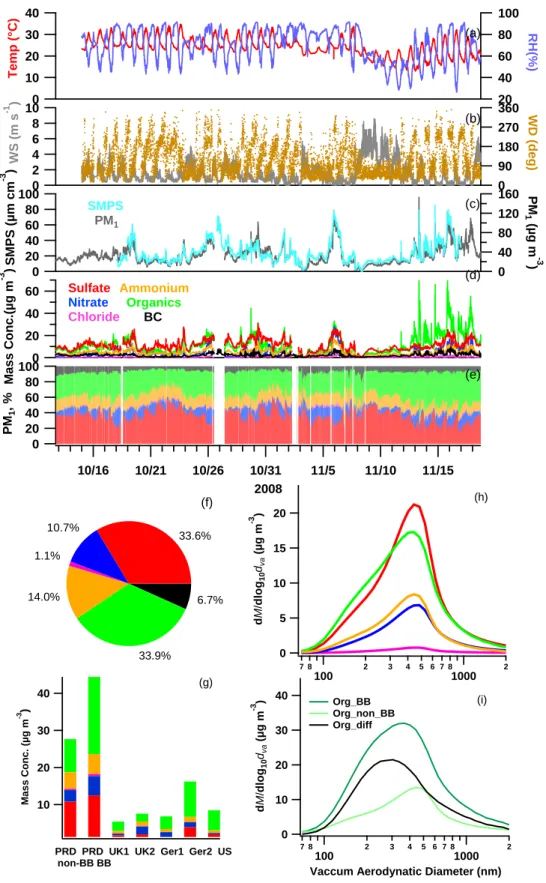
var-ied widely. On average, organics and sulfate had equal con-centrations of 11.2 µg m−3and together accounted for 67.5%
of the PM1mass (in Fig. 2f). Ammonium, nitrate, BC, and
chloride accounted for the rest 14.0, 10.7, 6.7, and 1.1% of the PM1 mass, respectively. It should be noted in this
pa-per that the BC mass fraction in PM1is likely overestimated
because BC was measured for PM2.5 by MAAP in the
cam-paign. During the cold front event (November 8–10), the concentrations of all PM1species showed continuous lower
concentrations as a result of higher wind speeds. After this cold front event, the meteorological conditions became back to normal and the PM1species concentrations became back
to higher levels. In addition, it is clearly seen that organ-ics reached and maintained at abnormally high concentration levels (even >50 µg/m3) after 12 November. The comparison
of average PM1compositions before and after 12 November
is shown in Fig. 2g, in which it is clearly seen that organ-ics increased by a factor of 2.3 times in ambient concentra-tion during the biomass burning period. A primary explana-tion for this high OA episode is that rice straw burning be-came prevalent in PRD after the rice harvest starting in mid November. More detailed analysis of contribution of biomass burning aerosol to OA is performed in Sect. 3.4.
Despite being a rural site, the average non-refractory PM1
(NR-PM1) mass concentration (29.5 µg m−3, without BC) at
10 8 6 4 2 0 WS ( m s -1 ) 10/16 10/21 10/26 10/31 11/5 11/10 11/15 2008 100 80 60 40 20 0 PM 1 , % 60 40 20 0 Mass Co nc. (µ g m -3 ) 160 120 80 40 0 PM 1 (µg m -3 ) 40 30 20 10 0 100 Tem p (° C) 80 60 40 20 RH (% ) 360 270 180 90 0 WD (deg) 100 80 60 40 20 0 SM PS ( µ m cm -3 ) Sulfate Nitrate Chloride SMPS PM1 (a) (b) (c) (d) (e) Ammonium Organics BC 40 30 20 10 Mass Conc. (µg m -3 )
PRD PRD UK1 UK2 Ger1 Ger2 US non-BB BB (g) 6.7% 33.9% 14.0% 1.1% 10.7% 33.6% (f) 20 15 10 5 0 d M /dlo g10 dva (µ g m -3 ) 7 8 100 2 3 4 5 6 7 8 1000 (h) 2 40 30 20 10 0 d M /dlog 10 dva (µg m -3 ) 7 8 100 2 3 4 5 6 7 8 1000 Org_BB Org_non_BB 2
Vaccum Aerodynatic Diameter (nm)
Org_diff
(i)
583
23
Fig. 2. The time series of (a) ambient temperature and relative humidity; (b) wind direction and wind speed; (c) PM1mass concentration
by AMS species+BC and SMPS volume; (d) PM1 species concentrations; (e) PM1percent composition; the average (f) PM1chemical
composition; (g) comparison of average species concentrations with other urban downwind sites; (h) mean species size distributions; and (i) mean OA size distributions during biomass burning period (after 12 November) and non-biomass burning period (before 12 November).
20 15 10 5 Mass Con c. (µg m -3 )
Diurnal Pattern of SO4 (5-95 % whiskers)
14 12 10 8 6 4 2
Diurnal Pattern of NO3 (5-95 % whiskers)
12 10 8 6 4 2
Diurnal Pattern of NH4 (5-95 % whiskers)
2.0 1.5 1.0 0.5 0.0 Mass Co nc. (µg m -3 )
Diurnal Pattern of Chl (5-95 % whiskers)
40 30 20 10 Mass Con c. (µg m -3 ) 00-01 01-02 02-03 03-04 04-05 05-06 06-07 07-08 08-09 09-10 10-11 11-12 12-13 13-14 14-15 15-16 16-17 17-18 18-19 19-20 20-21 21-22 22-23 23-24
Diurnal Pattern of Org (5-95 % whiskers) 6 5 4 3 2 1 00-01 01-02 02-03 03-04 04-05 05-06 06-07 07-08 08-09 09-10 10-11 11-12 12-13 13-14 14-15 15-16 16-17 17-18 18-19 19-20 20-21 21-22 22-23 23-24
Diurnal Pattern of BC (5-95 % whiskers)
592 593 594 595 596 597
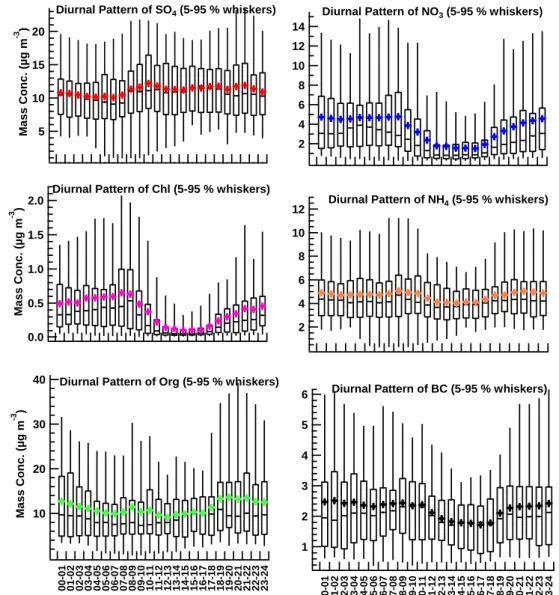
Fig. 3. Diurnal variation box plots of PM
1species. The upper and lower boundaries of
boxes indicate the 75
thand 25
thpercentiles; the line within the box marks the median;
the whiskers above and below boxes indicate the 90
thand 10
thpercentiles; and cross
symbols represent the means.
25
Fig. 3. Diurnal variation box plots of PM1species. The upper and lower boundaries of boxes indicate the 75th and 25th percentiles; the line
within the box marks the median; the whiskers above and below boxes indicate the 90th and 10th percentiles; and cross symbols represent the means.
Kaiping during normal days (i.e., before 12 November) is much higher than those observed in the atmospheres in devel-oped countries (below 20 µg m−3), including at five similar urban downwind sites in UK, US, and Germany (mostly be-low 10 µg m−3) (Zhang et al., 2007), as shown in Fig. 2g. In terms of NR-PM1components, Kaiping had a far higher
con-centration level for sulfate due to coal burning, which is still the primary energy source in China. On the other hand, the average NR-PM1mass concentration at Kaiping is less than
half of that in urban Beijing in summer (61 µg m−3) (Huang
et al., 2010).
Figure 2h presents the average species size distributions determined by the HR-ToF-AMS during the campaign. All the species generally showed a similar accumulation mode peaking at a large size of ∼450 nm, which is indicative of
aged regional aerosol (Allan et al., 2003; Alfarra et al., 2004; Zhang et al., 2005b). Their similar size distribution pat-terns suggest that most of them were likely internally mixed through gas-to-particle condensation processes during aging of the air mass, which is consistent with the fact that Kaip-ing was a downwind rural monitorKaip-ing site. Organics showed some additional mass distribution at smaller sizes of 100– 300 nm, suggesting significant input of fresh primary organic aerosols. In the case of this campaign, biomass burning aerosol is implied to be a major contributor to the organic mass at smaller sizes as analyzed in Sect. 3.4. To support this hypothesis, the mean OA size distributions during biomass burning period (after 12 November) and non-biomass burn-ing period (before 12 November) are compared in Fig. 2i. It is clearly seen that the peak of the OA size distribution
moved from 450 nm to 350 nm for the biomass burning pe-riod. The difference between them yielded an OA size distri-bution peaking at ∼300 nm, as shown in Fig. 2i, more clearly indicating the contribution from fresh emissions.
3.2 Diurnal patterns of PM1components
Figure 3 presents the diurnal variation patterns of different PM1 species in the form of box plot. In terms of the
av-erage cases, the PM1 species roughly exhibited two types
of patterns: sulfate, ammonium and organics showed rela-tively stable concentrations during the whole day; while ni-trate, chloride and black carbon showed significantly lower concentrations in the daytime. The higher planetary bound-ary layer (PBL) and wind speeds in the daytime should be crucial factors leading to effective dilution of air pollu-tants, and the semi-volatility of nitrate and chloride would further lower their daytime concentrations due to evapora-tion at higher temperatures (Zhang et al., 2005a; Salcedo et al., 2006; Hennigan et al., 2008; Zheng et al., 2008). The lowest concentrations of nitrate in the afternoon also sug-gest that the amount of its photochemical production could not overwhelm the simultaneous evaporation and dilution ef-fects. For less-volatile secondary sulfate, its daytime photo-chemical production might compensate the daytime dilution effect and made its concentration level relatively stable dur-ing the whole day. The diurnal variation of ammonium is a combined result of particulate (NH4)2SO4and NH4NO3. As
aerosol organic matter has both large primary and secondary sources and also large amounts of semi-volatile compounds, the observed diurnal variation of organics was a complex out-come of those of different types of organics, which will be provided and discussed in the next section. It is interesting to note that in the BC diurnal pattern there was an absence of a morning peak. The morning BC peak due to rush-hour traffic and low boundary layer was observed in many previ-ous urban studies (Lin et al., 2009; Han et al., 2009; Aiken et al., 2009). The missing morning BC peak in this campaign, however, is well consistent with the fact that Kaiping is free of significant local traffic emissions.
3.3 Elemental composition of organic aerosol
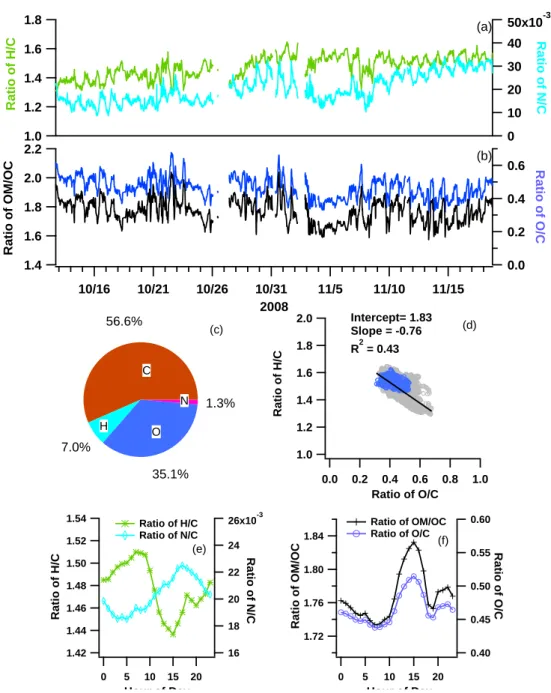
The high-resolution organic mass spectral dataset obtained are used to calculate the elemental composition and OM/OC (the ratio of organic mass/organic carbon mass) of OA fol-lowing the methods described previously (Aiken et al., 2007, 2008). Figure 4a and b show the variations of the atomic ra-tios of H/C, N/C and O/C and the mass ratio of OM/OC of OA during this campaign. On average, C, H, O, and N con-tributed 56.6, 7.0, 35.1, and 1.3% to the total organic mass, respectively, as shown in Fig. 4c. The H/C ratio varies in a range of 1.26–1.69, with a mean value of 1.48±0.08, while the O/C ratio varies in a range of 0.19–0.78, with a mean value of 0.47±0.07. The O/C ratio is regarded as a good
reference for oxidation state and photochemical age of or-ganic aerosols (Jimenez et al., 2009; Ng et al., 2010), and thus the variation of O/C in this campaign roughly reflects the variation of the aging level of OA at Kaiping. The N/C ratio ranges between 0.008 and 0.036, with a mean value of 0.02±0.01. A notable feature for the N/C variation is its sig-nificant elevation during the biomass burning period. The average N/C ratios before and after 12 November are 0.018 and 0.029, respectively, clearly indicating significant input of high N-containing OA during the biomass burning period. As shown in Fig. S1, the relative intensity of N-containing organic fragments significantly increased during the biomass burning period. However, the direct HR-ToF-AMS measure-ment of burning plumes of rice straw and five other biomass materials in laboratory by our group did not find N/C ratios of above 0.02 (He et al., 2010). Thus, the high N/C ratios observed near the end of the campaign are inferred to be pos-sibly due to secondary reactions of NH3and NOxwith
organ-ics in biomass burning plumes and/or simultaneous burning of high N-containing soil materials in the open field. An-other possibility is that, biomass burning in PRD may also include other high N-containing biomass materials that were not tested by He et al. (2010), since Laskin et al. (2009) have found high abundance of N-heterocyclic alkaloids in biomass burning aerosols in test burns of ponderosa pine in the US. The OM/OC ratio highly correlates with the O/C ratio (R2=0.98), having a mean value of 1.77±0.08. The OM/OC ratio has been extensively used to convert organic carbon mass to organic matter mass in filter-based aerosol chemistry studies, and 1.8 should be a reasonable approxi-mate OM/OC ratio for the Kaiping rural site based on the HR-ToF-AMS elemental analysis.
Figure 4d shows a Van Krevelen diagram (H/C versus O/C of OA) and an apparent anti-correlation with a slope of −0.76 was observed. The highlighted data points for the biomass burning period in Fig. 4d were mostly distributed in the upper left area, suggesting that the primary biomass burning orgnic aerosols usually had relatively lower O/C ratios but higher H/C ratios. This is consistent with the elemental composi-tion of the BBOA component extracted from PMF analysis of OA in the next section. The slope is a little shallower than those (about −1.0) observed in Riverside, the Central Ama-zon Basin, and Mexico City (Heald et al., 2010). As sug-gested by Heald et al. (2010), the shallower slope of OA in the Van Krevelen diagram can reflect different aging mech-anisms (such as greater tendency of alcohol addition) and/or relative mixes of fresh and aged air masses in the PRD envi-ronment.
Figure 4e and f present the average diurnal variations of H/C, N/C, O/C and OM/OC. Since the ratios are influenced by relative organic constitutions rather than absolute organic concentrations, their diurnal patterns should be mostly at-tributed to the diurnal changing of relative importance of dif-ferent sources. Both the O/C and OM/OC ratios start to in-crease at 9 a.m. in the morning, and reach a peak at 3 p.m.
1.54 1.52 1.50 1.48 1.46 1.44 1.42 R a tio of H/C 20 15 10 5 0 Hour of Day 26x10-3 24 22 20 18 16 R a tio of N/C Ratio of H/C Ratio of N/C (e) 1.84 1.80 1.76 1.72 R a tio of OM/OC 20 15 10 5 0 Hour of Day 0.60 0.55 0.50 0.45 0.40 Ratio of O/C Ratio of OM/OC Ratio of O/C (f) 0.6 0.4 0.2 0.0 R a ti o of O /C 10/16 10/21 10/26 10/31 11/5 11/10 11/15 2008 2.2 2.0 1.8 1.6 1.4 R atio of OM/ O C 1.8 1.6 1.4 1.2 1.0 R atio of H/ C 50x10-3 40 30 20 10 0 R a ti o of N/ C (a) (b) 56.6% 7.0% 35.1% 1.3% (c) C H O N 2.0 1.8 1.6 1.4 1.2 1.0 Ratio of H/C 1.0 0.8 0.6 0.4 0.2 0.0 Ratio of O/C Intercept= 1.83 Slope = -0.76 R2 = 0.43 (d) 598 599 600 601 602 603
Fig. 4. The time series of (a) H/C and N/C ratios; and (b) O/C and OM/OC ratios; (c)
the average mass-based organic elemental composition; (d) the Van Krevelen diagram
(with data points during biomass burning period highlighted with blue); the average
diurnal variations of (e) H/C and N/C ratios and (f) O/C and OM/OC ratios.
26
Fig. 4. The time series of (a) H/C and N/C ratios; and (b) O/C and OM/OC ratios; (c) the average mass-based organic elemental composition; (d) the Van Krevelen diagram (with data points during biomass burning period highlighted with blue); the average diurnal variations of (e)
H/C and N/C ratios and (f) O/C and OM/OC ratios.
in the afternoon when photochemistry is the most active to produce secondary organic aerosol (SOA) with high O/C ra-tios. The H/C ratio shows a reverse diurnal pattern to those of O/C and OM/OC as expected. The diurnal pattern of N/C starts to increase at 6 p.m. in the early morning and reaches a peak at 5 p.m. in the late afternoon, which is generally con-sistent with the daily activities time of local farmers. This may imply that the accumulation of biomass burning-related aerosols in the atmosphere due to daytime burning events could be responsible for the continuous daytime N/C ratio increase.
3.4 PMF analysis of organic matter composition
The PMF analysis based on the high-resolution mass spec-trum dataset observed in the campaign was performed for 1 to 8 factors, and the results and diagnostics are summa-rized in Table S2. It can be seen in the table that, PMF solu-tions with factor numbers greater than 3 resulted in splitting behavior of the existing factors, but provided no new dis-tinct factors. Based on all the qualified tests in Table S2, the three factor, FPEAK = 0, seed = 0 solution was chosen as the optimal solution for this analysis. The three organic
0.16 0.12 0.08 0.04 0.00 140 120 100 80 60 40 20
m/z (amu)
0.12 0.08 0.04 0.00 0.12 0.08 0.04 0.00Fract
ion of
O
A
Sign
al
CxHyNp + CxHy + CxHyOz + CxHyOzNp + HxO + BBOAO/C: 0.26
H/C: 1.62
N/C: 0.06
OM/OC: 1.55
SV-OOAO/C: 0.39
H/C: 1.48
N/C: 0.01
OM/OC: 1.65
LV-OOAO/C: 0.64
H/C: 1.30
N/C: 0.02
OM/OC: 1.99
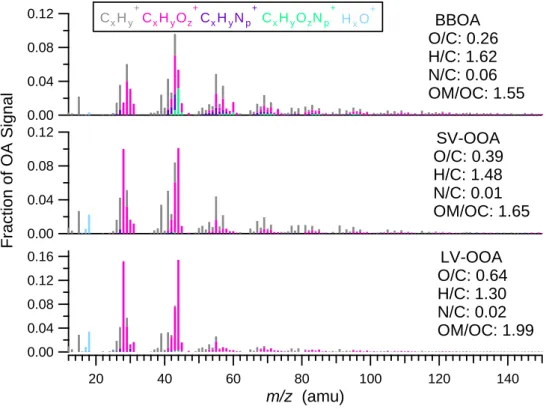
604 605 606Fig. 5. The MS profiles of the three OA components identified by PMF in this study.
27
Fig. 5. The MS profiles of the three OA components identified by PMF in this study.
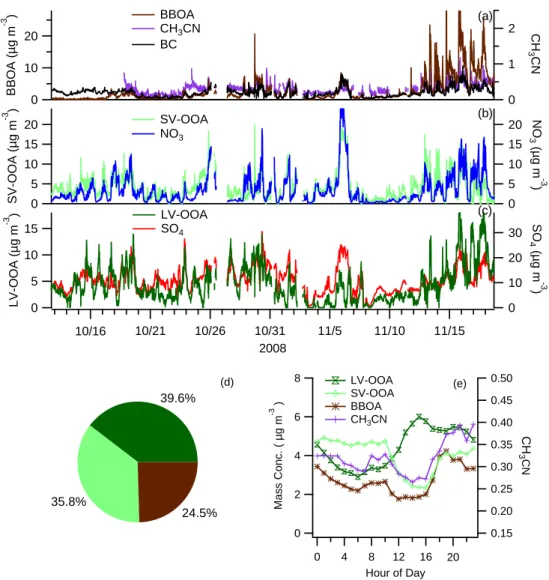
components identified in this campaign include a biomass burning (BBOA) and two oxygenated (SV-OOA and LV-OOA) organic aerosol components. Figure 5 shows the MS profiles of the three components and Fig. 6a–c present their time series during the campaign. The BBOA, LV-OOA and SV-OOA on average accounted for 24.5, 39.6 and 35.8% of the total organic mass, respectively, as shown in Fig. 6d. The representativeness of the different components identified will be examined for their MS signatures, correlation with trac-ers, and other characteristics in the following (Zhang et al., 2005b; Ulbrich et al., 2009).
The BBOA MS has an O/C ratio of 0.27 and is dis-tinguished by a prominent contribution of m/z 60, which is a good tracer ion for biomass burning-emitted aerosols (Alfarra et al., 2007; Aiken et al., 2009). The O/C ra-tio of the BBOA is similar to those (0.18–0.26) measured for laboratory-produced different primary biomass burning organic aerosols by our group, and the HR-MS of BBOA also showed high correlations with those of the primary OAs (R2=0.67–0.75) (He et al., 2010). The O/C ratio of the BBOA is also similar to that (0.30) of the BBOA identified in a similar PMF study of the AMS dataset measured in Mex-ico City (Aiken et al., 2009). In the PMF-resolved time se-ries of BBOA, as shown in Fig. 6a, the large elevation of the BBOA concentration after 12 November (ave. 9.12 µg m−3 compared to ave. 1.36 µg m−3before 12 November) is con-sistent with the fact that biomass burning smoke could be easily smelled at the sampling site during that time. The
identification of BBOA in this campaign was an expected re-sult because there are extensive farmlands around the Kaip-ing site and the farmers in PRD have the habit to burn off rice straw after the rice harvest around mid November. The time series of BBOA is compared to that of the collocated mea-surement of acetonitrile (in Fig. 6a), a well-known gaseous tracer for biomass burning emissions (de Gouw et al., 2003), using a Proton Transfer Reaction Mass Spectrometry (PTR-MS) (Yuan et al., 2010). The correlation between BBOA and acetonitrile (R2=0.60) is consistent with the
interpreta-tion that this component has a biomass burning source. Cor-relation between BC and BBOA (R2=0.49) and between BC and acetonitrile (R2=0.46) further indicate that biomass burning was an important source of BC at Kaiping.
The MS of the two OOA components had O/C ratios of 0.64 and 0.39, respectively, and were both characterized by prominent CxHyOz fragments, especially CO+2 (m/z 44),
suggesting large presence of oxidized organic compounds. OOAs have been extensively identified in previous factor analyses of AMS ambient aerosol datasets and shown to be a good surrogate of SOA (Zhang et al., 2005b, 2007; Jimenez et al., 2009; Ng et al., 2010). Two types of OOAs with dif-ferent O/C ratios have been observed in many places from urban, suburban, to rural ambient: the OOA with higher O/C, which is more oxidized and aged, is referred to as low-volatility OOA (LV-OOA); while the OOA with lower O/C, which is less oxidized and fresher, is referred to as semi-volatile OOA (SV-OOA) (Jimenez et al., 2009; Ng et al.,
30 20 10 0 SO 4 (µ g m -3 ) 10/16 10/21 10/26 10/31 11/5 11/10 11/15 2008 2 1 0 CH 3CN 20 10 0 BB O A ( µ g m -3 ) 20 15 10 5 0 SV-OOA (µg m -3 ) 15 10 5 0 LV-O OA (µg m -3 ) 20 15 10 5 0 NO 3 (µg m -3 ) SV-OOA NO3 LV-OOA SO4 BBOA CH3CN BC (a) (b) (c) 8 6 4 2 0 Mas s Co n c. ( µ g m -3 ) 20 16 12 8 4 0 Hour of Day 0.50 0.45 0.40 0.35 0.30 0.25 0.20 0.15 CH 3CN LV-OOA SV-OOA BBOA CH3CN (e) 39.6% 35.8% 24.5% (d) 607 608 609 610 611
Fig. 6. Time series of (a–c) the OA components and other relevant species; (d) the
average OA composition; and (e) the diurnal variations of the OA components and
acetonitrile.
28
Fig. 6. Time series of (a–c) the OA components and other relevant species; (d) the average OA composition; and (e) the diurnal variations
of the OA components and acetonitrile.
2010). OOA time trends typically correlate well with those of inorganic secondary aerosol species, with SV-OOA cor-relating best with nitrate due to the common semi-volatility and LV-OOA correlating best with sulfate due to the common low volatility (Docherty et al., 2008; Huffman et al., 2009; Jimenez et al., 2009; Ng et al., 2010). Based on the sum-marization of O/C ratio ranges of OOAs revealed in global AMS measurements, Ng et al. (2010) have shown a wide range of O/C ratio for both LV-OOA (0.73±0.14) and SV-OOA (0.35±0.14), reflecting the fact that there is a con-tinuum of OOA properties in ambient aerosols. The O/C ratios of the two OOA components identified in this cam-paign lie within the typical ranges for LV-OOA and SV-OOA, therefore they are referred to as LV-OOA and SV-OOA, re-spectively, following the existing terminology. In this cam-paign, the LV-OOA correlated best with sulfate (R2=0.42) rather than with nitrate (R2=0.13) while the SV-OOA cor-related best with nitrate (R2=0.65) rather than with sulfate
(R2=0.30), well consistent with the findings of some previ-ous AMS measurements (Lanz et al., 2007; Docherty et al., 2008; Ulbrich et al., 2009, Huffman et al., 2009). When con-sidering LV-OOA and SV-OOA together, the sum of them showed a quite high correlation with the sum of sulfate and nitrate (R2=0.78), further confirming their secondary nature of OOA.
It is interesting to note that a hydrocarbon-like (HOA) or-ganic aerosol component, typically distinguished by the ion series of CnH+2n+1and CnH+2n−1and low O/C ratios of <0.2
(Jimenez et al., 2009; Ng et al., 2010), is not identified in this PMF analysis. HOA has been extensively identified in previous AMS measurements and is mainly attributed to pri-mary combustion sources (Zhang et al., 2007; Lanz et al., 2007; Ulbrich et al., 2009). In this PMF analysis, increas-ing the number of PMF factors only resulted in splittincreas-ing of the OOA components, as shown in Table S2, and did not yield a new HOA-like component. The fact that a distinct
612
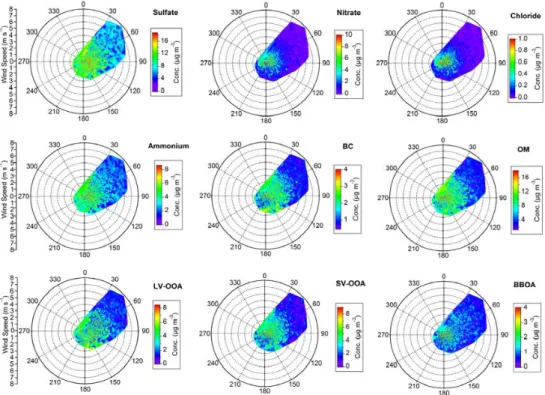
613 Fig. 7. The variation of PM1 component concentration with wind direction and speed.
29
Fig. 7. The variation of PM1component concentration with wind direction and speed.
HOA component was not extracted for this campaign is a re-sult of Kaiping being a rural site about 120 km away down-wind of the central PRD area. Previous studies have shown a sharp reduction in the HOA contribution to total OA loadings downwind of cities. As illustrated in Zhang et al. (2007), de Gouw et al. (2005), and Jimenez et al. (2009), HOA emit-ted from cities can be quickly diluemit-ted in regional air dom-inated by OOA and overwhelmed by SOA production. In addition, the HOA from the central PRD area could be oxi-dized quickly during transport because the atmospheric ox-idizing capacity in PRD was demonstrated to be unexpect-edly high (Hofzumahaus et al., 2009). Very small contribu-tions of HOA to total OA mass were identified at two similar urban downwind sites, i.e., Taunus, Germany and off New England coast, US, in previous AMS measurements and no HOA was identified in analyses of data from other remote sites (Jimenez et al., 2009).
As shown in Fig. 6e, the average diurnal patterns of the three OA components are also quite different and well con-sistent with their own origins. The BBOA showed a small morning peak and a large evening peak, which is similar to that of acetonitrile. This type of diurnal pattern could be reasonably attributed to the combined result of the low PBL heights and burning events in the morning and evening. The LV-OOA showed a continuous concentration increase in the daytime, reflecting its large photochemical production in the daytime. As LV-OOA is regarded as aged aerosol, it is in-ferred to be well mixed in PBL. Therefore, unlike the
near-ground emissions, the elevation of PBL in the daytime might not have a strong dilution effect on LV-OOA concentrations. In contrast to the LV-OOA, the diurnal variation of SV-OOA showed large concentration decease in the daytime, similar to that of nitrate, which should be the combined result of its semi-volatility and high PBL heights in the daytime. 3.5 Influence of meteorology on observed PM1
components
Wind plays a crucial role in dilution and transport of air pol-lution, which is especially the case in this study since the Kaiping site is a rural site downwind of the polluted cen-tral PRD area. In order to better understand the origins of PM1 at the Kaiping site, it is essential to study the
rela-tionship between the components concentrations and wind. Figure 7 plots the distribution of PM1 component
concen-tration versus wind direction and speed, which was mostly northeasterly during the sampling period in PRD. Generally, all the PM1components showed higher concentrations with
lower wind speeds but lower concentrations with higher wind speeds, reflecting the vital role of wind in diluting air pollu-tants. The contrast, however, was not identical for different PM1components. Sulfate concentrations were maintained at
medium levels even under higher wind speeds of >4 m s−1, indicating that sulfate was a quite regional pollutant that dispersed more uniformly in PRD. For nitrate and chlo-ride, their higher concentrations were constrained with weak
winds (about <2 m s−1), which implies either more local
production or more gas-to-particle condensation at lower wind speeds. Considering Kaiping was a rural site with less local emissions, more gas-to-particle condensation of HNO3
due to air pollutant accumulation under calm air conditions seems to be more plausible. Higher BBOA concentrations were mostly associated with wind speeds of <2 m s−1, de-noting the dominant role of local burning events. However, there are still some higher BBOA concentrations correspond-ing to wind speeds of >2 m s−1, suggesting that the regional transport of BBOA also existed. Other PM1components had
higher and relatively uniform concentrations associated with 0–4 m s−1 northeasterly wind, without even higher concen-trations under weak winds (<2 m s−1). This strongly sug-gests that regional transport from central PRD rather than lo-cal emission was the major origins of these PM1components
at the Kaiping site.
4 Conclusions
Based on the HR-ToF-AMS measurement at a rural site downwind of the highly-polluted central PRD area dur-ing October–November, 2008, the PM1 mass
concentra-tions in 10 min-resolution varied largely between 2.4 and 150 µg m−3, with a mean value of 33.1 µg m−3. Organics and sulfate were the most abundant species, each account-ing for ∼1/3 of the total mass, respectively. The high con-centration levels of PM1 mass and sulfate are a feature of
fine aerosol particles in PRD in comparison with other simi-lar measurements in developed countries. Secondary organic aerosol was found to dominate the OA at this rural site with the following characteristics: (1) the O/C ratio had a clear diurnal pattern that is consistent with that of photochemi-cal activity; (2) PMF analysis indicated that LV-OOA and SV-OOA totally accounted for about three quarters of the to-tal OA; (3) the sum of LV-OOA and SV-OOA showed high correlation with the sum of sulfate and nitrate, strongly con-firming their secondary nature. It is interestingly found that BBOA comprised a large OA fraction of about a quarter in this campaign, with its concentration highly elevated after 12 November due to the open field burning of crop residues after harvest in PRD. High N/C ratios were found to be closely as-sociated with biomass burning. Analysis of meteorological influence supported that regional transport from the central PRD area was the major origin of the PM1components
ob-served at this rural site.
Supplement related to this article is available online at: http://www.atmos-chem-phys.net/11/1865/2011/ acp-11-1865-2011-supplement.pdf.
Acknowledgements. This work was supported by the “863” project
(2006AA06A308) from the Ministry of Science and Technology of China, the National Natural Science Funds for Distinguished Young Scholar (21025728), and the National Natural Science Foundation of China (40805049, 20777001).
Edited by: C. K. Chan
References
Aiken, A. C., DeCarlo, P. F., and Jimenez, J. L.: Elemental analysis of organic species with electron ionization high-resolution mass spectrometry, Anal. Chem., 79, 8350–8358, 2007.
Aiken, A. C., Decarlo, P. F., Kroll, J. H., Worsnop, D. R., Huff-man, J. A., Docherty, K. S., Ulbrich, I. M., Mohr, C., Kim-mel, J. R., Sueper, D., Sun, Y., Zhang, Q., Trimborn, A., North-way, M., Ziemann, P. J., Canagaratna, M. R., Onasch, T. B., Al-farra, M. R., Prevot, A. S., Dommen, J., Duplissy, J., Metzger, A., Baltensperger, U., and Jimenez, J. L.: O/C and OM/OC ra-tios of primary, secondary, and ambient organic aerosols with high-resolution time-of-flight aerosol mass spectrometry, Envi-ron. Sci. Technol., 42, 4478–4485, 2008.
Aiken, A. C., Salcedo, D., Cubison, M. J., Huffman, J. A., De-Carlo, P. F., Ulbrich, I. M., Docherty, K. S., Sueper, D., Kim-mel, J. R., Worsnop, D. R., Trimborn, A., Northway, M., Stone, E. A., Schauer, J. J., Volkamer, R., Fortner, E., de Foy, B., Wang, J., Laskin, A., Shutthanandan, V., Zheng, J., Zhang, R., Gaffney, J., Marley, N. A., Paredes-Miranda, G., Arnott, W. P., Molina, L. T., Sosa, G., and Jimenez, J. L. : Mexico City aerosol analysis during MILAGRO using high resolution aerosol mass spectrom-etry at the urban supersite (T0)-Part 1: Fine particle composi-tion and organic source apporcomposi-tionment, Atmos. Chem. Phys., 9, 6633–6653, doi:10.5194/acp-9-6633-2009, 2009.
Alfarra, M. R., Coe, H., Allan, J. D., Bower, K. N., Boudries, H., Canagaratna, M. R., Jimenez, J. L., Jayne, J. T., Garforth, A. A., Li, S. -M., and Worsnop, D. R.: Characterization of urban and ru-ral organic particulate in the lower Fraser valley using two aero-dyne aerosol mass spectrometers, Atmos. Environ., 38, 5745– 5758, 2004.
Alfarra, M. R., Prevot, A. S. H., Szidat, S., Sandradewi, J., Weimer, S., Lanz, V. A., Schreiber, D., Mohr, M., and Baltensperger, U.: Identification of the mass spectral signature of organic aerosols from wood burning emissions, Environ. Sci. Technol., 41, 5770– 5777, 2007.
Allan, J. D., Alfarra, M. R., Bower, K. N., Williams, P. I., Gal-lagher, M. W., Jimenez, J. L., McDonald, A. G., Nemitz, E., Canagaratna, M. R., Jayne, J. T., Coe, H., and Worsnop, D. R.: Quantitative sampling using an Aerodyne AerosolMass Spec-trometer. Part 2: Measurements of fine particulate chemical com-position in two UK Cities, J. Geophys. Res.-Atmos., 108, 4091, doi:10.1029/2002JD002359, 2003.
Canagaratna, M. R., Jayne, J. T., Jimenez, J. L., Allan, J. D., Alfarra, M. R., Zhang, Q., Onasch, T. B., Drewnick, F., Coe, H., Middle-brook, A., Delia, A., Williams, L. R., Trimborn, A. M., North-way, M. J., DeCarlo, P. F., Kolb, C. E., Davidovits, P., and Worsnop, D. R.: Chemical and microphysical characterization of ambient aerosols with the aerodyne aerosol mass spectrome-ter, Mass Spectrom. Rev., 26, 185–222, 2007.
de Gouw, J. A., Warneke, C., Parrish, D. D., Holloway, J. S., Trainer, M., and Fehsenfeld, F. C.: Emission sources and ocean uptake of acetonitrile (CH3CN) in the atmosphere, J. Geophys. Res., 108(D11), 4329, doi:10.1029/2002JD002897, 2003. de Gouw, J. A., Middlebrook, A. M., Warneke, C., Goldan, P.
D., Kuster, W. C., Roberts, J. M., Fehsenfeld, F. C., Worsnop, D. R., Canagaratna, M. R., Pszenny, A. A. P., Keene, W. C., Marchewka, M., Bertman, S. B., and Bates, T. S.: Budget of organic carbon in a polluted atmosphere: results from the New England Air Quality Study in 2002, J. Geophys. Res-Atmos., 110, D16305, doi:16310.11029/12004JD005623, 2005. DeCarlo, P. F., Kimmel, J. R., Trimborn, A., Northway M.
J., Jayne, J. T., Aiken, A. C., Gonin, M., Fuhrer, K., Hor-vath, T., Docherty, K. S., Worsnop, D. R., and Jimenez, J. L.: Field-deployable, high-resolution time-of-flight aerosol mass spectrometer, Anal. Chem., 78, 8281–8289, 2006.
DeCarlo, P. F., Ulbrich, I. M., Crounse, J., de Foy, B., Dunlea, E. J., Aiken, A. C., Knapp, D., Weinheimer, A. J., Campos, T., Wennberg, P. O., and Jimenez, J. L.: Investigation of the sources and processing of organic aerosol over the Central Mex-ican Plateau from aircraft measurements during MILAGRO, At-mos. Chem. Phys., 10, 5257–5280, doi:10.5194/acp-10-5257-2010, 2010.
Docherty, K. S., Stone, E. A., Ulbrich, I. M., DeCarlo, P. F., Sny-der, D. C., Schauer, J. J., Peltier, R. E., Weber, R. J., Murphy, S. M., Seinfeld, J. H., Grover, B. D., Eatough, D. J., and Jimenez, J. L.: Apportionment of primary and secondary organic aerosols in Southern California during the 2005 Study of Organic Aerosols in Riverside (SOAR-1), Environ. Sci. Technol., 42, 7655–7662, 2008.
Drewnick, F., Hings, S. S., DeCarlo, P., Jayne, J. T., Gonin, M., Fuhrer, K., Weimer, S., Jimenez, J. L., Demerjian, K. L., Bor-rmann, S., and Worsnop, D. R.: A new time-of-flight aerosol mass spectrometer (TOF-AMS)-Instrument description and first field deployment, Aerosol. Sci. Tech., 39, 637–658, 2005. Hagler, G. S. W., Bergin, M. H., Salmon, L. G., Yu, J. Z., Wan, E. C.
H., Zheng, M., Zeng, L. M., Kiang, C. S., Zhang, Y. H., Lau, A. K. H., and Schauer, J. J.: Source areas and chemical composition of fine particulate matter in the Pearl River Delta region of China, Atmos. Environ., 40, 3802–3815, 2006.
Han, S., Kondo, Y., Oshima, N., Takegawa, N., Miyazaki, Y., Hu, M., Lin, P., Deng, Z., Zhao, Y., Sugimoto, N., and Wu, Y.: Tem-poral variations of elemental carbon in Beijing, J. Geophys. Res.-Atmos., 114, D23202, doi:10.1029/2009JD012027, 2009. He, L.-Y., Lin, Y., Huang, X.-F., Guo, S., Xue, L., Su, Q., Hu,
M., Luan, S.-J., and Zhang, Y.-H.: Characterization of high-resolution aerosol mass spectra of primary organic aerosol emis-sions from Chinese cooking and biomass burning, Atmos. Chem. Phys., 10, 11535–11543, doi:10.5194/acp-10-11535-2010, 2010. Heald, C. L., Kroll, J. H., Jimenez, J. L., Docherty, K. S., DeCarlo, P. F., Aiken, A. C., Chen, Q., Martin, S. T., Farmer, D. K., and Artaxo, P.: A simplified description of the evolution of organic aerosol composition in the atmosphere, Geophys. Res. Lett., 37, L08803, doi:10.1029/2010GL042737, 2010.
Hennigan, C. J., Sullivan, A. P., Fountoukis, C. I., Nenes, A., Heco-bian, A., Vargas, O., Case Hanks, A. T., Huey, L. G., Lefer, B. L., Russell, A. G., and Weber, R. J.: On the volatility and pro-duction mechanisms of newly formed nitrate and water soluble organic aerosol in Mexico City, Atmos. Chem. Phys., 8, 3761–
3768, doi:10.5194/acp-8-3761-2008, 2008.
Hofzumahaus, A., Rohrer, F., Lu K., Bohn, B., Brauers, T., Chang, C. C., Fuchs, H., Holland, F., Kita, K., Kondo, Y., Li, X., Lou, S., Shao, M., Zeng, L., Wahner, A., and Zhang, Y.: Amplified trace gas removal in the troposphere, Science, 324, 1702–1704, 2009. Huang, X.-F., He, L.-Y., Hu, M., Canagaratna, M. R., Sun, Y., Zhang, Q., Zhu, T., Xue, L., Zeng, L.-W., Liu, X.-G., Zhang, Y.-H., Jayne, J. T., Ng, N. L., and Worsnop, D. R.: Highly time-resolved chemical characterization of atmospheric submi-cron particles during 2008 Beijing Olympic Games using an Aerodyne High-Resolution Aerosol Mass Spectrometer, Atmos. Chem. Phys., 10, 8933-8945, doi:10.5194/acp-10-8933-2010, 2010.
Huffman, J. A., Docherty, K. S., Aiken, A. C., Cubison, M. J., Ul-brich, I. M., Decarlo, P. F., Sueper, D., Jayne, J. T., Worsnop, D. R., Ziemann, P. J., and Jimenez, J. L.: Chemically resolved aerosol volatility measurements from two megacity field studies, Atmos. Chem. Phys., 9, 7161–7182, doi:10.5194/acp-9-7161-2009, 2009.
Jayne, J. T., Leard, D. C., Zhang, X. F., Davidovits, P., Smith, K. A., Kolb, C. E., and Worsnop, D. R.: Development of an aerosol mass spectrometer for size and composition analysis of submi-cron particles, Aerosol. Sci. Tech., 33, 49–70, 2000.
Jimenez, J. L., Jayne, J. T., Shi, Q., Kolb, C. E., Worsnop, D. R., Yourshaw, I., Seinfeld, J. H., Flagan, R. C., Zhang, X.-F., Smith, K. A., Morris, J. W., and Davidovits, P.: Ambient aerosol sampling using the Aerodyne Aerosol Mass Spectrometer, J. Geophys. Res.-Atmos., 108, 8425, doi:10.1029/2001JD001213, 2003.
Jimenez1, J. L., Canagaratna, M. R., Donahue, N. M., Prevot, A. S. H., Zhang, Q., Kroll, J. H., DeCarlo, P. F., Allan, J. D. , Coe, H., Ng, N. L., Aiken, A. C., Docherty, K. S., Ulbrich, I. M., Grieshop, A. P., Robinson, A. L., Duplissy, J., Smith, J. D., Wil-son, K. R., Lanz, V. A., Hueglin, C., Sun, Y. L., Tian, J., Laakso-nen, A., RaatikaiLaakso-nen, T., RautiaiLaakso-nen, J., Vaattovaara, P., Ehn, M., Kulmala, M., Tomlinson, J. M., Collins, D. R., Cubison, M. J., Dunlea, E. J., Huffman, J. A., Onasch, T. B., Alfarra, M. R., Williams, P. I., Bower, K., Kondo, Y., Schneider, J., Drewnick, F., Borrmann, S., Weimer, S., Demerjian, K., Salcedo, D., Cot-trell, L., Griffin, R., Takami, A., Miyoshi, T., Hatakeyama, S., Shimono, A., Sun, J. Y., Zhang, Y. M., Dzepina, K., Kimmel, J. R., Sueper, D., Jayne, J. T., Herndon, S. C., Trimborn, A. M., Williams, L. R., Wood, E. C., Middlebrook, A. M., Kolb, C. E., Baltensperger, U., and Worsnop, D. R.: Evolution of organic aerosols in the atmosphere, Science, 326, 1525–1529, 2009. Kroll, J. H., Smith, J. D., Che, D. L., Kessler, S. H., Worsnop, D. R.,
and Wilson, K. R.: Measurement of fragmentation and function-alization pathways in the heterogeneous oxidation of oxidized or-ganic aerosol, Phys. Chem. Chem. Phys., 11, 8005–8014, 2009. Lanz, V. A., Alfarra, M. R., Baltensperger, U., Buchmann, B.,
Hueglin, C., and Pr´evˆot, A. S. H.: Source apportionment of submicron organic aerosols at an urban site by factor analyti-cal modelling of aerosol mass spectra, Atmos. Chem. Phys., 7, 1503–1522, doi:10.5194/acp-7-1503-2007, 2007.
Laskin, A., Smith, J. S., and Laskin, J.: Molecular characterization of nitrogen-containing organic compounds in biomass burning aerosols using high-resolution mass spectrometry, Environ. Sci. Technol., 43, 3764–3771, 2009.
N., Miyazaki, Y., Zhao, Y., and Sugimoto, N.: Seasonal and diur-nal variations of organic carbon in PM2.5in Beijing and the
es-timation of secondary organic carbon, J. Geophys. Res.-Atmos., 114, D00G11, doi:10.1029/2008JD010902, 2009.
Ng, N. L., Canagaratna, M. R., Zhang, Q., Jimenez, J. L., Tian, J., Ulbrich, I. M., Kroll, J. H., Docherty, K. S., Chhabra, P. S., Bahreini, R., Murphy, S. M., Seinfeld, J. H., Hildebrandt, L., Donahue, N. M., Decarlo, P. F., Lanz, V. A., Pr´evˆot, A. S. H., Dinar, E., Rudich, Y., and Worsnop, D. R.: Organic aerosol components observed in Northern Hemispheric datasets from Aerosol Mass Spectrometry, Atmos. Chem. Phys., 10, 4625– 4641, doi:10.5194/acp-10-4625-2010, 2010.
Paatero, P. and Hopke, P. K.: Discarding or downweighting high-noise variables in factor analytic models, Anal. Chim. Acta, 490, 277–289, 2003.
Paatero, P. and Tapper, U.: Positive Matrix Factorization-a Nonneg-ative Factor Model with Optimal Utilization of Error-Estimates of Data Values, Environmetrics, 5, 111–126, 1994.
Salcedo, D., Onasch, T. B., Dzepina, K., Canagaratna, M. R., Zhang, Q., Huffman, J. A., Decarlo, P. F., Jayne, J. T., Mor-timer, P., Worsnop, D. R., Kolb, C. E., Johnson, K. S., Zuberi, B., Marr, L. C., Volkamer, R., Molina, L. T., Molina, M. J., Car-denas, B., Bernab´e, R. M., M´arquez, C., Gaffney, J. S., Marley, N. A., Laskin, A., Shutthanandan, V., Xie, Y., Brune, W., Lesher, R., Shirley, T., and Jimenez, J. L.: Characterization of ambient aerosols in Mexico City during the MCMA-2003 campaign with Aerosol Mass Spectrometry: results from the CENICA Super-site, Atmos. Chem. Phys., 6, 925–946, doi:10.5194/acp-6-925-2006, 2006.
Streets, D., Yu, C., Bergin, M., Wang, X., and Carmichael, G. R.: Modeling study of air pollution due to the manufacture of export goods in China’s Pearl River Delta, Environ. Sci. Technol., 40, 2099–2107, 2006.
Ulbrich, I. M., Canagaratna, M. R., Zhang, Q., Worsnop, D. R., and Jimenez, J. L.: Interpretation of organic components from Posi-tive Matrix Factorization of aerosol mass spectrometric data, At-mos. Chem. Phys., 9, 2891–2918, doi:10.5194/acp-8-2891-2009, 2009.
Yuan, B., Liu, Y., Shao, M., Lu, S. -H., and Streets, D. G.: Biomass Burning Contributions to Ambient VOCs Species at a Receptor Site in the Pearl River Delta (PRD), China, Environ. Sci. Tech-nol., 44(12), 4577–4582, 2010.
Zhang, Q., Canagaratna, M. R., Jayne, J. T., Worsnop, D. R., and Jimenez, J. -L.: Time- and size-resolved chemical composition of submicron particles in Pittsburgh: Implications for aerosol sources and processes, J. Geophys. Res.-Atmos., 110, D07S09, doi:10.1029/2004JD004649, 2005a.
Zhang, Q., Worsnop, D. R., Canagaratna, M. R., and Jimenez, J. L.: Hydrocarbon-like and oxygenated organic aerosols in Pitts-burgh: insights into sources and processes of organic aerosols, Atmos. Chem. Phys., 5, 3289–3311, doi:10.5194/acp-5-3289-2005, 2005b.
Zhang, Q., Jimenez, J. L., Canagaratna, M. R., Allan, J. D., Coe, H., Ulbrich, I., Alfarra, M. R., Takami, A., Middlebrook, A. M., Sun, Y. L., Dzepina, K., Dunlea, E., Docherty, K., De-Carlo, P. F., Salcedo, D., Onasch, T., Jayne, J. T., Miyoshi, T., Shimono, A., Hatakeyama, S., Takegawa, N., Kondo, Y., Schneider, J., Drewnick, F., Borrmann, S., Weimer, S., Demer-jian, K., Williams, P., Bower, K., Bahreini, R., Cottrell, L., Griffin, R. J., Rautiainen, J., Sun, J. Y., Zhang, Y. M., and Worsnop, D. R.: Ubiquity and dominance of oxygenated species in organic aerosols in anthropogenically-influenced Northern Hemisphere midlatitudes, Geophys. Res. Lett., 34, L13801, doi:10.1029/2007GL029979, 2007.
Zhang, Y. H., Hu M., Zhong L. J., Wiedensohler, A., Liu, S. C., Andreaee, M. O., Wang, W., and Fang, S. J.: Regional Inte-grated Experiments on Air Quality over Pearl River Delta 2004 (PRIDE-PRD2004): Overview, Atmos. Environ., 42(25), 6157-6173, 2008.
Zheng, J., Zhang, R., Fortner, E. C., Molina, L., Aiken, A. C., Jimenez, J. L., G¨aggeler, K., Dommen, J., Dusanter, S., Stevens, P. S., and Tie, X.: Measurements of HNO3 and N2O5
us-ing ion drift-chemical ionization mass spectrometry durus-ing the MILAGRO/MCMA-2006 campaign, Atmos. Chem. Phys., 8, 6823–6838, doi:10.5194/acp-8-6823-2008, 2008.
![Copper‐Rich Thermoelectric Sulfides: Size‐Mismatch Effect and Chemical Disorder in the [TS4]Cu6 Complexes of Cu26T2Ge6S32 (T=Cr, Mo, W) Colusites](data:image/gif;base64,R0lGODlhAQABAIAAAP///wAAACH5BAEAAAAALAAAAAABAAEAAAICRAEAOw==)