HAL Id: halshs-00979191
https://halshs.archives-ouvertes.fr/halshs-00979191
Preprint submitted on 15 Apr 2014HAL is a multi-disciplinary open access
archive for the deposit and dissemination of sci-entific research documents, whether they are pub-lished or not. The documents may come from teaching and research institutions in France or abroad, or from public or private research centers.
L’archive ouverte pluridisciplinaire HAL, est destinée au dépôt et à la diffusion de documents scientifiques de niveau recherche, publiés ou non, émanant des établissements d’enseignement et de recherche français ou étrangers, des laboratoires publics ou privés.
Public expenses, credit and natural capital: Substitution
or complementarity?
Jean-Louis Combes, Pascale Combes Motel, Philippe Delacote
To cite this version:
Jean-Louis Combes, Pascale Combes Motel, Philippe Delacote. Public expenses, credit and natural capital: Substitution or complementarity?. 2014. �halshs-00979191�
C E N T R ED'É T U D E S E TD ER E C H E R C H E S S U RL ED É V E L O P P E M E N T I N T E R N AT I O N A L
SERIE ETUDES ET DOCUMENTS DU CERDI
Public expenses, credit and natural capital:
Substtuton or complementarity?
Jean-Louis COMBES
Philippe DELACOTE
Pascale MOTEL-COMBES
Etudes et Documents
n° 09
4 avril 2014
CERDI 65 BD. F. MITTERRAND63000 CLERMONTFERRAND - FRANCE TÉL. 04 73 17 74 00
Etudes et Documents
n° 09, CERDI, 2014
The authors
Jean-Louis Combes
Professeur, Clermont Université, Université d'Auvergne, CNRS, UMR 6587, CERDI, F-63009
Clermont Fd
Email:
[email protected]
.
Philippe DELACOTE
Chargé de recherche, INRA, UMR 356, Economie forestère, 54000 Nancy, France
AgroParisTech, Laboratoire d'économie forestère, 54000 Nancy, France
Chaire d'économie du Climat, Paris, France
Email : [email protected]
Pascale MOTEL-COMBES
Professeur, Clermont Université, Université d'Auvergne, CNRS, UMR 6587, CERDI, F-63009
Clermont Fd
Email: [email protected].
Corresponding author : [email protected]
La série des Etudes et Documents du CERDI est consultable sur le site :
htp://www.cerdi.org/ed
Directeur de la publicaton : Vianney Dequiedt
Directeur de la rédacton : Catherine Araujo Bonjean
Responsable d’éditon : Annie Cohade
Etudes et Documents
n° 09, CERDI, 2014
Avertssement :
Les commentaires et analyses développés n’engagent que leurs auteurs qui restent
seuls responsables des erreurs et insufsances.
Etudes et Documents
n° 09, CERDI, 2014
Abstract
Improving access to capital through credit and public spendings is an important step
toward development and poverty alleviaton. At the same tme, deforestaton-related
actvites, like agricultural expansion, can be seen as relying on natural capital, through the
depleton of forest resources and the use of land in an extensive way. It is then important to
beter understand how a beter access to capital infuence the use of land as a natural
capital. This paper assesses the relatonship between fnancial development, public
spendings and deforestaton. Are they substtute or complement? Our econometric analysis
shows that deforestaton is positvely correlated to access to credit and public spendings,
which gives some evidence that natural capital is a complement to credit and public
spendings.
Mots clés / Key Words: deforestaton, development, credit, public spendings.
Codes JEL / JEL classifcaton: C21, O13, Q33
Acknowledgements / Remerciements
This paper has been presented at the 2012 CERDI conference on ''Environment and
Natural Resources Management in Developing and Transition Economies'' (Clermont Ferrand,
France, October 2012) and at the 2013 EAERE conference (Toulouse, France, June 2013). We
thank participants for their valuable comments.
1
Introduction
While deforestation is a crucial environmental concern worldwide, it also represents a source of income for many agents and communities, since it results in agricultural expansion and timber harvest (Celentano et al. (2012)). In this sense, deforestation can be considered as the use of natural capital (land and forest resources) on the development path by agents lacking of other capital opportunities (Azqueta and Sotelsek (2007)). Indeed, in developing countries natural capital represents a larger part of their wealth than in developed ones (Ruta and Hamilton 2007; World Bank (The) 2006).
Using natural capital for development purposes may be related to the issue of complementarity or substitutability between deforestation and man-made capital that has been investigated and debated in the literature (see among others, Barbier (2003)). Optimal growth models have been extended by some authors (e.g. Dasgupta and Heal, 1974; Solow, 1974; Stiglitz, 1974) where the conditions of technical progress and substitution between natural capital and material capital are analyzed. Their approach implicitly suggests that substitution between natural and material capi-tal can create the conditions of unbounded economic development, even in a world with exhaustible resources i.e. finite natural capital. This view has been challenged by proponents of strong sustain-ability who after Daly and Georgescu-Roegen argue in favor of maintaining each type of capital (Daly and Townsend 1993; Daly 1997). For instance, Jouvet and DePerthuis (2012) argue that natural capital depletion can affect the marginal productivity of the whole economy. The Meadows Reports or more recently Diamond gave examples of unsustainable and collapsing societies which have relied too heavily on natural capital depletion (Meadows et al. 1972; Meadows et al. 2005; Diamond 2013).
In this paper, we intend to go further the weak versus strong sustainability debate by considering how man-made capital that encompasses credit and public spending has an effect on deforestation. Improving access to credit may be seen as a key issue to help rural communities to develop, as credit constraints are an important barrier to development (Anjini (1997)) and the development of credit markets an important factor of growth (Hung and Cothren (2002)). Several papers have been considering empirically the impact of the development of credit banking on the efficiency of investments (Odedokun (1996)). Ge and Qiu (2007) suggest that informal capital can be a substitute to formal capital when credit markets are poorly developed. Following Rudel and Roper (1997), Geist and Lambin (2001) argue that deforestation may be capital driven. Some studies in Latin America do find evidence that access to credit favors more deforestation-related activities
than the others (Barbier and Burgess, 1996; Pfaff, 1997). In contrast, Godoy et al. (1997) consider in their studies on Bolivia and Honduras that families with a better access to credit are less forest-dependent than others. Finally, Monela (1995) finds a positive relationship between credit availability and forest clearing in Tanzania.
Government expenditures have also often been thought to foster deforestation (e.g. Angelsen and Kaimowitz 1999; Geist and Lambin 2001). Several authors have evidenced the role of transport infrastructures (e.g. Pfaff, 1999). In a similar vein, Bulte et al. (2007) show that rural subsidies towards large farmers triggered deforestation in Latin America. At last, Galinato and Galinato (2013) evidence a positive impact of government spending on deforestation. Interestingly they do not confirm the effect of a composition effect: the provision of public goods has no effect on deforestation. Perhaps, one possible explanation of the results is whether there is an omitted variable.
A crucial question is whether public spending and access to credit jointly affect deforestation process. In this paper, we try to fill a gap in the literature by exploring the simultaneous effect of credit and public spending, which both contribute to man-made capital, on deforestation. Does this capital substitute or complement to natural capital?
We argue that assessing the impact of public spending (access to credit) on deforestation cannot be made without considering access to credit (public spending). Indeed, the link between credit and public spending is well established in the macro-economic literature. On the one hand, there could exist a crowding in effect à la Barro (Barro 1990). Under that hypothesis, private production depends on both credit and productive government expenditures which considered as an input to private production. Marginal productivity of private capital is therefore positively affected by public spending. On the other hand, a crowding out effect can be put forward according to which an increase in public spending dries out the credit available to private agents. The rest of this paper is organized as follows. We define first the kinds of mechanism that relate deforestation to credit and public spending. Then we assess the nature of this relationship, using panel-data analysis relating credit development and public spending to deforestation. Section 2 presents a simple model of substitutability and complementarity between deforestation and man-made capital. Section 3 presents our econometric analysis, and section 4 concludes.
2
A simple model of capital input and net income maximization
In this section, we investigate the channels by which a better access to private capital or public spendings may be related to deforestation. Consider a representative agent, that maximizes its net income:
max
D,K,δI(D, K, δ) = A(D, δK) + O((1 − δ)K) − c(D) − c(K) (1)
Net income is derived from the agents’ economic activities, that depend on its access to two types of assets: natural capital, through deforestation D, and made-man capital (henceforth called capital) K. By this term, we mean here capital requiring both credit and public expenses that benefit to agents 1. Income A(D, δK) comes from activities related to deforestation (agricultural expansion, timber harvesting, fuelwood collection...), while income O((1 − δ)K) comes from ac-tivities not related to deforestation (subsidies to direct consumption, agricultural intensification, trade and business, work to the city...). δ is the share of capital allocated to deforestation-related activities. We assume here standard properties2: Ai ≥0, Aii≤0, ∀i = D, K; OK ≥0, OKK ≤0.
The costs function that are defined in equation 1 are increasing and convex: : ci ≥0, cii≥0,
∀i = D, K. The cost of access to natural capital is related to property rights, as well as to the availability of the resource: Are forests open access? Are property rights safe and well defined? Are forests a scarce resource? The cost of credit is related to the level of financial development, credit supply and public expenses in the country: Is credit easily accessible to rural communities? Is credit supply abundant? Which citizens are targeted by redistributive policies?
First-order conditions implicitly give the level of deforestation D∗, capital K∗ and share of capital allocated to deforestation-related activities δ∗:
X = AD−cD = 0 (2)
Y = δAK+ (1 − δ)OK−cK = 0 (3)
Z = KAK−KOK = 0 (4)
Equation 2 indicates that deforestation D∗ increases with its marginal productivity and de-creases with its marginal cost. Equation 3 shows that capital K∗ is chosen in order to equal marginal productivity and marginal cost of capital. Equation 4 defines the allocation of capital δ∗ as the equalization of the marginal productivity of capital between deforestation-related and deforestation-unrelated activities.
1Those two kinds of capital will be distinguished in the empirical section. 2The subscripts refer to first and second derivatives.
In this context, if there is some development of the financial system, an increase in credit supply or an increase in public expenses that result in a decrease of the marginal cost of capital, it is likely to have an indirect impact on deforestation. First, looking at equation 3 and applying the implicit function theorem, the decrease in marginal cost of capital tends to increase the access to capital for the agent:
K∗ cK = − YcK YK∗ = 1 δ∗AKK+ (1 − δ∗)OKK−cKK <0 (5) Second, from equation 4, this increased access to capital changes its allocation between deforestation-related and deforestation-unrelated activities:
δ∗ K∗ = − ZK∗ Zδ∗ = −δ∗AKK−(1 − δ∗)OKK KAKK + KOKK (6)
The denominator being unambiguously negative, the sign of equation 6 is the one of the nom-inator. Therefore, we can see that the share of capital allocated to deforestation-related activities increases if the marginal productivity of those activities decreases more slowly than the one of deforestation-unrelated activities. In other words, the agents allocate a larger part of capital to deforestation-related activities if the related additional amount of capital is more productive in those activities than in deforestation-unrelated activities.
Third, using equation 2, it is possible to see what could be the end-of-pipe effect of an increase in access to capital on deforestation:
D∗ (δ∗K∗)= − X(δ∗K∗) XD∗ = −δ ∗A DK −cDK ADD−cDD (7)
Here again, the denominator is unambiguously negative. Therefore, an increase in capital allocated to deforestation-related activities tends to increase deforestation if the net marginal pro-ductivity of deforestation is increasing in capital allocated.
Overall, this two-steps relationship defines the impact of an increased access to capital on deforestation. Deforestation may be positively related to better access to capital if :
• an increased access to capital increases the profitability of deforestation-related activities more than the one of deforestation-unrelated activities and capital and deforestation are complement: δ∗AKK−(1 − δ∗)OKK >0, δ∗ADK −cDK >0;
• an increased access to capital increases the profitability of deforestation-unrelated activities more than the one of deforestation-related ones and capital and deforestation are substitute: δ∗AKK −(1 − δ∗)OKK <0, δ∗ADK −cDK <0. Although this case is theoretically possible, it is quite unlikely in real life, as an increased in access to capital is likely to increase the marginal profitability of deforestation, mainly through machinery.
Since the first case is more likely than the second one, we consider that observing a positive relationship between deforestation and access to capital describes a situation of complementar-ity between natural capital and made-man capital, while a situation of substitutabilcomplementar-ity will be considered in the case of a negative relationship.
Within this very simple model, the term "capital" encompasses both credit and public expenses. However, those two types of asset may have diverse relationships with deforestation. Moreover, as better access to credit and better management of public spendings is a crucial interest in the implementation of development policies, it is important to investigate those relationships, whether deforestation tends to be positively or negatively related to access to those two other forms of capital.
3
The empirical analysis of deforestation, credit, and public
spendings
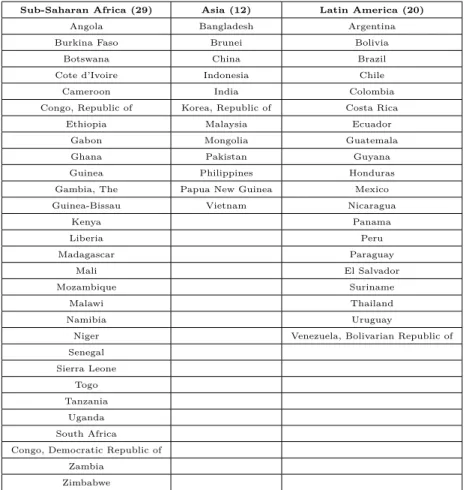
Data and econometric specifications are described first, then the results are presented and discussed. Regressions are run on a sample of forested developing countries in Asia, Latin America as well as Sub-Saharan Africa excepted small islands of which forested areas are negligible.3
3.1 Data set
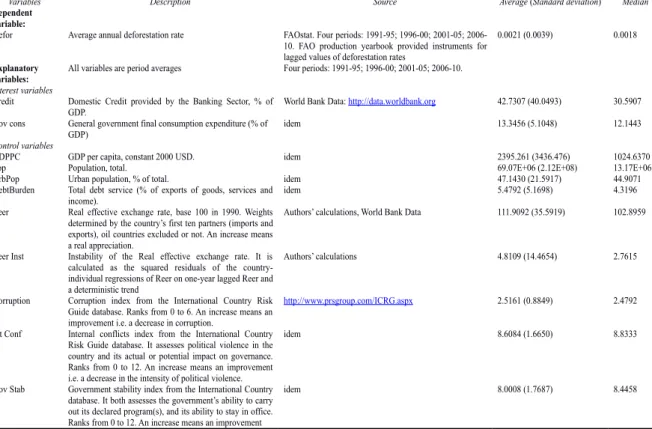
The rate of deforestation from FAOstat databases is the dependent variable, measured over the 1990 2010 period. Other variables are either from the World Bank Indicators or the PRS group for variables measuring institutional quality.4 All variables in the model are computed over five years periods (1990-1194,1995-1999,2000-2004,2005-2010) to catch delays in the deforestation adjustment processes.
The two interest variables which approach the theoretical notion of man-made capital derived from our model are domestic credit provided by the banking sector over GDP (Credit) and gov-ernment consumption over GDP (GovCons).
Three groups of control variables are considered, following the usual literature on deforestation (Angelsen and Kaimowitz (1999) and Barbier (2001), among others).
Deforestation is influenced by structural factors. Rates of deforestation may be characterized by inertia thus inducing the effect of lagged on current deforestation rates (Lagged Def or). According
3The list of countries included in regression analysis is given in the appendix 4Variables are described in the appendix.
to the Environmental Kuznets Curve (EKC) assumption, GDP per capita and squared GDP per capita in logs (Lgdppc and Lgdppcsq) should respectively influence deforestation positively and negatively. Nevertheless, as shown in Choumert et al. (2013) existing studies provide ambiguous results: Bhattarai and Hammig (2001) or Culas (2007) find an EKC contrary to Meyer, Van Kooten and Wang (2003). Concerning population in logs (Lpop), the expected impact is also ambiguous. Indeed, if population fuels the demand for arable lands, fuelwood or charcoal (Cropper and Griffiths 1994), it could also promote the demand for forest products (Foster and Rosenzweig 2003) and thereby having a negative impact on deforestation rates. Whether urbanization (U rbpop) drives deforestation is also an empirical question. On the one hand, pressure on forestland would decline with the rural-urban migration but on the other hand, urbanization could raise the level the demand for agricultural products.5
The macroeconomic environment matters in the deforestation process. We assume that the real exchange rate (Reer) and its instability (ReerInst) could lead to deforestation. The first variable catches the competitiveness of the export sector: an increase in the real exchange rate means a real appreciation. Real appreciation is expected to dampen deforestation since exported forest products are negatively affected (Arcand et al. 2008). The second variable is a proxy for the macroeconomic instability which can boost deforestation. Indeed risk adverse agents could mitigate the influence of macroeconomic instability relying more on the depletion of natural resources, including forests. We also assume that the higher the debt service (DebtBurden), the higher the deforestation. Indeed, Kahn and McDonald (1995) outline a significant positive association between public debt and deforestation in LDCs.
Institutions could also affect the deforestation process. Following Bhattarai and Hammig (2001) and Ferreira (2004), better institutions preserve forests. In this paper, we approach the institutional quality with an index extracted from the International Country Risk Guide (ICRG) database. More precisely, we consider two aspects of institutional quality: political stability and public integrity as put forward by (Ferreira and Vincent 2010) with three measures that are alternatively introduced: government stability (Gov Stab),6 internal conflicts (Int Conf ) and corruption (Cor), of which an increase means an improvement. We therefore assume that these variables have a negative impact on deforestation.
5DeFries et al. (2010) stress the positive influence of urbanization on deforestation with recent data which contrast with results obtained in previous studies for the 1980s and the 1990s.
6The variable is introduced in logs. In order to deal with zero values, we add 1 to the variable before computing logs.
3.2 Econometric specification
The estimations are made using country-specific and period-specific fixed-effects to control re-spectively omitted variables constant over time (e.g. country characteristics) and omitted variables common to the countries (e.g. international prices). The Arellano and Bond’s GMM estimator for dynamic panel is implemented for two reasons (Arellano and Bond 1991). Firstly, the OLS estima-tor is inconsistent since the lagged dependent variable is introduced besides country fixed-effects (Nickell 1981). Secondly the GMM estimator controls for the potential endogeneity of the two interest variables due to measurement error, reverse causality or omission of relevant variables.The equations are estimated in first differences and the lagged levels of the explanatory variables are used as instruments.7 The validity of the instruments is tested by the Sargan/Hansen overidenti-fication test and by the serial correlation test AR(2), where the null hypothesis is that the error term does not exhibit second order auto-correlation.
3.3 Results
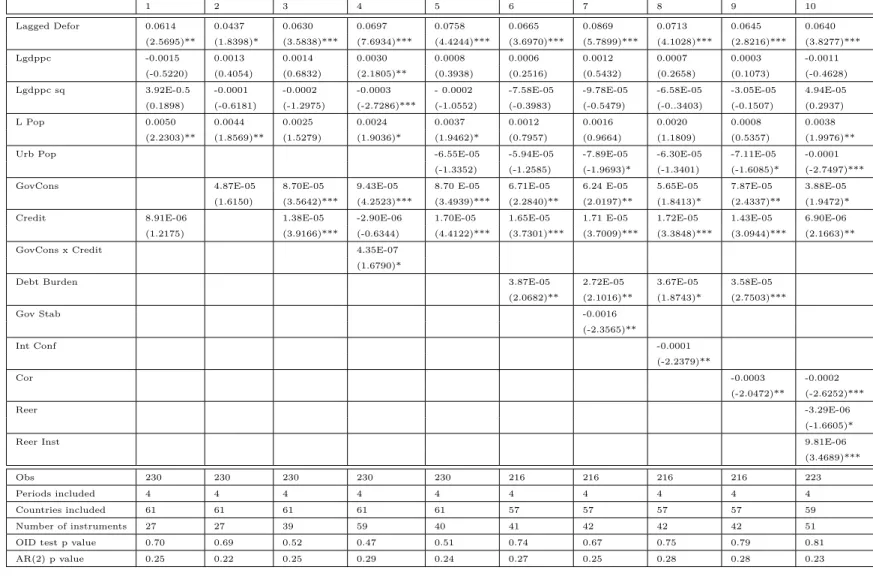
The results related to our control variable (table 1) are consistent with the literature: (1) The dynamic panel estimator is not rejected by the aforementioned tests. The coefficient of the lagged dependent variable is significantly positive which involves an AR(1) process of deforestation; (2) The Environmental Kuznets Curve is not validated by our data; (3) Population and urban population (equations 5 to 10) respectively affect positively and negatively the rate of deforestation; (4) The macroeconomic environment variables have the expected signs. Debt service as measured by Debt Burden has a positive impact on deforestation (equations 6 to 9). A real appreciation protects the forest while its instability is detrimental to it (equation 10). (5) Institutional quality variables (equations 7 to 10) have the expected negative signs.
As regards our interest variables, Credit and Gov Cons have weakly significant impacts on deforestation when introduced separately (equations 1 and 2). This result is interpreted as a symptom of omitted variable bias: other things held equal, Gov Cons seems to crowd out Credit. Interestingly, marginal effects are lower than those reported in equation 3 when Credit and Gov Cons are introduced simultaneously. Equation 3 therefore illustrates a complementarity effect between man-made capital and natural capital. These positive signs are robust to the introduction
7The lagged deforestation rate and the interest variables are instrumented by their lagged values. The controls variables are considered as exogenous.To deal with the problem of instruments proliferation, the matrix of instruments is collapsed to ensure that the number of instruments does not exceed the number of countries (Roodman 2009).
of the controls (equations 5 to 10). When interacted (equation 4), Gov Cons x Credit have a positive though weakly significant effect on deforestation which may interpreted as a crowding in impact of Gov Cons (resp. Credit) on Credit (resp. Gov Cons) à la Barro. Moreover, according to equation 3, the impact of an increase in our interest variables on deforestation rates can be simulated. A one standard deviation increase in Gov Cons (Credit) leads to an increase in the deforestation rate, which represents 21% (28%) of its average value. This is a rather important impact which highlights the intensity in the complementarity effect between man-made capital and natural capital.
Table 1: Empirical Results 1 2 3 4 5 6 7 8 9 10 Lagged Defor 0.0614 0.0437 0.0630 0.0697 0.0758 0.0665 0.0869 0.0713 0.0645 0.0640 (2.5695)** (1.8398)* (3.5838)*** (7.6934)*** (4.4244)*** (3.6970)*** (5.7899)*** (4.1028)*** (2.8216)*** (3.8277)*** Lgdppc -0.0015 0.0013 0.0014 0.0030 0.0008 0.0006 0.0012 0.0007 0.0003 -0.0011 (-0.5220) (0.4054) (0.6832) (2.1805)** (0.3938) (0.2516) (0.5432) (0.2658) (0.1073) (-0.4628) Lgdppc sq 3.92E-0.5 -0.0001 -0.0002 -0.0003 - 0.0002 -7.58E-05 -9.78E-05 -6.58E-05 -3.05E-05 4.94E-05 (0.1898) (-0.6181) (-1.2975) (-2.7286)*** (-1.0552) (-0.3983) (-0.5479) (-0..3403) (-0.1507) (0.2937) L Pop 0.0050 0.0044 0.0025 0.0024 0.0037 0.0012 0.0016 0.0020 0.0008 0.0038
(2.2303)** (1.8569)** (1.5279) (1.9036)* (1.9462)* (0.7957) (0.9664) (1.1809) (0.5357) (1.9976)**
Urb Pop -6.55E-05 -5.94E-05 -7.89E-05 -6.30E-05 -7.11E-05 -0.0001
(-1.3352) (-1.2585) (-1.9693)* (-1.3401) (-1.6085)* (-2.7497)*** GovCons 4.87E-05 8.70E-05 9.43E-05 8.70 E-05 6.71E-05 6.24 E-05 5.65E-05 7.87E-05 3.88E-05
(1.6150) (3.5642)*** (4.2523)*** (3.4939)*** (2.2840)** (2.0197)** (1.8413)* (2.4337)** (1.9472)* Credit 8.91E-06 1.38E-05 -2.90E-06 1.70E-05 1.65E-05 1.71 E-05 1.72E-05 1.43E-05 6.90E-06
(1.2175) (3.9166)*** (-0.6344) (4.4122)*** (3.7301)*** (3.7009)*** (3.3848)*** (3.0944)*** (2.1663)**
GovCons x Credit 4.35E-07
(1.6790)*
Debt Burden 3.87E-05 2.72E-05 3.67E-05 3.58E-05
(2.0682)** (2.1016)** (1.8743)* (2.7503)*** Gov Stab -0.0016 (-2.3565)** Int Conf -0.0001 (-2.2379)** Cor -0.0003 -0.0002 (-2.0472)** (-2.6252)*** Reer -3.29E-06 (-1.6605)*
Reer Inst 9.81E-06
(3.4689)***
Obs 230 230 230 230 230 216 216 216 216 223
Periods included 4 4 4 4 4 4 4 4 4 4
Countries included 61 61 61 61 61 57 57 57 57 59
Number of instruments 27 27 39 59 40 41 42 42 42 51
OID test p value 0.70 0.69 0.52 0.47 0.51 0.74 0.67 0.75 0.79 0.81
AR(2) p value 0.25 0.22 0.25 0.29 0.24 0.27 0.25 0.28 0.28 0.23
4
Concluding Remarks
Building capital is an important goal of economic development. Financial development provides means to achieve this objective. Increasing public spending may also be eligible for the provision of capital in developing countries. At the same time, deforestation and land-use change can be consid-ered as the use of natural capital to achieve development. It follows that assessing the relationship between those different forms of capital is important, in a world in which poverty alleviation through access to credit and deforestation are both important development and environment issues.
This paper draws attention on conflicting environmental and development objectives: capital as a mean of development may be built at the expenses of natural assets like tropical forests. Indeed we find evidence that an increased access to credit and public spendings seem to boost more deforestation-related activities than others. In this sense, man-made capital and natural capital may be considered as complement more than substitute in this context.
An important research recommendation here is then to deepen the analysis of this comple-mentarity and to find potential sources of substitutability. Indeed it is important to understand in which context a better access to credit - an crucial development requisite- is not achieved at the expense of forests depletion. Disentangling the access to man-made capital as a way to boost depletion of natural capital is then essential.
In terms of policy recommendation, our results can be interpreted as evidencing the existence of a Tinbergen rule which states that several objectives can be fulfilled only with a sufficient number of instruments: reducing the threat on forests is not likely to indirectly come from better access to credit and local development, unless further effort are made to orientate the investment in deforestation-unrelated activities. Environmental instruments need to be added to traditional economic instruments in the achievement for instance of the Millennium Development Goals.
Those suggestions have to be considered in the light of development policies. According to Humphreys (2006), the World Bank has long considered forests as an abundant and under-harvested asset, and focused on the need of developing countries to build access to capital in order to develop forest-related activities. In contrast, since the 1990, the World Bank seemed to took into consider-ation this complementarity between natural assets and human-made assets. In this sense, the WB strategy around forests has been to focus on the development of markets for goods and services (NTFP, carbon sequestration, eco-tourism), that could be described in our model as deforestation-unrelated activities. At the same time, the focus has been put in order to decreases the expected profitability of deforestation-related activities (timber certification for instance). A next step of
development agencies would be to explicitly take into account the channels of diffusion of a better access to credit and capital, by giving the right incentives that would lead to deforestation-unrelated activities.
Appendix
Table 2: Countries list
Sub-Saharan Africa (29) Asia (12) Latin America (20)
Angola Bangladesh Argentina
Burkina Faso Brunei Bolivia
Botswana China Brazil
Cote d’Ivoire Indonesia Chile
Cameroon India Colombia
Congo, Republic of Korea, Republic of Costa Rica
Ethiopia Malaysia Ecuador
Gabon Mongolia Guatemala
Ghana Pakistan Guyana
Guinea Philippines Honduras
Gambia, The Papua New Guinea Mexico
Guinea-Bissau Vietnam Nicaragua
Kenya Panama Liberia Peru Madagascar Paraguay Mali El Salvador Mozambique Suriname Malawi Thailand Namibia Uruguay
Niger Venezuela, Bolivarian Republic of
Senegal Sierra Leone Togo Tanzania Uganda South Africa Congo, Democratic Republic of
Zambia Zimbabwe
Table 3: Variables
Variables Description Source Average (Standard deviation) Median
Dependent variable:
Defor Average annual deforestation rate FAOstat. Four periods: 1991-95; 1996-00; 2001-05;
2006-10. FAO production yearbook provided instruments for lagged values of deforestation rates
0.0021 (0.0039) 0.0018
Explanatory variables:
All variables are period averages Four periods: 1991-95; 1996-00; 2001-05; 2006-10.
Interest variables
Credit Domestic Credit provided by the Banking Sector, % of GDP.
World Bank Data: http://data.worldbank.org 42.7307 (40.0493) 30.5907
Gov cons General government final consumption expenditure (% of GDP)
idem 13.3456 (5.1048) 12.1443
Control variables
GDPPC GDP per capita, constant 2000 USD. idem 2395.261 (3436.476) 1024.6370
Pop Population, total. 69.07E+06 (2.12E+08) 13.17E+06
UrbPop Urban population, % of total. idem 47.1430 (21.5917) 44.9071
DebtBurden Total debt service (% of exports of goods, services and income).
idem 5.4792 (5.1698) 4.3196
Reer Real effective exchange rate, base 100 in 1990. Weights determined by the country’s first ten partners (imports and exports), oil countries excluded or not. An increase means a real appreciation.
Authors’ calculations, World Bank Data 111.9092 (35.5919) 102.8959
Reer Inst Instability of the Real effective exchange rate. It is calculated as the squared residuals of the country-individual regressions of Reer on one-year lagged Reer and a deterministic trend
Authors’ calculations 4.8109 (14.4654) 2.7615
Corruption Corruption index from the International Country Risk Guide database. Ranks from 0 to 6. An increase means an improvement i.e. a decrease in corruption.
http://www.prsgroup.com/ICRG.aspx 2.5161 (0.8849) 2.4792
Int Conf Internal conflicts index from the International Country Risk Guide database. It assesses political violence in the country and its actual or potential impact on governance. Ranks from 0 to 12. An increase means an improvement i.e. a decrease in the intensity of political violence.
idem 8.6084 (1.6650) 8.8333
Gov Stab Government stability index from the International Country database. It both assesses the government’s ability to carry out its declared program(s), and its ability to stay in office. Ranks from 0 to 12. An increase means an improvement
References
Angelsen, A. and Kaimowitz, D. (1999). Rethinking the Causes of Deforestation: Lessons from Economic Models. World Bank Research Observer, 14(1):73–98.
Anjini, K. (1997). An empirical investigation of rationing constraints in rural credit markets in india. Journal of Development Economics, 53(2):339 – 371.
Arcand, J.-L., Guillaumont, P., and Jeanneney, S. G. (2008). Deforestation and the real exchange rate. Journal of Development Economics, 86(2):242–262.
Arellano, M. and Bond, S. (1991). Some tests of specification for panel data: Monte carlo evidence and an application to employment equations. Review of Economic Studies, 58(2):277–97.
Azqueta, D. and Sotelsek, D. (2007). Valuing nature: From environmental impacts to natural capital. Ecological Economics, 63(1):22 – 30.
Barbier, E. and Burgess, J. (1996). Economic analysis of deforestation in mexico. Environment and Development Economics, 1(2):203–239.
Barbier, E. B. (2001). The Economics of Tropical Deforestation and Land Use: An Introduction to the Special Issue. Land Economics, 77(2):155–171.
Barbier, E. B. (2003). The role of natural resources in economic development. Australian Economic Papers, 42(2):253–272.
Barro, R. J. (1991). Government Spending in a Simple Model of Endogenous Growth. NBER Working Papers 2588, National Bureau of Economic Research, Inc.
Bhattarai, M. and Hammig, M. (2001). Institutions and the environmental kuznets curve for deforestation: A crosscountry analysis for latin america, africa and asia. World Development, 29(6):995–1010.
Bulte, E. H., Damania, R., and Lopez, R. (2007). On the gains of committing to inefficiency: Corruption, deforestation and low land productivity in Latin America. Journal of Environmental Economics and Management, 54(3):277–295.
Celentano, D., Sills, E., Sales, M., and Veríssimo, A. (2012). Welfare outcomes and the advance of the deforestation frontier in the brazilian amazon. World Development, 40(4):850–864.
Choumert, J., Motel, P. C., and Dakpo, H. K. (2013). Is the environmental kuznets curve for deforestation a threatened theory? a meta-analysis of the literature. Ecological Economics, 90(0):19 – 28.
Cropper, M. and Griffiths, C. (1994). The interaction of population growth and environmental quality. American Economic Review, 84(2):250–54.
Culas, R. J. (2007). Deforestation and the environmental kuznets curve: An institutional perspec-tive. Ecological Economics, 61(2-3):429–437.
Daly, H. and Townsend, K. (1996). Valuing the Earth: Economics, Ecology, Ethics. MIT Press.
Daly, H. E. (1997). Georgescu-Roegen versus Solow/Stiglitz. Ecological Economics, 22(3):261–266.
Damette, O. and Delacote, P. (2011). Unsustainable timber harvesting, deforestation and the role of certification. Ecological Economics, 70(6):1211–1219.
Damette, O. and Delacote, P. (2012). On the economic factors of deforestation: What can we learn from quantile analysis? Economic Modelling, 29(6):2427–2434.
Dasgupta and Heal, G. (1974). The optimal depletion of exhaustible resources. Review of Economic Studies, 41:1–28.
DeFries, R. S., Rudel, T., Uriarte, M., and Hansen, M. (2010). Deforestation driven by urban popu-lation growth and agricultural trade in the twenty-first century. Nature Geoscience, 3(3):178–181.
Diamond, J. (2013). Collapse: How Societies Choose to Fail or Survive. Penguin UK.
Ferreira, S. (2004). Deforestation, Property Rights, and International Trade. Land Economics, 80(2):174–193.
Ferreira, S. and Vincent, J. (2010). Governance and timber harvests. Environmental & Resource Economics, 47(2):241–260.
Foster, A. D. and Rosenzweig, M. R. (2003). Economic growth and the rise of forests. The Quarterly Journal of Economics, 118(2):601–637.
Galinato, G. and Galinato, S. (2013). The role of government spending on deforestation and carbon dioxide emissions from land use change. Working Papers 2013-14, School of Economic Sciences, Washington State University.
Ge, Y. and Qiu, J. (2007). Financial development, bank discrimination and trade credit. Journal of Banking and Finance, 31(2):513 – 530.
Geist, H. and Lambin, E. (2001). What Drives Tropical Deforestation? A Meta Analisys of Prox-imate and Undeliyng Causes of Deforestation Based on Subnational Case Study Evidence, vol-ume 5. LUCC International Project Office.
Godoy, R., O’Neill, K., Groff, S., Kostishack, P., Cubas, A., Demmer, J., McSweeney, K., Overman, J., Wilkie, D., Brokaw, N., and Martinez, M. (1997). Household determinants of deforestation by amerindians in honduras. World Development, 25:977–987.
Humphreys, D. (2006). Logjam: Deforestation and the crisis of global governance. Earthscan Forestry Library. Earthscan Publications Ltd, London.
Hung, F.-S. and Cothren, R. (2002). Credit market development and economic growth. Journal of Economics and Business, 54(2):219 – 237.
Jouvet, P. and DePerthuis, C. (2012). La croissance verte : de l’intention à la mise en oeuvre. Informations et Débats, 15.
Kahn, J. R. and McDonald, J. A. (1995). Third-world debt and tropical deforestation. Ecological Economics, 12(2):107–123.
Meadows, D., Meadows, D., and Randers, J. (2005). The Limits to Growth: The 30-year Update. London: Earthscan.
Meadows, D., Meadows, D., Randers, J., and Behrens, W. (1974). The limits to growth: a report for the Club of Rome’s project on the predicament of mankind. A Potomac Associates Book. Universe Books.
Meyer, A. L., Van Kooten, G. C., and Wang, S. (2003). Institutional, social and economic roots of deforestation: a cross-country comparison. International Forestry Review, 5(1):29–37.
Monela, G. (1995). Tropical Rainforest Deforestation, Biodiversity Benefits,and Sustainable Land Use : Analysis of Economic and Ecological Aspects Related to the Nguru Mountains,Tanzania. PhD thesis, Agricultural University of Norway, Department of Forest Sciences.
Odedokun, M. (1996). International evidence on the effects of directed credit programmes on efficiency of resource allocation in developing countries: The case of development bank lendings. Journal of Development Economics, 48(2):449 – 460.
Pfaff, A. S. P. (1999). What Drives Deforestation in the Brazilian Amazon?: Evidence from Satellite and Socioeconomic Data. Journal of Environmental Economics and Management, 37(1):26–43.
Roodman, D. (2009). A note on the theme of too many instruments. Oxford Bulletin of Economics and Statistics, 71(1):135–158.
Rudel, T. and Roper, J. (1997). The paths to rain forest destruction: Crossnational patterns of tropical deforestation, 1975-1990. World Development, 25(1):53–65.
Ruta, G. and Hamilton, K. (2007). Handbook of sustainable development., chapter The capital approach to sustainability., page p. 45:62. Edward Elgar Publishing.
Solow, R. (1974). Intergenerational equity and exhaustible resources. Review of Economic Studies, 41:29–45.
Stiglitz, J. (1974). Growth with exhaustible natural resources: Efficient and optimal growth paths. Review of Economic Studies, 41:123–137.
WorldBank (2006). Where is the wealth of nations?: measuring capital for the 21st century. World Bank Publications.