A COMPARATIVE ANALYSIS OF AGE-DEPENDENT AND BIRTH YEAR
COHORT-SPECIFIC CANCER MORTALITY DATA BETWEEN
JAPAN AND THE UNITED STATES by
Jose Angel Marquez Jr.
B. S., Environmental Engineering Science (1994)
Massachusetts Institute of Technology
Submitted to the Division of Bioengineering and Environmental Health in Partial Fulfillment of the Requirements
for the Degree of
Master of Science in Toxicology at the
Massachusetts Institute of Technology January 1999
© 1999 Massachusetts Institute of Technology
All rights reserved
Signature of Author:
Certified by:
Division of Bioenginee g and Envi e tal Health
/
uary, 1999
William G. Thilly Professor of Bioengineering and Environmental Health Thesis Supervisor
Accepted by: 11
MASSACHUSETTS NSTITUTE
OF TECHNOLOGY
Peter C. Dedon Chair, Committee on Graduate Students, Division of Bioengineering and Environmental Health
A COMPARATIVE ANALYSIS OF AGE-DEPENDENT AND BIRTH YEAR
COHORT-SPECIFIC CANCER MORTALITY DATA BETWEEN JAPAN
AND THE UNITED STATES by
Jose Angel Mirquez Jr.
Submitted to the Division of Bioengineering and Environmental Health January 31, 1999, in partial fulfillment of the requirements
for the Degree of Master of Science in Toxicology
Abstract
Using a different approach from previous epidemiological studies, an attempt was made to identify similarities and differences between Japan and the United States via age-dependent and birth year cohort-specific mortality rates calculated for each respective country. Japanese mortality data dating back to 1951 was compiled and entered into a workable format for a set of approximately 50 cancers. The cancers to be studied are limited to lung, colon/rectum, breast, prostate, pancreas, leukemia, Non-Hodgkin's lymphoma, stomach, cervical/ovary, and brain. For this study, the format utilized provides a better means of determining the time periods when environmental factors may have played a role in resulting mortality curves. This new ideology utilizing birth year cohorts as a means of comparing data is more indicative than the past use of age-adjusted mortality rates. Differing experiences of differing birth cohorts in establishing links to mortality trends are the ensuing benefits. With this new approach it will then allow the ability to develop linear relationships with environmental data. As the case is with the American data set, evidence of a linear relationship has been determined between the percentage of smokers for different birth cohorts and the corresponding data for lung cancer. This one example is just a brief introduction to the numerous environmental factors which can be explored in Japan. Such results can then be effectively compared to the United States and other countries to uncover possible ways to prevent different forms of cancer.
Thesis Supervisor: William G. Thilly
Acknowledgments
In every task, there is always others which share the journey when achieving a goal. As my academic career arrives at another step towards my ultimate goal, I too would like to recognize certain individuals which have provided support, either intellectually or emotionally, which have helped me obtain another goal in this crazy setting we call life.
First, I would like to thank my advisor and coach, Professor William G. Thilly, for pushing me in every aspect with this project. Whether providing intriguing views or prompting debate for the good of man, his tenacity will never be forgotten.
Additionally, thanks goes to Dr. Mutsuhiro Nakao and the members of the University of Tokyo's Department of Public Health for generously compiling the raw data and for Dr. Nakao's attempts to be of service when others were unable to.
This project could not have arrived to completion without the external thoughts of Pablo Herrero-Jimenez and Janice Vatland. Their guidance and support with the mortality curves is indeed
appreciated.
As for my fellow graduate students, thanking them for their patience when answering my questions and listening to my myriad of complaints day in and day out is in order. In particular, much appreciation goes to Brindha Muniappan (my neighbor to the left) for her constant
laughter. Aoy Tomita-Mitchell for those sporadic, yet uplifting lunch breaks. Xiaocheng Li-Sucholeiki for being the messenger where Professor Thilly was concerned. Andrea Kim for solid advice and for those coffee runs. And finally, Dr. Per Ekstrom for taking me away from the confines of my computer if just for a few minutes through the discussions of life's strange mysteries.
Finally, I could not have achieved anything in this life and be happy for it without the support of my family. This one special moment in time is dedicated to them for believing in me and being
there for me whatever the circumstances. Thank you, Mom for your unconditional love and support. Thank you, Monica for your never-ending stories and helping me remember to dream and never lose grasp of it. And thank you, Michael, for helping me never forget the special little details in life.
Table of Contents
Title Page 1 Abstract 2 Acknowledgment 3 Table of Contents 5 List of Figures 7 List of Tables 8 1. Introduction 9 2. Literature Review 112.1 Presentation of mortality data 11
2.2 The environment: Japan vs. United States 13 2.1.1 Japan's introduction to Western change 13
2.1.2 The changing of Japan's diet 16 2.1.3 Smoking and lung cancer in both countries 18
3. Materials and Methods 28
3.1 Materials 28
3.2 Methods 28
4. Results and Discussion 30
4.1 Analyses of twelve cancers 30
4.1.1 Lung cancer 33
4.1.2 Colon and rectal cancers 35
4.1.3 Breast cancer 38
4.1.4 Prostate cancer 39
4.1.5 Pancreatic cancer 41
4.1.6 Stomach cancer 42
4.1.7 Ovarian and cervical cancers 44 4.1.8 Non-Hodgkin's lymphoma 46
4.1.9 Leukemia 47
4.2 Further analysis of lung cancer and smoking 51
5. Conclusion 55
6. Suggestions for Further Research 56
7. References 57
Appendix A -Age vs. OBS(t) Graphs 63
List of Figures
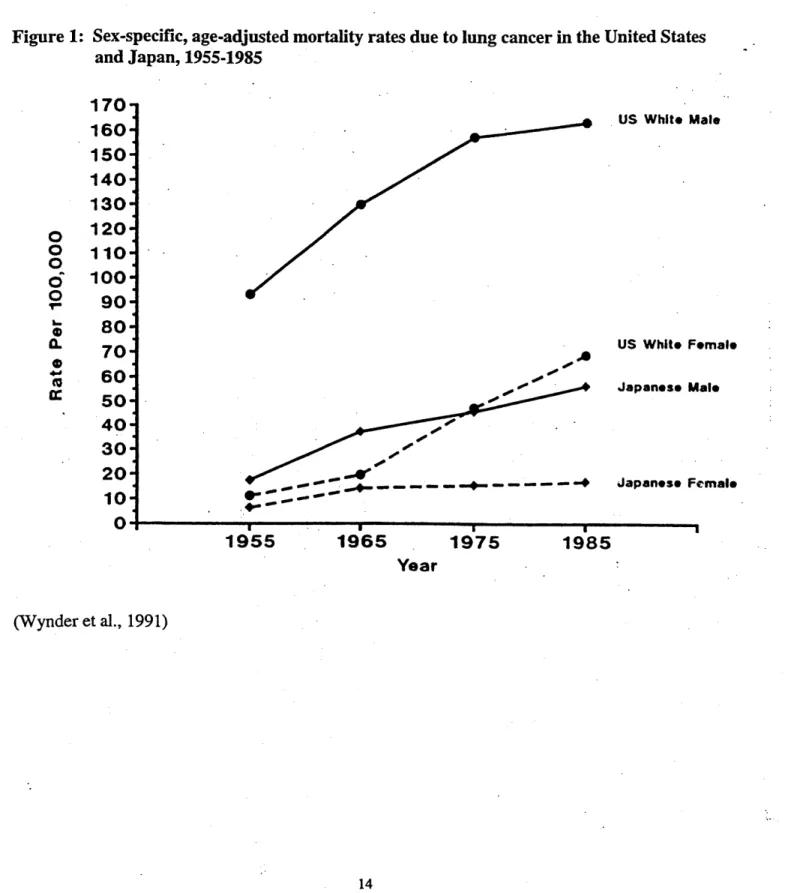
Figure 1. Sex-specific, age-adjusted mortality rates due to lung cancer in the 14 United States and Japan, 1955 to 1985.
Figure 2. Number of cigarettes consumed per adult per year in the United States 20 and Japan, 1920-1985.
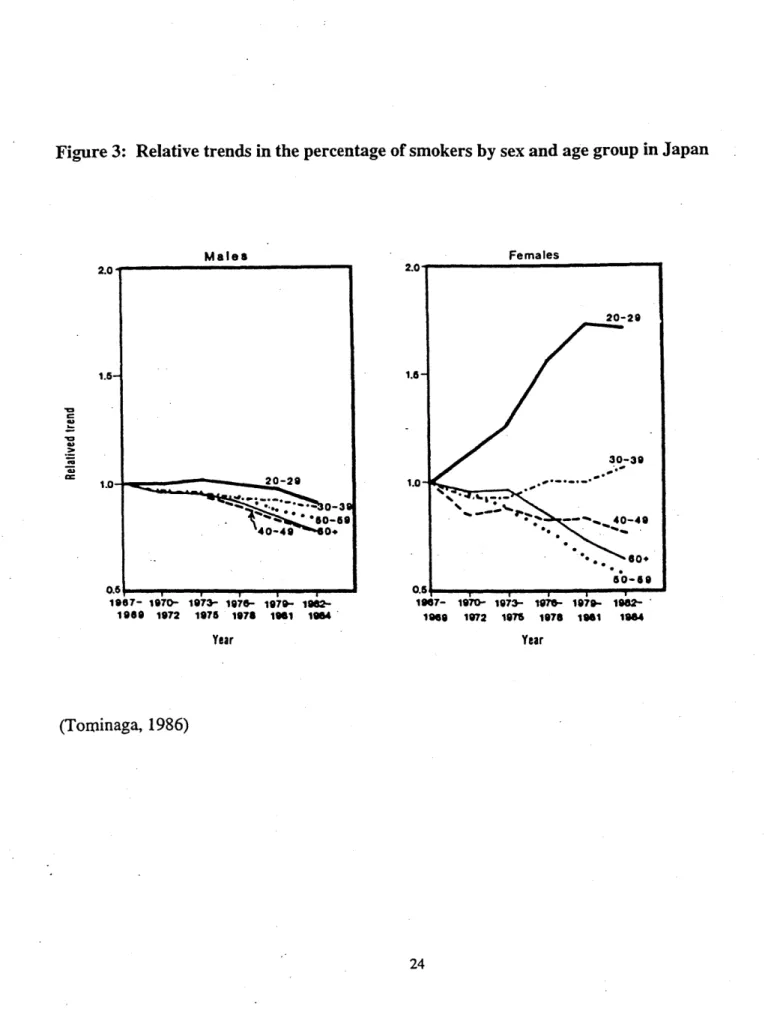
Figure 3: Relative trends in the percentage of smokers by sex and age group 24 in Japan
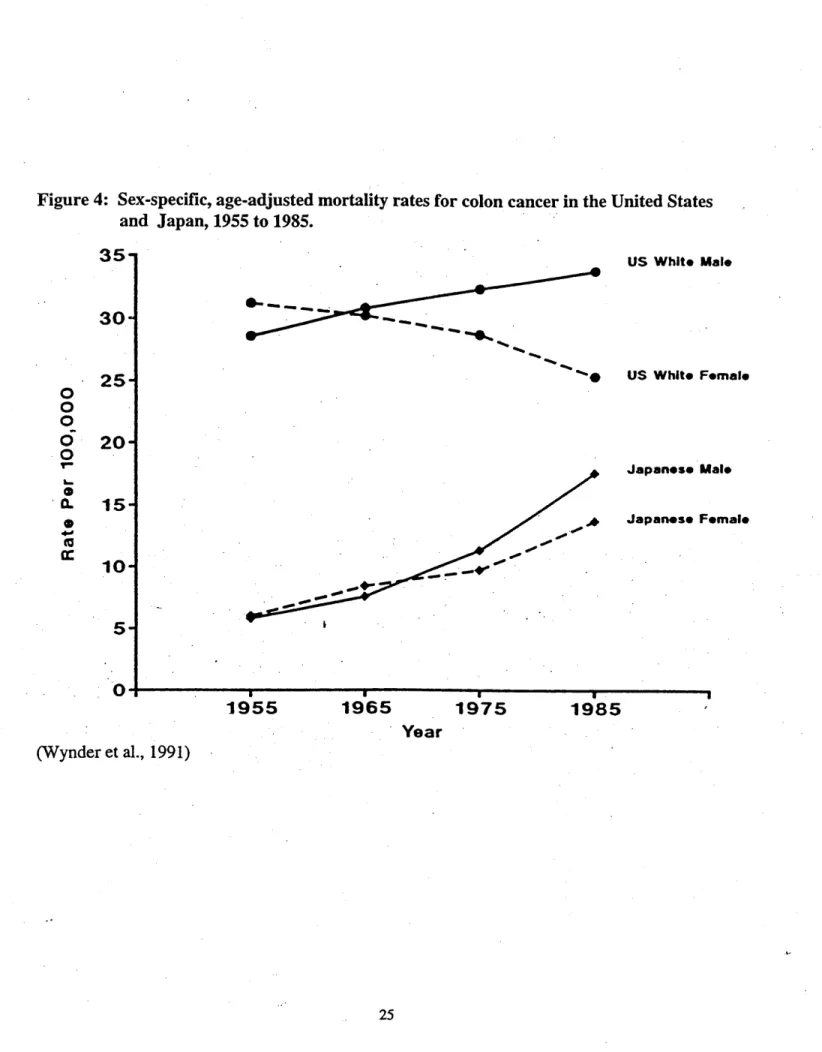
Figure 4: Sex-specific, age-adjusted mortality rates for colon cancer in the 25
United States and Japan, 1955 to 1985.
Figure 5: Relationship between lung cancer mortality and smoking in males 27
in the United States and Japan (1955-1975)
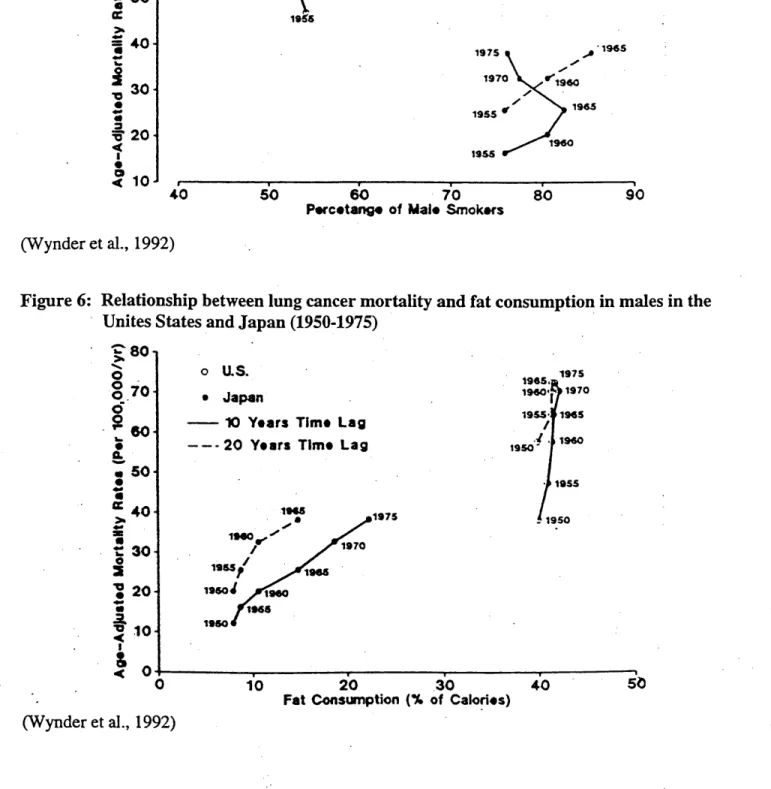
Figure 6: Relationship between lung cancer mortality and fat consumption 27
in males in the United States and Japan (1950-1975)
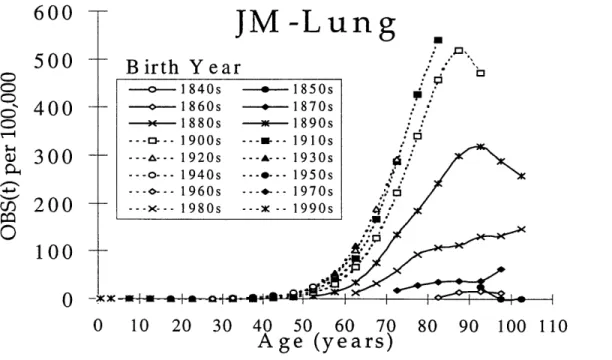
Figure 7a: Age vs. OBS(t) per 100,000 individuals for Lung Cancer 32
(Japanese males)
Figure 7b: Age vs. OBS(t) per 100,000 individuals for Lung Cancer 32
(Japanese females)
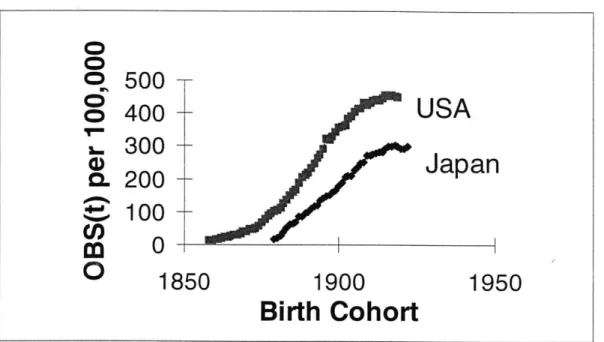
Figure 8: Birth Cohort vs. OBS(t) per 100,00 individuals for Lung Cancer 34 Age Group 70-74 (Japanese males)
Figure 9: Percentage of Smokers vs. Subpopulation at Risk for Lung Cancer 52
for EAM and EAF, Birth cohorts 1820-1920
Figure 10: Birth Cohorts vs. OBS(t) per 100,000 for Lung Cancer 54 (Age group 70-74) for EAM, JM, EAF, and JF
List of Tables
Table 1. Population Rate of Increase in Fastest-Growing Urban Areas 17
Table 2: Sex- and age-specific percentage of smokers aged 20 years and over 22 in Japan
Table 3a: Lung Cancer Mortality per 100,00 individuals in Japanese 31
Males per Decade
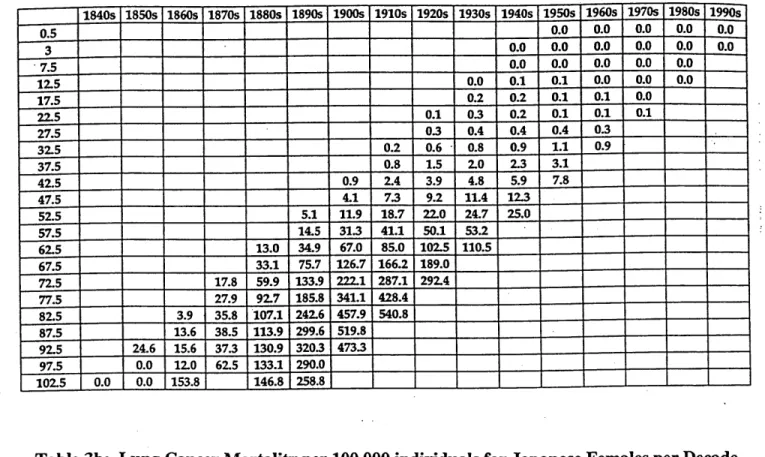
Table 3b: Lung Cancer Mortality per 100,000 individuals for Japanese 31
Females per Decade
Table 4: Trend in per Capita Fat Consumption (percentage of calories) 37
1. INTRODUCTION
Taking historical data and determining trends has been the hallmark of epidemiological research. In this respect, from the observed trends, the focus is then turned to determining what causes are present that could correspond to these changes in data. This is the case with mortality data and environmental effects which many researchers see as the means in determining distinct changes in mortality rates. However, when determining these trends, the methods in formatting this data can produce analyses that does not closely reflect true changes in the rates for mortality. Thus, in this paper, the focus is to present a new format in setting up a mortality database for Japanese mortality from available site-specific cancer data. Results from this format better detail mortality changes of an observed cancer and allow a more accurate interpretation to what years are
involved in determining the key period of history that may have placed indelible changes to the mortality data observed.
With this new format, the resulting mortality curves are to be investigated for trends which will then be compared to that of the American data set. But what observations are to be targeted? In essence, the distinct differences between the two nations will dictate the focus of the observed death rates. One such difference is the advent of industrial change. In the United States, the invention of the cotton gin by Eli Whitney in 1793 was the beginning of the Industrial
Revolution. This period starting in the early 19th century, undoubtedly altered the economic and
social changes of the most prosperous nation in the world. However, the arrival of these changes were not evident in Japan until the early 2 0th century when the repercussions of the Meiji
Restoration ensued. In 1868, the birth of sweeping changes to Japan's isolated habitat began with the West bringing new items of innovation. Heretofore, one focus of this paper is the approximately 30 year period difference in the revelation of a newer, faster society in both countries. Examining the tell-tale signs of progress of both countries plus the analyses of Japanese data to that of American data will help establish if industrial-based trends may be present and provide proof of how such similar revolutions affect cancer mortality. Additionally, a historical look into the changing diet of the Japanese is of much interest since their traditional diet is of great distinction to that of the American diet. And with the emphasis placed on fat
consumption in both countries, addressing this issue and coinciding it with the data can help illustrate if a relationship should be pursued. Moreover, in the keen interest of smoking's effects on lung cancer, a narrower focus on the arrival of manufactured cigarettes in Japan after use in the United States will be investigated to determine how similar environments do indeed dictate the observed mortality rates in both nations. Since the new format is age-dependent, indications to corresponding periods of changing history is meant to effectively pinpoint a time table to correlate with environmental change. Consequently, further steps in research can then be based on these strong historical trends found in the mortality data.
2. LITERATURE REVIEW
2.1 Presentation of mortality data
Interpreting data relies on effectively formatting the data to provide a picture to what trends are occurring. This has been the means for nearly a century in the case of mortality data. However, in the past, the method that such data has been analyzed conveyed trends by calendar year with no regard to the differing age groups by birth year within that calendar year. Therefore, with this study, it was of great interest to analyze the Japanese mortality data with respect to age group and their corresponding birth cohorts. Before showing the differences with what interpretations can be seen with this form of data, it is best to provide a background to how mortality data has been previously investigated.
With the case of mortality data, the basic formulas are straightforward and logical, but the attempts are limited with respect to deaths relative to age groups historically. To give an idea to the reasoning behind what has been used in the past, a quick summary of crude death rate,
age-sex-specific death rate, and age-adjusted death rate will be described.
A crude death rate is the most basic of terms. In this case, it is a ratio of the number of deaths
(from a site-specific cancer) to the total population at mid-year (Zopf, 1992). It is therefore expressed as such:
Deaths in a given year
x 1000 Total population at mid -year
Multiplying the ratio by 1000 thus gives a rate per 1,000 individuals. Therefore, if 500
individuals died in 1990 from a total population of 100,000, then the crude death rate would be 5 deaths per 1,000 in 1990. As the term suggests, this estimate does not take age into account. Thus, refining this equation with respect to age leads to the term age-sex-specific death rate.
This calculation refers to the death rate for a certain age group. In other words, where a crude death rate is general with no regard to age, the age-sex-specific death rate is a ratio of the death of an age group, specific for sex, in one year to the number of individuals of that group alive at mid-year (Zopf, 1992). Therefore, the resulting equation gives:
Deaths of an age -sex -specific group
x 100,000
Total number of individuals of that group at mid -year
In this respect, the resulting calculation is more detailed where the death rate is sex-specific (i.e. male or female) and more importantly, age-specific, as well. This provides a more detailed death
rate which denotes a given year. To exemplify this determination, taking an age group of Japanese males from 20-24, if the number of deaths is 5,000 in 1990 and the number of
individuals in this age group numbers at 2,000,000, the age-sex-specific death rate is then 250 per 100,000 individuals. But to compare these rates for different calendar years, the age-adjusted death rate is then utilized.
Where the age-sex-specific death rate narrowed the focus to a certain age group, the age-adjusted death rate goes a step further and provides a calculated death rate in an actual population given the same age distribution of a standard population. In essence, this calculated death rate is a "direct method of standardization" (Zopf, 1992). The end result thus gives the opportunity to compare different populations (i.e. different calendar years) for which age-specific death rates are available. As the case with every study, the basis for comparison is then dictated on the standard population chosen. Therefore, with a given age-sex-specific death rate, using the example 250 per 100,000, and a standard population of 2,220,000 chosen from 1940, one determines the number of deaths for the year in question (e. g. 1990), where the number of expected deaths for that year to be 5,550. If done for each age group in that given year, taking the expected total deaths and dividing by the total standard population in 1940, one then calculates the age-adjusted death rate for 1990. As recognized by this procedure, this death rate is determined via a standard
cancer epidemiology study, and it's attempts for denoting trends relies on these age-adjusted death rates for the available data. A prime example of this is it's use by Wynder et al. in the studies involving Japanese data (1991, 1992). As seen in figure 1, the age-adjusted mortality rate for lung cancer is seen for calendar years dating back to 1955. Such a study is just the tip of the iceberg of what one can find with the mode of presenting national mortality data.
2.2 The environment: Japan vs. United States
2.2.1 Japan's introduction to Western change
Although the United States and Japan are now deemed world powers, the differences that encompass these nations are more of practical means. As usually the case with nations from the West to those of the East, the cultural differences seem to have dictated how inhabitants in both nations live their lives. This is certainly the case here where the advance of technology in the United States superseded that of Japan, and thus a lag in development was seen in the latter. This difference in human advancement, illustrated by the mortality statistics, may be a factor in
drawing a historical picture by these numbers. Therefore, a brief synopsis of the differences in the environment, both industrial and cultural, is necessary to set the stage in elucidating and examining possible reasons for the contrasting mortality rates in both nations.
Located east of the Korean peninsula and mainland China, Japan has endured thousands of years of isolation. However, in 1543, this changed when Portuguese sailors who where blown off course, landed on Japanese ground by accident (Sims, 1973). After this initial exposure, the Japanese people felt a sense of insecurity with the arrival of strangers to their peaceful existence. But this was all to change in July, 1853, when Commodore Matthew C. Perry of the United States landed in Japan and persuaded the Japanese into signing treaties which commenced open trade between the two nations. Although it was in the interest of the Japanese to stay secluded spurred by the isolationist policy of the Tokugawa rulers, the fear of dangerous repercussions
Figure 1: Sex-specific, age-adjusted mortality rates due to lung cancer in the United States and Japan, 1955-1985 0 0 0 0 0 Tm 0. 0E 4' 170- 160-150 140-130 120- 110- 100- 90- 80-70 60- 50- 40- 30- 20- 10-0 I I .. ..-.... ..-- --- --(Wynder et al., 1991) US White Male US Whit* Female Japanese Male Japanese Female 1955 1965 1975 Year 1985 a
from ignoring the West were of much concern (Andrews, 1971). This was the beginning of troubles for Japan where the new visitors demanded situations with no regard to Japan's
traditions or wants. Nevertheless, treaties were signed and the West eliminated Japan's isolation from the rest of the world. But this event embarked Japan on a journey which saw the gradual disappearance of steadfast tradition in exchange for new technology and social advancement.
Ironically, with the arrival of the West, there came major conflicts within the nation that saw a samurai revolution, a coup d'etat that restored power to the Emperor (Meiji) , and a civil war. Nevertheless, after all these struggles of power, a government was established with samurai reformers dictating action; a government "governed by samurai firmly dedicated to
modernization" (Sims, 1973). This era of modernization, 1868-1912, is now known as the Meiji Restoration.
Comparing the history to that of the United States helps establish differing social environments that developed from the technological gap between these two nations. As evident by the
historical background, Japan's introduction to Western ideas sparked a new means of living. The incorporation of power machinery and the introduction of new items, especially beef, delivered Japan from a country of rice and pickled vegetables to one of assimilating to Western culture. However, before such events occurred in Japan, the United States had already begun it's phase into advanced technology. The "Industrial Revolution" which began in the late 1 81h and early
1 9th century was seeing it's effects by the mid to late part of the 191h century. With the increasing
number of innovations came luxuries that developing nations could not even fathom.
Interestingly, when examining this "technology transfer", it is important to note how quickly this reformation of one society developed. To begin, Japan's need for change was sparked by the government as a whole, thus steps in this direction were taken with the help of increasing yields of production of its agriculture, most notably, rice (Dempster, 1967). As such, between 1880 and
1920, rice yields rose 80% in this period, which in turn produced profits for the government to
improve the industrial aspect of the restoration. However, there was a drawback to this situation. Products were not in demand considering more than 80% of the population were farmers and
since being heavily taxed, had a very small purchasing power (Andrews, 1971). As a result, it is accurate to assume that even with this rapid, widespread adoption of industrial change, the effects were not seen nationwide, until the early 2 01h century. This can be noted by the increase
in population of urban areas in Japan. Yazaki presents these facts in a table where the rate of increase is seen in the larger cities from 1878 to 1897 (see table 1) (1968). A redistribution of residents was also seen in the latter half of the Meiji period where the five largest cities had a rate
of increase in population of 40% in 1910 (Andrews, 1971). With urban cities seeing the first wave of change, the citizens in these areas were more likely to be exposed to the Western culture than rural areas. Thus, movement was essential for adoption of these changes, and with the migration being evident in the latter period of the Meiji Restoration, the effects of these changes were seen at approximately 1920.
2.1.2 The changing of Japan's diet
Concomitantly, experiencing the pleasures of Western culture was also more visible in the urban areas of Japan. By the early 2 0th century, the ex-samurai, who helped pull Japan into a more
technically advanced nation, were being assimilated into the ways of Western man through changes in the home, clothes, and diet (Yazaki, 1968). Although there was still tradition in the home, the changes undoubtedly altered the ways that Japanese normally lived. As the case with meat, it was not until 1872, that the emperor was persuaded to eat beef for the first time (Sims,
1973). After which, meat-eating and milk-eating were promoted by the government. But as
mentioned before, until Japan was firmly situated into it's restoration, such luxuries were not bought by the common citizen prior to the early 1900's. Moreover, the true adoption of Western cuisine was not felt until after World War II. Beginning with the rebuilding of the nation after
Table 1: Population Rate of Increase in Fastest-Growing Urban Areas City Tokyo Osaka Kyoto Nagoya Kobe Yokohama Hiroshima Population in 1897 1,330,000 750,000 320,000 250,000 190,000 180,000 110,000 Rate of Increase, 1878-1897 (1878 population = 100) 188.60 258.39 142.84 222.52 1,628.98 306.57 148.52 (Yazaki, 1968, pg. 312)
What many studies pursue in their aim to connect environmental factors to mortality deaths is the issue of diet (Roebuck, 1992; Rose and Connolly, 1992; Wynder, 1992). However, keeping with the historical perspective to Japan's experience entails the gradual increase in fat products during the latter of the 2 01h century. As stated before, rebuilding after World War II was the
biggest effort by the Japanese government. With help from the Korean War, the economy began to flourish, and the ability to increase the availability of more Western products was more prominent (Longworth, 1983). What is amazing about this period was the transition being more evident in the country's society. Since relying on wheaten-based products, and luxuries (meat, eggs, dairy products) becoming more common, a revolution began that provides a time-table for investigators when analyzing incidence and mortality data. Thus, it is imperative to consider that the changes that took place in Japan were at the middle of the 2 0th century, when Western cuisine
was beginning it's infiltration into the traditional diet of previous centuries.
Consequently, studies have used the diet change in Japanese to account for the increase in certain cases of cancer, most notably that of colon and breast cancer (Hara et. al., 1985; Kato et. al.,
1987; Miller et. al., 1978; Weisburger, 1997; Lubin et al., 1986; Wynder et. al., 1992). A study by Kato calculated correlation coefficients between foods/nutrient intakes and age-adjusted
mortality rates and concluded that fat intake was significant in causing breast and ovarian cancer
(1987). Taking the idea that fat intake has increased 3.6 times from 1949-1984, such a strong
correlation may indeed explain the increasing trend in breast cancer patients in Japan. This is just one example which provides evidence to suggest that changes in the diet of Japanese may
show responsibility to the changes in cancer mortality for certain cancers.
2.2.3 Smoking and lung cancer in both countries
but overpowering infiltration that now has been a matter of concern for both health professionals and the average person. In this section, the trends seen in smoking habits for both the United States and Japan will be discussed plus what the literature reports on the ensuing effect of lung cancer.
Some reports give different times to the beginning of smoking prevalence in both the United States and Japan. Although tobacco was a common item in both countries, the advent of the cigarette into mass production can essentially be called the catalyst to this growing market. In the United States, "cigarette girls" rolled up cigarettes for customers until the late 1870's when the invention of the Bonsack machine redefined a new era that yielded tobacco products for
widespread use. Epidemiologically, the years in which Americans, both males and females, began smoking is roughly before 1880 and around 1910, respectively (Harris, 1983). However,
another study uses the consumption of cigarettes by both nations and concludes that Americans began smoking 20-30 years before the Japanese began between 1940 and 1950 (see Figure 2) (Wynder et al., 1991). Coincidentally, this was at the time of World War II, when rationing of cigarettes were at its highest in Japan, and the availability of cigarettes did not rise until several years after the war ended. But historically, the demand for cigarettes was indeed high before the
2 0 1h century in Japan; however, the supply was not there (Okurasho, 1905). In a report that
describes the tobacco monopoly in Japan around the turn of the century, it states that an insufficient amount of product could be manufactured for the great demand at the time. Thus, the Tobacco Monopoly Law, promulgated on April 1, 1904, changed the means of tobacco production. Before such action was taken by the Japanese government, the small scale manufacturers did not produce the high quantity seen after 1900. With the government in control, an improvement in manufacturing, an increase in the importation of tobacco leaves, and the fixing of price, there ensued a vaulting of production of cigarettes in Japan (Okurasho, 1905). As a result, while other studies suggest differing times to the beginning of significant cigarette smoking in Japan, history shows that with government control in 1904, the high demand is alleviated through improved technology and an increase of smokers naturally ensued. Nevertheless, the consumption of cigarettes by both nations differ drastically.
Figure 2: Number of cigarettes consumed per adult per year in the United States and Japan, 1920-1985. U.S.A. Japan ... - - -/ / 9% V 9% / 9% - - - -I / I I. I I I / - - -.1930 1940 4,500 4,000 3,500 3,000-2,500 2,000 1,500 1,000 500 0 19 (Wynder et al., 1991) IL -.. V E 0 U, 0 C) '4 0 4' z 1950 Year 20 1960 1970 1980 I
Manufactured cigarettes consumed by males and females ages 15 years and older were 20,954 in
1920 for Japan and 44,656 for the same year in the United States. By 1950, the numbers both
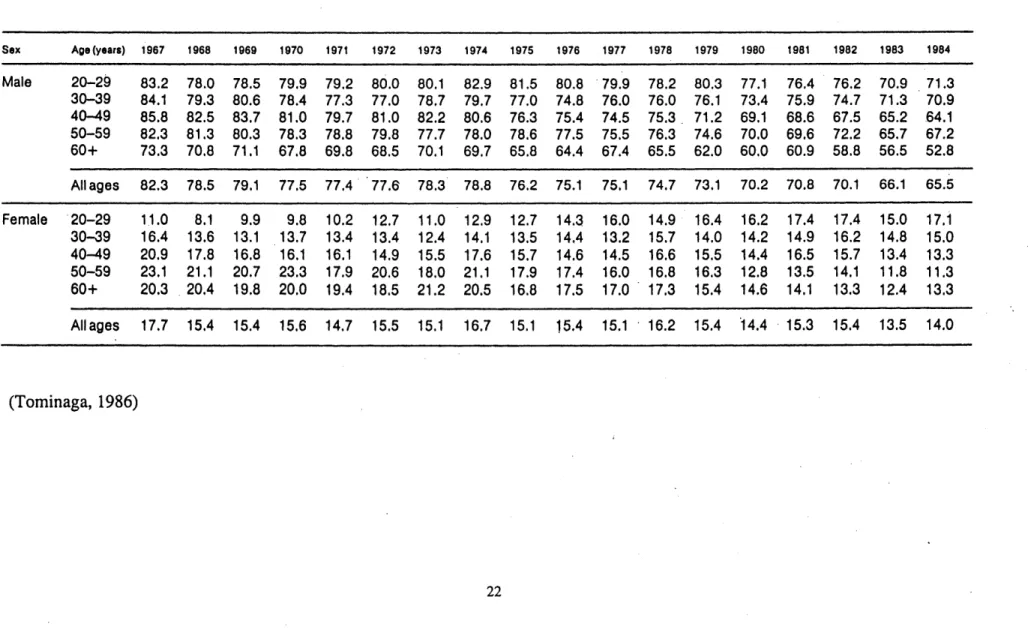
increased to 65,298 and 360,199 for Japan and the United States, respectively (Nicolaides-Bouman et. al., 1993). Indeed, the number of cigarettes consumed increased to amazing numbers (most notably in the United States), but another important statistic documented is the percentage of smokers in both nations. Tominaga gave evidence of such numbers where sex- and age-specific percentage of smokers aged 20 and older in Japan were given (see Table 2) (1986). As indicated by the table, there has been a decrease in the number of males smoking where a high of
82% is seen in 1967 and in 1984, the percentage drops to 65.5. In the case of females, however,
there seems to be a consistency in smoking habits, where the percentage has been maintained at
15. It should be noted that obtaining data on smoking habits for Japan was not gathered until 1958 by Japan Tobacco Inc., the premier supplier of tobacco products in Japan. And as the case
is with Japan, such percentages are also available for the United States, where male smokers comprised 50% of the population in 1955, and females, 27%. However, where the percentage of males seem to be decreasing with a low of 31 in 1985, females reach a maximum of 37% in
1979, and gradually decrease to 28% in 1985. With numerous reports indubitably showing a
connection between smoking and lung cancer, such discussion of these cases is warranted to provide what scientists have analyzed to show just cause. However, this look into the studies will be focused on what has been seen with lung cancer in the United States and Japan. Since lung cancer is shown to have increased dramatically in the past century globally, it is now said that 80 to 90% of all cases are caused by tobacco, mainly the smoking of manufactured
cigarettes. To coincide this statistic, lung cancer was the leading cause of cancer death in men for 28 countries back in 1986 (Cullen, 1986). This being the case, enormous strides to control this worldwide epidemic have been numerous, and as indicated by the smoking statistics shown earlier, the effects of such efforts may actually be materializing.
Using these statistics, comparisons can be made between countries to identify if smoking is indeed responsible for what is being experienced by said countries. This is indeed the case with Japan and the United States, where several reports have provided mortality data for lung cancer
Table 2: Sex- and age-specific percentage of smokers aged 20 years and over in Japan Sex Age(years) 1967 1968 1969 1970 1971 1972 1973 1974 1975 1976 1977 1978 1979 1980 1981 1982 1983 1984 Male 20-29 83.2 78.0 78.5 79.9 79.2 80.0 80.1 82.9 81.5 80.8 79.9 78.2 80.3 77.1 76.4 76.2 70.9 71.3 30-39 84.1 79.3 80.6 78.4 77.3 77.0 78.7 79.7 77.0 74.8 76.0 76.0 76.1 73.4 75.9 74.7 71.3 70.9 40-49 85.8 82.5 83.7 81.0 79.7 81.0 82.2 80.6 76.3 75.4 74.5 75.3. 71.2 69.1 68.6 67.5 65.2 64.1 50-59 82.3 81.3 80.3 78.3 78.8 79.8 77.7 78.0 78.6 77.5 75.5 76.3 74.6 70.0 69.6 72.2 65.7 67.2 60+ 73.3 70.8 71.1 67.8 69.8 68.5 70.1 69.7 65.8 64.4 67.4 65.5 62.0 60.0 60.9 58.8 56.5 52.8 All ages 82.3 78.5 79.1 77.5 77.4 77.6 78.3 78.8 76.2 75.1 75.1 74.7 73.1 70.2 70.8 70.1 66.1 65.5 Female 20-29 11.0 8.1 9.9 9.8 10.2 12.7 11.0 12.9 12.7 14.3 16.0 14.9 16.4 16.2 17.4 17.4 15.0 17.1 30-39 16.4 13.6 13.1 13.7 13.4 13.4 12.4 14.1 13.5 14.4 13.2 15.7 14.0 14.2 14.9 16.2 14.8 15.0 40-49 20.9 17.8 16.8 16.1 16.1 14.9 15.5 17.6 15.7 14.6 14.5 16.6 15.5 14.4 16.5 15.7 13.4 13.3 50-59 23.1 21.1 20.7 23.3 17.9 20.6 18.0 21.1 17.9 17.4 16.0 16.8 16.3 12.8 13.5 14.1 11.8 11.3 60+ 20.3 20.4 19.8 20.0 19.4 18.5 21.2 20.5 16.8 17.5 17.0 17.3 15.4 14.6 14.1 13.3 12.4 13.3 Allages 17.7 15.4 15.4 15.6 14.7 15.5 15.1 16.7 15.1 15.4 15.1 16.2 15.4 14.4 15.3 15.4 13.5 14.0 (Tominaga, 1986)
and shown how smoking interacts with this data (Kristein, 1986; Wynder et. al., 1986, Tominaga,
1986, Wynder et. al., 1992). Tominaga, in a presentation to the International Agency for
Research on Cancer, conveyed cancer patterns related to smoking. His main focus was
incidentally on lung cancer, but he did provide information on the trends of age-adjusted death rates for numerous cancers, including stomach, colon and rectum, breast, and pancreas. The most insightful information deals with the trends of the percentage of smokers per age group for males and females. In a graphical format, he identifies that although females maintain similar smoking habits for the period 1967-1984, there seems to be an increase in female smokers for the age group 20-29, which indicates a strong tobacco following by the young Japanese woman of today (see Figure 3).
When comparing Japanese data to American data, there seems to be a consensus that there are similar trends between both nations. Kristein reports that barring major changes in policy, he expects an epidemic of lung cancer in underdeveloped countries over the next 20 to 40 years (Kristein, 1986). Using Japan as an example and using a 20-year lag time for the effects of smoking, he shows a similar relationship between the United States and Japan. Using the following equation:
l' =a+bXi2 0
the relationship between mortality rates and per capita cigarette consumption results in a calculated slope of 0.0061 for Japan, which is very close to the United States' value of 0.0076. In conclusion, Kristein states that the mortality rates for Japan will be rising as seen in the United States and that Japan, being representative of a non-Western developing country, is indicative of what such countries are to expect. Although simplistic in it's statistical method, other studies have concluded similarly. Wynder et. al.'s study on the comparative epidemiology of cancer between the United States and Japan give thorough analyses of the effects of smoking, alcohol, and diet to the differences in cancer trends. Reporting similar data to that of Tominaga for Japan, this study includes US data as well. Graphical representations of sex-specific, age-adjusted mortality rates versus calendar years was done for each cancer (see figure 4). Using
Figure 3: Relative trends in the percentage of smokers by sex and age group in Japan Males 2.01 1.514 1.0-1. |.0 1 1 1 1 4 1967- 1970- 1973- 1976- 1979- 1962-1969 1972 1976 1978 1961 194' Year Females 20-29 30-39 .0" * -- -- 40-49 e 600 60-69 1067- 1970- 1973- 1076- 1970- 1982-1969 1972 197S 1978 1961 1664 Year (Torninaga, 1986) S *2 -. -0-39 40-49 0. 05 P
Figure 4: Sex-specific, age-adjusted mortality rates for colon cancer in the and Japan, 1955 to 1985. 35- 30-0 0 0
0
0 0. 25- 20- 15- 10- 5-0 United States US White Male 0f US White Female Japanese Male Japanese Female *1 1955 1965 1975 1985 Year (Wynder et al., 1991) doom o wo ~these graphs for comparison between Japan and the United States, this study concludes that the differences in social habits could be responsible for "substantial differences in mortality rates of specific anatomic sites" (Wynder et. al., 1986). Moreover, Wynder et. al., several years later revisited this topic and expanded on their conclusions by stating that fat intake shows a linear relationship to lung cancer, and that this dietary fat "may modulate the carcinogenic effects of tobacco smoke" (Wynder et. al., 1992). This was concluded from the analyses of comparing smoking and fat intakes in the years 1955 through 1975 to age-adjusted mortality rates recorded
Figure 5: Relationship between lung cancer mortality and smoking in males in the United States and Japan (1955-1975)
1975 136 1970 1 59 19s'5 : Japan 1. u.
10 Years Time Lag
20 Years Time Lag
C'80 -7- J -0 0 070 6 0 60 CL -40 - 30-V W 20-(10. 40 50 60
Percetang. of Mai* Smokors70 80
(Wynder et al., 1992)
Figure 6: Relationship between lung cancer mortality and fat consumption Unites States and Japan (1950-1975)
0 0 0 070 0 60. C 40' 3 020 $10 -0 T 0 o U.S. * Japan
- 10 Years Time Lag
--- 20 Years Time Lag
1197 1 -.0 1975 / 91970 1W 196 19604 iss 1968 I9so 10 20 .30
Fat Consumption (% of Calories)
in males in the 196s. 197S 19s0 1970 19ss 1965 - 190 40 (Wynder et al., 1992) 197S Ar 1965 1970 4'19 6 0 ISS5 ®r1965 1960 1955 90
3. MATERIALS AND METHODS
3.1 Materials
In order to model Japanese data alongside American data, the means in which it was formatted is very important. Herrero-Jimenez et al. developed a format for American data in which the mortality deaths were entered for each calendar year for each five-year age group beginning with ages 0-4 and extending to the age group of 100 and over (1998). The raw data from the Ministry of Health and Welfare was generously copied by Dr. Mutsuhiro Nakao from the University of Tokyo. The raw data was provided in a format similar to that of American data from the United States Department of Health, Education, and Welfare. In addition, total population numbers were entered for each calendar year dating back to 1951, the first year Japanese data is well-documented. This format, done in Microsoft Excel, then calculated the mortality rate of
observed deaths (OBS(t)) per 100,000 inhabitants. The purpose of this procedure was to give a weighted value to the observed deaths and then provide a means to compare these values with each birth year for each age group as previously mentioned before.
3.2 Methods
Use of excel format to establish continuity of data
The format seen for the United States data was utilized in compiling the Japanese data. As such, the comparative analysis can be accomplished with great consistency. The only drawback is the differing periods of available data where certain cancers in the United States date back earlier than 1951. The entering of data was performed for all cancers provided. Using the American data as a guideline, the Japanese data was entered and reviewed to confirm consistency with changes in the International Classification of Diseases. Since the data spans four decades, there
and contrast mode between both nations, the twelve most prevalent cancers seen in the United States were then analyzed. The list of these twelve cancers are identified below:
1. Lung 2. Colon/Rectum 3. Breast 4. Prostate 5. Pancreas 6. Stomach 7. Cervix uteri/Ovary 8. Non-Hodgkin's lymphoma 9. Leukemia 10. Brain
4. RESULTS AND DISCUSSION
4.1 Comparative analyses of twelve cancers
The main aspect of this project focused on the analyses of the data through a different mode of graphical format. In establishing what initial results showed, an example of the these results for lung cancer is shown in Table 3a and 3b and figure 7a and 7b, where the OBS(t) per 100,000 are grouped in birth-year decades and graphed to show its trend by age. Additionally, the mortality graphs for each cancer are located in Appendix A for easy reference. In effect, each cancer provided an overall depiction of what different birth cohort decades dating back to 1850
experienced for all age groups. Therefore, as the case with lung cancer, there is an indication of a sharp increase from birth cohort decade 1860 to 1870 and subsequent jumps in mortality which suggests that individuals in these birth cohorts may have experienced different environments to those of earlier birth cohorts (i.e. 1840's and 1850's). With every cancer, a direct comparison was made between the United States and Japan.
The primary analysis done converted the data into a graphical presentation showing birth cohorts against observed deaths for several age groups. This setup identified the trends and provided a means to clearly compare the differences between the United States and Japan. Moreover, this format at analyzing data is very different to the approach that Wynder explored when examining trends for certain cancers in his study (1986). His approach concentrated on sex-specific, age-adjusted mortality rates where data for all age groups for each cancer was examined for each calendar year. As mentioned before, this examination does provide information on the deaths for each calendar year, yet fails to compare different groups of people born in the same year falling
victim to a specific cancer. As a result, there is no direct relationship given to how people experiencing the same environment can be compared to other birth cohorts and thus convey changes in the environment as responsible to identified trends. Therefore, this means of analysis
Table 3a: Lung Cancer Mortality per 100,00 individuals in Japanese Males per Decade 1840s 1850s 1860s 1870s 1880s 1890s 1900s 1910s 1920s 1930s 1940s 1950s 1960s 1970s 1980s 1990s 0.5 1840s 1850s 1860s 0.0 0.0 0.0 0.0 0.0 3 0.0 0.0 0.0 0.0 0.0 0.0 7.5 0.0 0.0 0.0 0.0 0.0 12.5 0.0 0.1 0.1 0.0 0.0 0.0 17.5 0.2 0.2 0.1 0.1 0.0 22.5 0.1 0.3 0.2 0.1 0.1 0.1 27.5 0.3 0.4 0.4 0.4 0.3 32.5 0.2 0.6 0.8 0.9 1.1 0.9 37.5 1 0.8 1.5 2.0 2.3 3.1 42.5 0.9 2.4 3.9 4.8 5.9 7.8 47.5 4.1 7.3 9.2 11.4 12.3 52.5 5.1 11.9 18.7 22.0 24.7 25.0 57.5 14.5 31.3 41.1 50.1 53.2 62.5 13.0 34.9 67.0 85.0 102.5 110.5 67.5 33.1 75.7 126.7 166.2 189.0 72.5 17.8 59.9 133.9 222.1 287.1 292.41 77.5 27.9 92.7 185.8 341.1 428.4 82.5 3.9 35.8 107.1 242.6 457.9 540.8 87.5 13.6 38.5 113.9 299.6 519.8 92.5 24.6 15.6 37.3 130.9 320.3 473.3 97.5 0.0 12.0 62.5 133.1 290.0 1 102.5 0.0 0.0 153.8 146.8 258.8 1 1
Table 3b: Lung Cancer Mortality per 100,000 individuals for Japanese Females per Decade
1840s 1850s 1860s 1870s 1880s 1890s 1900s 1910s 1920s 1930s 1940s 1950s 1960s 1970s 1980s 1990s 0.5 0.0 0.0 0.0 0.0 0.0 3.0 0.0 0.0 0.0 0.0 0.0 0.0 7.5 0.0 0.0 0.0 0.0 0.0 12.5 0.0 0.1 0.0 0.0 0.0 0.0 17.5 0.1 0.1 0.1 0.0 0.0 22.5 0.1 0.1 0.1 0.1 0.1 0.1 27.5 0.2 0.3 0.3 0.3 0.3 32.5 0.1 0.5 0.7 0.8 0.7 0.6 37.5 0.7 1.4 1.5 1.7 1.7 42.5 1.1 1.9 2.8 2.8 3.4 3.7 47.5 2.5 4.4 5.2 5.5 6.1 52.5 2.1 5.5 8.9 9.0 10.0 10.6 57.5 5.2 11.6 14.7 16.0 16.8 62.5 5.4 12.2 21.9 25.0 27.0 28.1 67.5 10.2 24.6 34.6 43.2 45.3 72.5 6.5 16.9 38.5 56.7 70.5 73.6 77.5 8.9 28.5 52.1 87.1 105.3 82.5 3.6 11.0 33.0 70.6 123.4 152.3 87.5 3.8 16.4 37.6 97.9 158.9 92.5 0.0 4.9 17.0 44.1 124.9 171.11 97.5 0.0 19.0 23.2 58.3 158.5 102.5 0.0 0.0 97.7 1
Figure 7a: Age vs. OBS(t) per 100,000 individuals for Lung Cancer (Japanese males)
JM -L un g
Birth Year
--- 1840s ---- 1850s -o---1860s . 1870s >:- 1880s > 1 890s -- I- 190 s --- - 1 (Is M0600
500
400
300
200
100
10 20 30 40 50 60 70Age (years)
80 90 100 110Figure 7b: Age vs. OBS(t) per 100,000 individuals for Lung Cancer (Japanese females)
JF-Lung
Birth Year
10 20 30 -1850s 1870s 1890s 1910s 1930s 1950s 1970s 1990s -r-80 - I 1 40 50 60 70Age (years)
---a--- 1920s ---A--- 1930s --- o--- 1940s ---e--- 1950s --- 1960s ---+*--- 1970s 6 -x--- 1980s --- * -- 1990s V-U C)0
0
0180
160
140
120
100
80
60
40
CD 0:) cf 0) -o--1840s -0 1860s X-: 1880s --- 3--- 1900s ---o--- 1940s --- 0--- 1960s ---x--- 1980s2
00
0 I - -I 1090 100 110
---on data using a standard populati---on to dictate comparability. What ensued in most cases were significant differences with respect to the most prevalent cancers seen in the United States. For each cancer, the analysis of converting the data into a graphical presentation showing birth cohorts against observed deaths for several age groups is exemplified in Figure 8. In each case, with respect to the age group, one can identify an increasing or decreasing trend plus determine the year at which this slope change occurred. What is interesting about this form of analysis is the simplicity in identifying sharp contrasts between both countries. The graphs for each cancer, male and female, and their respective age groups can be found in appendix B; however, an overview of what was ascertained is discussed to some extent.
4.1.1 Lung cancer
To begin, an initial analysis was done on lung cancer which identified a striking similarity between European American Males (EAM) and Japanese Males (JM) where a steep increase is observed in the number of deaths for the older age groups (60-64 and 70-74). If one views the graphs, one discovers that the increase in slope for JM is almost exactly to that of EAM. In response, this clearly suggests the effect of cigarettes on the mortality rates in Japan as the case is undoubtedly seen in the United States. As for the female population, Herrero-Jimenez, in his analysis of the effects of smoking on EAM and European American Females (EAF) identified a
30 year lag between the first glimpses of an increase in lung cancer mortality for EAM and EAF
(Herrero-Jimenez, personal communication). However, when one considers toying with this idea for JM and Japanese females (JF), such a lag is not evident. What is evident is a slow, but gradual increase in the number of deaths compared to that of EAF. This situation, however, will be further analyzed more thoroughly with a comparative example seen with American data. In the other cancers, a general approach to the findings will be discussed. Each cancer will be touched upon for any significant trends and the relationship will then be analyzed coinciding with the history of given causes to each disease and the status of the United States and Japan with such variables in mind. As a result, the findings should help validate time periods where
Figure 8: Birth Cohort vs. OBS(t) per 100,00 individuals for Lung Cancer Age Group 70-74 (Japanese males)
0.500
o400
USA
300
. 2
-Japan
0L.200
100
--Cl)
01850
1900
1950
Birth Cohort
environmental factors can be linked to mortality rates seen for each cancer. Moreover, this identification of trends will illustrate the advantage of age-dependent birth year cohort-specific data over the previous use of age-adjusted death rates.
4.1.2 Colon and rectal cancers
In the case of colon cancer, it was in the best interest of what is currently known about this disease to include rectal cancer in this comparative analysis. Although they are analyzed together, the results were identified in individual formats. When colon cancer is discussed, the one cause which has consistently been noted is the factor of dietary fat in the average American. The effect of its oxidized product, the elevated production of free bile acids, and the production of fecal mutagens and ketosteroids have prompted such a strong impression to its relevance (Creath, 1990). As the colon graphs show for all designated age groups, there is a constant mortality rate of 100 per 100,000 Americans for both males and females. However, the
mortality rate for Japanese males and females have a steeper increase where males born in 1879 die at a rate of 20 per 100,000 and those born in 1922 are dying at a higher rate of 60, which is approximately two-thirds of what it is in the United States. Therefore, a Japanese in 1951
compared to one in 1994 did not share a similar background suggesting a possible environmental factor involved.
And as the case in the United States, the idea of dietary fat being responsible for this increase is being transferred to the Japanese. The "westernization" of Japan has been singled out as the cause to the observed evolving changes, and the increase in colon cancer is just one of them. Ikuko et. al. showed in their study that data spanning from 1949-1984 of Japanese residents gave relative risks for colon cancer due to fat intake at 2.67 for men and 2.30 for women. One might conclude such an increased risk to be confirmed by the increase in the disease historically. However, as mentioned before, the increase in fat consumption did not begin until after World War II, and moreover, this increase does not reach half of American intake numbers until the 1990's. A study denotes this increase in fat consumption with evidence exemplified by Table 4 (Wynder et al., 1992). As the data shows in each age group, the later the birth cohort, an increase
in mortality ensues. Unfortunately, more studies need to be done to confirm fat consumption as the sole contributor. Although the data shows an experience change in diet after the 1950's, other environmental factors cannot be ruled out.
Coincidentally, rectal cancer has been a constant partner to the effects taken upon colon cancer, where it is assumed that what affects the colon will normally affect the rectum due to its location. However, the data suggests that there may not be a connection with the differing mortality trends in both nations. As colon cancer indicates a steady-state of deaths in the United States, there is a noticeable decrease in rectal cancer in later birth cohorts. And what is more intriguing is the mortality rates seen in Japan. Where colon cancer seems to be on the rise, the number of rectal cancer deaths seems to be either steady or declining. Furthermore, the number of rectal cancer deaths in Japan is seen to be higher than that of Americans, both male and female for birth cohorts after 1910 for early age groups and for birth cohorts after 1890 for later age groups. Amazingly, the effects are sporadic in terms of different birth cohorts for changing trends in all age groups. It is evident from these graphs that no one environmental factor can be responsible for the changing trends.
And what do studies suggest as causes to rectal cancer in Japan? Several studies have denoted alcohol, namely beer, as an increasing factor (Kabat et. al. 1986, Kune et. al. 1987, Ribol et. al.
1991). Yet, other studies showed this to be untrue (Potter and McMichael 1986, Tuyns et. al. 1988). Another study actually listed numerous foods and examined the relative risks with respect
to the number of Japanese that ate these items and were later diagnosed with rectal cancer. The results showed an increased risk with salty foods, boiled fish, and pickled vegetables
(Hoshiyama, 1993). What mostly results from what is seen in the data and the literature is that there is inconclusive results to the differing trends seen between colon and rectal cancer, and that epidemiologically, the diet question provides no firm conclusions to explain these trends.
Table 4: Trend in per Capita Fat Consumption
(percentage of calories) in United States and Japan
United States 40.0 41.5 41.5 41.6 42.3 41.9 41.8 43.5 Japan 7.9 8.7 10.6 14.8 18.7 22.3 23.6 24.5 (Wynder et al., 1992) Year 1950 1955 1960 1965 1970 1975 1980 1985
4.1.3 Breast cancer
Breast cancer is the leading form of death in American women thus research for this type of cancer is at an all-time high. Nonetheless, there has still been few earth-shattering breakthroughs to the etiology of this disease. It has been postulated that a high-fat diet is one reason for the high incidence of breast cancer in EAF. Additionally, the discovery of the BR CA1 gene is said to be the genetic basis for familial breast cancer in society, although only placed at 5-10% of all cases (Watanabe, 1993). Interestingly enough, viewing the mortality data for both the United
States and Japan helps illustrate such ideas and provides a physical picture in trying to validate them.
When one investigates the trends seen in both American and Japanese data, one would be surprised to see a constant number of deaths in all age groups for EAF and a slight increase in deaths for JF. What is evident about this data is the increasingly high number of deaths in EAF compared to that of JF. EAF show the highest number of deaths at 100 per 100,000 females at ages 70-74, whereas JF show an increase which results at 20 deaths per 100,000 Japanese females. Such evidence show that no change has occurred in the past 100 years for American females that indicate any trend (increase or decrease). However, with the JF, the increase seen in all age groups should be explored.
With the discovery of the BRCA1 gene, evidence to connect the genetic variable should provide better answers to its involvement in causing of breast cancer. Unfortunately, as stated earlier, the percentage of cases, approximately 5-10%, are deemed familial regarding this gene. And such numbers are seen in Japan as well, thus genetics cannot entirely explain the difference in deaths between both countries (Watanabe 1993, Inoue et. al. 1995). Additionally, a study by Stanford et al. showed that the migration of Asian women, both Japanese and Chinese, to the United States prompted an increase in breast cancer incidence relative to women in the Asian countries (1995). This identifies that environmental factors must be the reason for the differences seen between the
is interesting about this event is that reports show an increase of deaths, but not a significant trend that would explain the national increase seen in Japan. Moreover, these same reports indicate that the candidates for breast cancer who were exposed to radiation are women under 20, thus suggesting women born around the mid-1920's. The time frame to when these women
would be affected was not explicitly detailed. One study suggests that the breast tissue of this age group is more sensitive than that of older women. Using this data format, one would then most likely see a sharp increase at around this birth cohort, but rather one sees a gradual increase. As a result, this one event cannot entirely be responsible to what is being seen historically
(Wanebo et al., 1968; McGregor et al., 1977; Tokunaga et al., 1979). But later to be seen with leukemia cases, the population affected would have to be studied to seriously consider this event as a significant precursor to deaths from breast cancer. And if proven true, this could very well, be a contention that the younger women exposed during this period would reflect an increasing number of deaths.
4.1.4 Prostate cancer
Prostate cancer is the second leading cause of deaths in American males. It has been on a constant rise this century. However, the number of deaths is over three times that of Japan. In the graphs provided, there is a distinct difference on the prevalence of the disease in each country. What is amazing about the findings is that where prostate cancer is slightly decreasing at middle-age groups in the US, there is a sharp increase in later age groups which could be attributed to better therapy, extending their lives. Additionally, there seems to be a constant increase in the deaths seen in Japan for all age groups.
As the case is with breast cancer, there has been speculation to the contribution of dietary fat to this increase in mortality. Migrating data have shown that the Japanese, who have one of the lowest incidence rates of prostate cancer in the world, and when migrate to places with higher incidence, increase their risk of developing prostate cancer. Studies have shown that the incidence rate of Japanese in Hawaii indeed increases to that of native Japanese for
its etiology is of great interest. Although there have been studies that have investigated such socioeconomic factors such as sexual activity, past history of venereal disease, and the number of children, there has been conflicting data concurring these suppositions (Steele et. al. 1971, Krain
1974, Armenian et. al. 1975, Greenwald et. al. 1974). In addition, there have been numerous reports pursuing the diet angle, and examining foods that may be responsible for an increased risk of prostate cancer. Such examples of these include meat, fish, eggs, and dairy items. But the effect of fat consumption has been the focus of highest speculation.
Even though there has been conflicting reports to the effects of fat consumption, there is the idea of dietary fat and prostate cancer focusing on specific fatty acids, which are of animal origin rather than vegetable origin (Rose and Connolly, 1992). In their review they conveyed that certain fatty acids may be stimulators of cancer cell growth and others acting as inhibitors. Such examples were done in experiments using LA, an n-6 polyunsaturated fatty acid (PUFA) and docosahexaenoic acid (DHA) and eicosapentaenoic acid (EPA), two n-3 fatty acids. The results showed that LA stimulated growth of the cancer cells and the n-3 fatty acids inhibited its growth. The report added that this may be linked to therapy, where these results could possibly be applied to decreasing the effect of prostate cancer, which have been shown to be in a latent state, and thus no overt signs of the disease is ever noticed until death (Breslow et al., 1977). Unfortunately, as interesting as this research may provide another perspective in explaining the cause of prostate cancer, examination of different fats must be done in both countries to identify if such a theory holds.
One study, however, took a different step in this campaign, and looked at the p53 mutational spectra of prostate cancers in Japan and the United States (Watanabe et. al., 1997). Their results showed distinct differences in mutations seen in each country. Where Americans and Europeans had a large percentage of transitions in p53, Japanese had a prevalence of transversions. This result establishes that there could be differing factors, that can play a role in the development of
4.1.5 Pancreatic cancer
Pancreatic cancer is the cancer with the lowest 5-year survival rate, which currently is at 3-4%. Because it is normally detected at an advanced stage, effective treatment is naturally futile. What is curious about this disease with the data sets is the most similar trends seen in both the United States and Japan. At earlier age groups, there seems to be an equal number of deaths in both countries of around 0.5-3 and 0.3-1.5 deaths per 100,000 for males and females, respectively. However, there is a switch in the increase of pancreatic cancer deaths in the middle age to older age groups. Whereas both countries show an increase, there is a lag time for this increase in JM and JF compared to that of EAM and EAF. This may help suggest that there is indeed an
environmental factor associated with this lag time where Americans seem to indicate an increase before documented data (birth cohort 1858) and the Japanese follow with a steep increase for birth cohort 1879.
To this day, there has been no firm attachment of any etiologic agent to the cause of pancreatic cancer. From diet to working conditions, numerous studies have shown correlations to
pancreatic cancer, but only weak associations at that. However, a risk association to smoking has been suggested as a means to the increase in its mortality. But as the case with lung cancer in the United States, the effects of smoking would be naturally seen in the data, yet with pancreatic cancer this effect is not seen. What is seen is sharp increases in both the American and Japanese data, and what is amazing is that the increase is seen from the beginning of recorded data, that of the 1860 birth cohort for 70-74 EAM and EAF and 1889 for 70-74 JM and JF. The only
difference is that in the 1980s, both curves converge, and both Japanese genders then surpass
EAM and EAF. What may be evident here is that genetic factors may dictate the evolvement of
pancreatic cancer. It is possible that the effects of "westernization" may have spurred and compounded the situation in Japan. The data, however, does not-agree to what is seen with lung cancer, thus the smoking hypothesis cannot be validated.
It has indeed been investigated that certain environmental factors, most notably, coffee and a high intake of fat, may play roles in the development of pancreatic cancer (MacMachon et. al.
1981, Binstock et. al. 1983, Durbec et. al. 1983, Stensvold and Jacobson 1994). But again, the
mentioned factor of smoking should seriously be reviewed, since the data sets do not show lags in the disease by EAF and the same cannot be said of JM and JF. Also, improvement in
diagnosis of pancreatic cancer may partially explain the increase in mortality via better documentation of the disease, thus being responsible for the increasing number of deaths.
4.1.6 Stomach cancer
When one is asked about which cancer shows an axiomatic difference in mortality deaths between the United States and Japan, the answer is undoubtedly the cancer of the stomach. Stomach cancer is the most prevalent cancer in Japan, and in the United States, where in the beginning of the 2 0th century was one of the leaders in mortality, has now become one of the least seen. The peculiar cause of what dictates it's intense appearance in Japan has stifled many scientists this century. However, in 1982, the discovery of the bacterium, Helicobacter pylori, by Warren and Marshall has actually defined a new perspective to this cancer's possible origin. Nevertheless, other theories such as the advent of refrigeration, salt consumption, and a vegetable and fruit-based diet are also used to explain the trends seen for stomach cancer in the United States.
As for the trends seen in both the United States and Japan, one only has to look at the graphs to mirror generalizations in numerous studies. In every age group, there has been a decreasing trend in the observed deaths seen for EAM and EAF from the beginning of the century until a constant number is reached at the later birth cohorts. Ironically, with so much emphasis on the high mortality rate seen in Japan, there has actually been a significant drop of observed deaths in all age groups. Not a gradual decline as in the European Americans, this decrease is more steep and begins at exactly 1961 (birth cohort 1889) for all age groups. So the question that arises is the cause to this decreasing trend?