HAL Id: hal-01960114
https://hal.sorbonne-universite.fr/hal-01960114
Submitted on 19 Dec 2018
HAL is a multi-disciplinary open access
archive for the deposit and dissemination of
sci-entific research documents, whether they are
pub-lished or not. The documents may come from
teaching and research institutions in France or
abroad, or from public or private research centers.
L’archive ouverte pluridisciplinaire HAL, est
destinée au dépôt et à la diffusion de documents
scientifiques de niveau recherche, publiés ou non,
émanant des établissements d’enseignement et de
recherche français ou étrangers, des laboratoires
publics ou privés.
Mendelian randomisation study of the relationship
between vitamin D and risk of glioma
Hannah Takahashi, Alex Cornish, Amit Sud, Philip Law, Ben Kinnersley,
Quinn Ostrom, Karim Labreche, Jeanette Eckel-Passow, Georgina Armstrong,
Elizabeth Claus, et al.
To cite this version:
Hannah Takahashi, Alex Cornish, Amit Sud, Philip Law, Ben Kinnersley, et al.. Mendelian
randomi-sation study of the relationship between vitamin D and risk of glioma. Scientific Reports, Nature
Publishing Group, 2018, 8 (1), pp.2339. �10.1038/s41598-018-20844-w�. �hal-01960114�
Mendelian randomisation study of
the relationship between vitamin D
and risk of glioma
Hannah Takahashi
1, Alex J. Cornish
1, Amit Sud
1, Philip J. Law
1, Ben Kinnersley
1,
Quinn T. Ostrom
2, Karim Labreche
1, Jeanette E. Eckel-Passow
3, Georgina N. Armstrong
4,
Elizabeth B. Claus
5,6, Dora ll’yasova
7,8,9, Joellen Schildkraut
8,9, Jill S. Barnholtz-Sloan
2,
Sara H. Olson
10, Jonine L. Bernstein
10, Rose K. Lai
11, Minouk J. Schoemaker
1,
Matthias Simon
12, Per Hoffmann
13,14, Markus M. Nöthen
14,15, Karl-Heinz Jöckel
16,
Stephen Chanock
17, Preetha Rajaraman
17, Christoffer Johansen
18, Robert B. Jenkins
19,
Beatrice S. Melin
20, Margaret R. Wrensch
21,22, Marc Sanson
23,24, Melissa L. Bondy
4,
Clare Turnbull
1,25,26& Richard S. Houlston
1,27To examine for a causal relationship between vitamin D and glioma risk we performed an analysis of genetic variants associated with serum 25-hydroxyvitamin D (25(OH)D) levels using Mendelian randomisation (MR), an approach unaffected by biases from confounding. Two-sample MR was undertaken using genome-wide association study data. Single nucleotide polymorphisms (SNPs) associated with 25(OH)D levels were used as instrumental variables (IVs). We calculated MR estimates for the odds ratio (OR) for 25(OH)D levels with glioma using SNP-glioma estimates from 12,488 cases and 18,169 controls, using inverse-variance weighted (IVW) and maximum likelihood estimation (MLE) methods. A non-significant association between 25(OH)D levels and glioma risk was shown using
1Division of Genetics and Epidemiology, The Institute of Cancer Research, London, UK. 2Case Comprehensive Cancer Center, School of Medicine, Case Western Reserve University, Cleveland, Ohio, USA. 3Division of Biomedical Statistics and Informatics, Mayo Clinic College of Medicine, Rochester, Minnesota, USA. 4Department of Medicine, Section of Epidemiology and Population Sciences, Dan L. Duncan Comprehensive Cancer Center, Baylor College of Medicine, Houston, Texas, USA. 5School of Public Health, Yale University, New Haven, Connecticut, USA. 6Department of Neurosurgery, Brigham and Women’s Hospital, Boston, Massachusetts, USA. 7Department of Epidemiology and Biostatistics, School of Public Health, Georgia State University, Atlanta, Georgia, USA. 8Duke Cancer Institute, Duke University Medical Center, Durham, North Carolina, USA. 9Cancer Control and Prevention Program, Department of Community and Family Medicine, Duke University Medical Center, Durham, North Carolina, USA. 10Department of Epidemiology and Biostatistics, Memorial Sloan Kettering Cancer Center, New York, New York, USA. 11Departments of Neurology and Preventive Medicine, Keck School of Medicine, University of Southern California, Los Angeles, California, USA. 12Department of Neurosurgery, University of Bonn Medical Center, Sigmund-Freud-Str. 25, 53105, Bonn, Germany. 13Human Genomics Research Group, Department of Biomedicine, University of Basel, Basel, Switzerland. 14Department of Genomics, Life & Brain Center, University of Bonn, Bonn, Germany. 15Institute of Human Genetics, University of Bonn School of Medicine & University Hospital Bonn, Bonn, Germany. 16Institute for Medical Informatics, Biometry and Epidemiology, University Hospital Essen, University of Duisburg-Essen, Essen, Germany. 17Division of Cancer Epidemiology and Genetics, National Cancer Institute, Bethesda, USA. 18Institute of Cancer Epidemiology, Danish Cancer Society, Copenhagen, Denmark, Rigshospitalet, University of Copenhagen, Copenhagen, Denmark. 19Department of Laboratory Medicine and Pathology, Mayo Clinic Comprehensive Cancer Center, Mayo Clinic, Rochester, Minnesota, USA. 20Department of Radiation Sciences, Umeå University, Umeå, Sweden. 21Department of Neurological Surgery, School of Medicine, University of California, San Francisco, California, USA. 22Institute of Human Genetics, University of California, San Francisco, California, USA. 23Sorbonne Universités UPMC Univ Paris 06, INSERM CNRS, U1127, UMR 7225, ICM, F-75013, Paris, France. 24AP-HP, Groupe Hospitalier Pitié-Salpêtrière, Service de neurologie 2-Mazarin, Paris, France. 25William Harvey Research Institute, Queen Mary University, London, UK. 26Guys and St Thomas Foundation NHS Trust, Great Maze Pond, London, UK. 27Division of Molecular Pathology, The Institute of Cancer Research, London, UK. Hannah Takahashi and Alex J. Cornish contributed equally to this work. Correspondence and requests for materials should be addressed to R.S.H. (email: [email protected])
Received: 10 October 2017 Accepted: 24 January 2018 Published: xx xx xxxx
www.nature.com/scientificreports/
both the IVW (OR = 1.21, 95% confidence interval [CI] = 0.90–1.62, P = 0.201) and MLE (OR = 1.20, 95% CI = 0.98–1.48, P = 0.083) methods. In an exploratory analysis of tumour subtype, an inverse relationship between 25(OH)D levels and glioblastoma (GBM) risk was identified using the MLE method (OR = 0.62, 95% CI = 0.43–0.89, P = 0.010), but not the IVW method (OR = 0.62, 95% CI = 0.37–1.04,
P = 0.070). No statistically significant association was shown between 25(OH)D levels and non-GBM glioma. Our results do not provide evidence for a causal relationship between 25(OH)D levels and all forms of glioma risk. More evidence is required to explore the relationship between 25(OH)D levels and risk of GBM.
While glioma accounts for around 80% of malignant primary brain tumours1, thus far exposure to ionising
radi-ation is the only well-established exogenous risk factor2. Vitamin D provides many health benefits, including
increased bone strength and protection against autoimmune diseases and type 2 diabetes3. In-vitro studies have
also suggested an anti-neoplastic role for vitamin D4. Several epidemiological studies have shown that vitamin
D may indeed afford protection against the development of some cancers, including colon, prostate and breast cancer5. Associations in such observational studies do not however constitute evidence for a causal relationship
and in some studies bias from confounding and reverse causation cannot be excluded.
Mendelian randomisation (MR) uses genetic markers as proxies for environmental exposures to determine the effect of the exposure on disease risk6. It therefore provides a strategy for establishing causal relationships
where randomised control trials (RCTs) would involve either high cost or impractical study design. In the case of a possible relationship between vitamin D and glioma, the rarity of the cancer would limit any RCT to small sample sizes and would require lengthy follow up times.
We implemented two-sample MR analysis to examine the relationship between vitamin D and glioma risk in order to avoid the limitations of follow up time, reverse causation and confounding. Genotypes are randomly assigned at conception, thereby limiting confounding. Furthermore an individual’s genotype will always be estab-lished before the onset of disease, excluding the possibility of reverse causation. The genotype is in part equivalent to a lifetime vitamin D deficiency, and hence a lifetime follow-up time in a RCT. We determine the relationship between vitamin D and glioma risk using genetic variants associated with 25(OH)D levels, rather than measuring 25(OH)D levels directly.
Genetic variants identified by the Study of Underlying Genetic Determinants of Vitamin D and Highly Related Traits (SUNLIGHT) Consortium7 and the Canadian Multicentre Osteoporosis Study (CaMOS)8 were used as
an instrumental variable (IV). We performed an MR analysis to test for a causal relationship between 25(OH) D levels and glioma, using summary data from a recent genome-wide association study (GWAS) meta-analysis performed by the Glioma International Case-Control Consortium (GICC)9.
Methods
Two-sample MR was undertaken using GWAS data. Ethical approval was not sought for this specific project because all data came from the summary statistics of previously published GWAS, and no individual-level data were used.
Genetic variant instruments for 25(OH)D level.
Genetic variants used as IVs were selected from thepreviously published SUNLIGHT study7. The SUNLIGHT Consortium GWAS identified four genetic variants
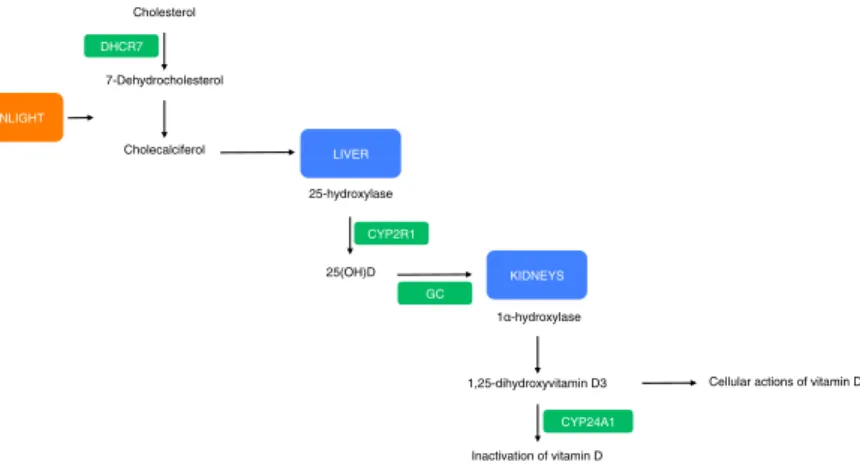
associated with lowered 25(OH)D levels in 33,996 individuals of European descent from 15 cohorts. These vari-ants were rs2282679 in GC (vitamin D binding carrier protein), rs10741657 near CYP2R1 (converter of vitamin D to the active ligand for the vitamin D receptor), rs12785878 near DHCR7 (7-dehydrocholesterol synthesis from cholesterol, a precursor to vitamin D) and rs6013897 in CYP24A1 (degrader of active 1,25-dihydroxyvitamin D3 to inactive vitamin D)10. The roles of GC, CYP2R1, DHCR7 and CYP24A1 in the vitamin D pathway are
shown in Fig. 1. Association estimates (per-allele log-ORs) for SNPs were taken from previously published stud-ies, which used data from the CaMOS study, a population based cohort study of 2,347 Canadians, genotyped and assayed for 25(OH)D levels8,10,11. None of the SNPs were in linkage disequilibrium (i.e. r2 ≥ 0.001). For each SNP,
we recovered the chromosome position, risk allele, genetic locus, F-statistic and association estimates (Table 1). Standard errors (SE) were calculated from F-statistics calculated by previous studies, which derive from the CaMOS cohort11. The risk allele was taken to be the 25(OH)D decreasing allele. Allele frequencies for these SNPs
were compared between the 25(OH)D and glioma data sets to ensure that the effect estimates were recorded with respect to the same allele. This study calculated the variants to account for about 2% of the variation in circulating 25(OH)D levels, and have a combined F-statistic of 12.5712.
Glioma genotyping data.
Association data between the four genetic variants and glioma were taken fromthe most-recent meta-analysis of GWAS in glioma9, which related >10 million genetic variants (after
imputa-tion) to glioma (Supplementary Table 1). This meta-analysis comprised eight GWAS datasets of individuals of European descent: FRE, GER, GICC, MDA, GliomaScan (NIH), UCSF-Mayo, UCSF and UK (Supplementary Table 2). All diagnoses were confirmed in accordance with WHO guidelines. Full quality control details are pro-vided in previously published work9. Gliomas are heterogeneous and different tumour subtypes, defined in part
by malignancy grade (for example, pilocytic astrocytoma World Health Organization (WHO) grade I, diffuse ‘low-grade’ glioma WHO grade II, anaplastic glioma WHO grade III and glioblastoma (GBM) WHO grade IV) can be distinguished13. To avoid diagnostic ambiguity and for simplicity we considered glioma subtypes as being
Statistical analyses.
We examined the association between circulating 25(OH)D levels and glioma (includ-ing subtypes) us(includ-ing MR on summary statistics us(includ-ing the inverse variance weighted (IVW) and maximum likeli-hood estimation (MLE) methods, as described by Burgess et al.14. The combined ratio estimate ( ˆβ) of all SNPsassociated with 25(OH)D levels on glioma risk was calculated under a fixed-effects model:
X Y X (1) i k k k Y k Y 1 2 2 2
∑
β σ σ = = − − ˆXk is the association between SNP k with 25(OH)D levels, Yk is the association between SNP k and glioma risk
with standard error σY. The standard error of this association is given by:
∑
β σ = = − ˆ se X ( ) 1 (2) i k k Y 1 2 2We also conducted a likelihood based analysis using the same genetic summary data15. For this maximum
likelihood estimate, a bivariate normal distribution for the genetic associations was assumed, and the R function
optim was used to estimate β. SE β( ) was calculated using observed information.
With the estimates from the two analyses calculated for each of the eight cohorts in the glioma data, we performed a meta-analysis under a fixed-effect model to derive final odds ratios (ORs) and confidence intervals (CIs)16.
To test whether the variants chosen as instruments were valid under MR assumptions, we examined the instruments for pleiotropy (multiple traits influenced by one gene) between the exposure and disease risk. This would be revealed as deviation from a linear relationship between SNPs and their effect size for 25(OH)D levels and glioma risk. We performed MR-Egger regression to test the average pleiotropic effect caused by the vari-ants combined, as well as to provide a third association estimate between 25(OH)D level and glioma17. As per
Dimitrakopoulou et al.18, we further evaluated the presence of horizontal pleiotropy by conducting stratified MR
analyses using only the genetic variants influencing vitamin D synthesis (rs12785878, rs10741657) and vitamin D metabolism (rs2282679, rs6013897). rs12785878 has been associated with non-European status10 and we
there-fore also undertook a sensitivity analysis excluding rs12785878.
For each statistical test, we considered a global significance level of P < 0.05 as being satisfactory to derive conclusions. To assess the robustness of our conclusions, we imposed a conservative Bonferroni-corrected signif-icance threshold of 0.017 (i.e. 0.05/3 tumour classifications).
DHCR7 Cholecalciferol Cholesterol 7-Dehydrocholesterol 25-hydroxylase 25(OH)D 1 -hydroxylase 1,25-dihydroxyvitamin D3 Inactivation of vitamin D
Cellular actions of vitamin D
KIDNEYS LIVER SUNLIGHT CYP2R1 GC CYP24A1
Figure 1. Effect of SNPs chosen as IVs on the vitamin D pathway. Genes that contain, or are in proximity to,
variants chosen as IVs are highlighted green. P values for the association of these variants with 25(OH)D levels were 1.9 × 10−109 for GC, 2.1 × 10⁻²⁷ for DHCR7, 3.3 × 10⁻²⁰ for CYP2R1, and 6.0 × 10⁻¹⁰ for CYP24A1.
SNP ID Chr Locus Base pair position EA glioma NEA glioma EA 25(OH)D NEA 25(OH)D Effect on 25(OH)D SE F-statistic
rs2282679 4 GC 72608383 G T G T −0.047 0.013 13.38
rs10741657 11 Near CYP2R1 14914878 G A G A −0.052 0.012 18.78 rs12785878 11 Near DHCR7 71167449 T G G T −0.056 0.013 18.29 rs6013897 20 CYP24A1 52742479 A T A T −0.027 0.015 3.13
Table 1. Genetic variant instruments for 25(OH)D levels. EA, effect allele; NEA, non-effect allele; SE, standard
error. Positions given using NCBI build 37. EA taken to be the 25(OH)D decreasing allele. Effect taken to be the per allele log OR effect on 25(OH)D.
www.nature.com/scientificreports/
The power of a MR investigation depends greatly on the proportion of variance in the risk factor that is explained by the IV. We therefore estimated study power to assess the strength of the results19. The detectable ORs
at 80% power were 1.26 or 0.79 in the all glioma analysis, 1.34 or 0.75 in the GMB analysis and 1.35 or 0.74 in the non-GBM analysis. All power calculations were completed at a significance level of 0.05 and assumed the variants explained 2% of the total variance of 25(OH)D levels.
Data availability.
Genotype data from the GICC GWAS are available from the database of Genotypesand Phenotypes (dbGaP; accession phs001319.v1.p1). Genotype data from the GliomaScan GWAS can also be accessed through dbGaP (accession phs000652.v1.p1). Data from the other studies are available upon request.
Results
The results of the IVW and MLE methods are summarised in Table 2. Results of the MR-Egger analysis are sum-marised in Table 3. Forest plots of all results from the IVW and MLE methods are shown in Figs 2 and 3. There was no evidence to support an association (i.e. P > 0.05) between circulating 25(OH)D levels and risk of all gli-oma using either the IVW (OR = 1.21, 95% CI = 0.90–1.62, P = 0.201) or MLE (OR = 1.20, 95% CI = 0.98–1.48,
P = 0.083) methods. MR-Egger regression produced an intercept of −0.001 (95% CI = −0.019–0.017, P = 0.893)
and therefore provided no evidence for pleiotropy amongst the genetic variants chosen as IVs (Supplementary Fig. 1). Hence there was no evidence of violation of MR assumptions.
We explored the possibility that a relationship between vitamin D and glioma may be subtype specific, con-sidering GBM and non-GBM separately. We imposed a stronger significance threshold of P = 0.017 (i.e. 0.05/3), to correct for multiple testing. The MLE method identified an inverse relationship between 25(OH)D levels and risk of the GBM subtype, with an OR of 0.62 (95% CI = 0.43–0.89, P = 0.010). The IVW method provided a similar, but non-significant effect size (OR = 0.62, 95% CI = 0.37–1.04, P = 0.070). No evidence for an associa-tion between 25(OH)D levels and the non-GBM subtype was identified using either the IVW or MLE methods. MR-Egger regression provided intercepts of −0.013 (95% CI = −0.039–0.012, P = 0.307) for GBM and −0.005 (95% CI = −0.035–0.026, P = 0.768) for non-GBM, again providing no evidence of pleiotropy.
Stratified MR analyses using separate allelic scores for vitamin D synthesis and metabolism did not indicate the presence of horizontal pleiotropy (Supplementary Tables 3 and 4). To address the potential effects of popula-tion stratificapopula-tion, we undertook a MR sensitivity analysis excluding rs12785878, as this SNP has been associated with non-European status10 (Supplementary Table 5). Excluding rs12785878, the inverse relationship between
25(OH)D levels and risk of the GBM subtype identified by the MLE method remains significant (OR = 0.51, 95% CI = 0.33–0.80, P = 0.003), thereby providing no evidence that this association is a result of population stratification.
Discussion
To our knowledge, this is the first MR study evaluating the effect of vitamin D on glioma risk undertaken. Overall our results do not provide evidence for an effect of vitamin D on risk of all forms of glioma. They do however raise the possibility for a protective role of vitamin D in GBM. While vitamin D and its metabolites have been shown to induce death of glioblastoma cells20–22, only one epidemiological study has investigated the relationship between
pre-diagnostic levels of 25(OH)D and glioma risk23. Researchers found that higher levels of 25(OH)D were
pro-tective against high-grade glioma in men over the age of 56 (OR = 0.59), although the reverse trend was shown in men under the age of 56, albeit at a borderline-significant level23. Excluding the possibility of post hoc data
mining, such paradoxical findings would support distinct aetiologies between the GBM and non-GBM subtypes, as has been suggested previously9.
IVW method MLE method
β SE(β) OR (95% CI) P value β SE(β) OR (95% CI) P value All glioma 0.189 0.148 1.21 (0.90–1.62) 0.201 0.184 0.106 1.20 (0.98–1.48) 0.083 GBM −0.471 0.261 0.62 (0.37–1.04) 0.070 −0.479 0.186 0.62 (0.43–0.89) 0.010 Non-GBM 0.177 0.281 1.19 (0.69–2.07) 0.529 0.177 0.199 1.19 (0.81–1.76) 0.373
Table 2. MR estimates between multi-SNP risk scores of 25(OH)D levels and all glioma, GBM and
non-GBM glioma using the IVW and MLE methods. IVW, inverse-variance weighted; MLE, maximum likelihood estimation; SE, standard error; OR, odds ratio; CI, confidence interval; GBM, glioblastoma.
MR Egger slope MR Egger intercept
Estimate (95% CI) P value Estimate (95% CI) P value All Glioma 0.072 (−0.121–0.264) 0.466 −0.001 (−0.019–0.017) 0.893 GBM −0.097 (−0.272–0.078) 0.279 −0.013 (−0.039–0.012) 0.307 Non-GBM 0.160 (−0.114–0.434) 0.253 −0.005 (−0.035–0.026) 0.768
Table 3. MR-Egger test results for 25(OH)D levels and all glioma, GBM and non-GBM glioma. CI, confidence
Vital to the method of statistical analysis used herein is that none of the MR assumptions are violated. This requires that the variants chosen as IVs are (i) strongly associated with the exposure, (ii) are not associated with any confounding effects between exposure and outcome and (iii) are only associated with the outcome via the exposure. With regard to this study, the instruments chosen were associated with 25(OH)D levels at genome-wide significance levels. The MR-Egger test provided no evidence of horizontal pleiotropy, which we deemed suf-ficient to satisfy the third assumption. Furthermore, none of the four SNPs were in linkage disequilibrium
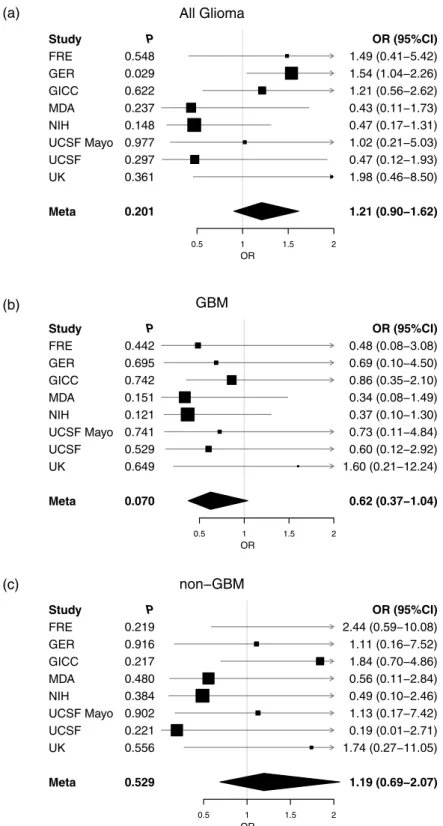
All Glioma Study FRE GER GICC MDA NIH UCSF Mayo UCSF UK Meta P 0.548 0.029 0.622 0.237 0.148 0.977 0.297 0.361 0.201 0.5 1 1.5 2 OR OR (95%CI) 1.49 (0.41−5.42) 1.54 (1.04−2.26) 1.21 (0.56−2.62) 0.43 (0.11−1.73) 0.47 (0.17−1.31) 1.02 (0.21−5.03) 0.47 (0.12−1.93) 1.98 (0.46−8.50) 1.21 (0.90−1.62) (a) GBM Study FRE GER GICC MDA NIH UCSF Mayo UCSF UK Meta P 0.442 0.695 0.742 0.151 0.121 0.741 0.529 0.649 0.070 0.5 1 1.5 2 OR OR (95%CI) 0.48 (0.08−3.08) 0.69 (0.10−4.50) 0.86 (0.35−2.10) 0.34 (0.08−1.49) 0.37 (0.10−1.30) 0.73 (0.11−4.84) 0.60 (0.12−2.92) 1.60 (0.21−12.24) 0.62 (0.37−1.04) non−GBM Study FRE GER GICC MDA NIH UCSF Mayo UCSF UK Meta P 0.219 0.916 0.217 0.480 0.384 0.902 0.221 0.556 0.529 0.5 1 1.5 2 OR OR (95%CI) 2.44 (0.59−10.08) 1.11 (0.16−7.52) 1.84 (0.70−4.86) 0.56 (0.11−2.84) 0.49 (0.10−2.46) 1.13 (0.17−7.42) 0.19 (0.01−2.71) 1.74 (0.27−11.05) 1.19 (0.69−2.07) (b) (c)
Figure 2. Individual cohort and meta-analysis ORs calculated using the IVW method. (a) All glioma, (b)
GBM and (c) non-GBM glioma. Boxes are OR point estimates with area proportional to the weight of the study. Diamonds are overall summary estimates, with 95% CIs given by the width. Vertical line is null value (OR = 1.0).
www.nature.com/scientificreports/
(i.e. r2 ≥ 0.001) with any of the variants identified by Melin et al.9 as being in the risk region for glioma. With
regard to confounding factors, few risk factors are known for glioma, so it was not possible to entirely rule out the possibility of unknown confounding factors causing statistical bias. However it should also be noted that all four SNPs lie either within or near genetic loci whose function in vitamin D physiology is well understood7, although
a lack of knowledge of possible confounding factors means it was not possible to entirely rule out the possibility of confounding by unknown factors.
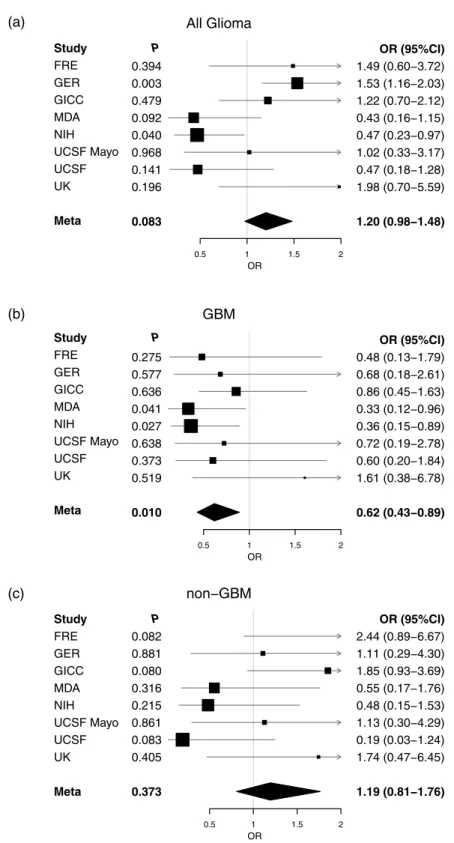
All Glioma 0.394 0.003 0.479 0.092 0.040 0.968 0.141 0.196 0.083 0.5 1 1.5 2 OR OR (95%CI) 1.49 (0.60−3.72) 1.53 (1.16−2.03) 1.22 (0.70−2.12) 0.43 (0.16−1.15) 0.47 (0.23−0.97) 1.02 (0.33−3.17) 0.47 (0.18−1.28) 1.98 (0.70−5.59) 1.20 (0.98−1.48) GBM 0.275 0.577 0.636 0.041 0.027 0.638 0.373 0.519 0.010 0.5 1 1.5 2 OR OR (95%CI) 0.48 (0.13−1.79) 0.68 (0.18−2.61) 0.86 (0.45−1.63) 0.33 (0.12−0.96) 0.36 (0.15−0.89) 0.72 (0.19−2.78) 0.60 (0.20−1.84) 1.61 (0.38−6.78) 0.62 (0.43−0.89) non−GBM 0.082 0.881 0.080 0.316 0.215 0.861 0.083 0.405 0.373 0.5 1 1.5 2 OR OR (95%CI) 2.44 (0.89−6.67) 1.11 (0.29−4.30) 1.85 (0.93−3.69) 0.55 (0.17−1.76) 0.48 (0.15−1.53) 1.13 (0.30−4.29) 0.19 (0.03−1.24) 1.74 (0.47−6.45) 1.19 (0.81−1.76) Study FRE GER GICC MDA NIH UCSF Mayo UCSF UK Meta P (a) Study FRE GER GICC MDA NIH UCSF Mayo UCSF UK Meta P Study FRE GER GICC MDA NIH UCSF Mayo UCSF UK Meta P (b) (c)
Figure 3. Individual cohort and meta-analysis ORs calculated using the MLE method. (a) All glioma, (b)
GBM and (c) non-GBM glioma. Boxes are OR point estimates with area proportional to the weight of the study. Diamonds are overall summary estimates, with 95% CIs given by the width. Vertical line is null value (OR = 1.0).
We acknowledge that a weakness of our study was in the small percentage of variability (around 2%) in 25(OH)D levels explained by the IV. Such a low value means any interpretation of these results as true indicators of the effect of total 25(OH)D levels on glioma risk are limited. This is quantified by the high ORs required for suf-ficient study power. Furthermore the study only accounts for circulating 25(OH)D levels and not for the action of 25(OH)D at the cellular level11. The genetic variants used as IVs in this MR analysis associate with 25(OH)D
lev-els, rather than levels of the biologically active 1,25-dihydroxyvitamin D (1,25(OH)2D) and we therefore cannot explicitly comment on the relationship between 1,25(OH)2D and glioma. The low OR found in the GBM analysis should be noted however, given the fairly consistent indications of protective effects of 25(OH)D across all three methods. As is generally the case with MR, any findings should be viewed as a compliment to other future epi-demiological studies, which test more robustly for associations between vitamin D and glioma and its subtypes.
In conclusion our MR analysis provides no evidence for an association between vitamin D and glioma, though findings raise the possibility of a potential association between vitamin D and GBM warranting further investigation.
References
1. Dolecek, T. A., Propp, J. M., Stroup, N. E. & Kruchko, C. CBTRUS statistical report: primary brain and central nervous system tumors diagnosed in the United States in 2005-2009. Neuro Oncol 14(Suppl 5), v1–49 (2012).
2. Ostrom, Q. T. et al. The epidemiology of glioma in adults: a “state of the science” review. Neuro Oncol 16, 896–913 (2014). 3. Wang, S. Epidemiology of vitamin D in health and disease. Nutr Res Rev 22, 188–203 (2009).
4. Feldman, D., Krishnan, A. V., Swami, S., Giovannucci, E. & Feldman, B. J. The role of vitamin D in reducing cancer risk and progression. Nat Rev Cancer 14, 342–57 (2014).
5. Toner, C. D., Davis, C. D. & Milner, J. A. The vitamin D and cancer conundrum: aiming at a moving target. J Am Diet Assoc 110, 1492–500 (2010).
6. Sheehan, N. A., Didelez, V., Burton, P. R. & Tobin, M. D. Mendelian randomisation and causal inference in observational epidemiology. PLoS Med 5, e177 (2008).
7. Wang, T. J. et al. Common genetic determinants of vitamin D insufficiency: a genome-wide association study. Lancet 376, 180–8 (2010).
8. Langsetmo, L. et al. Calcium and vitamin D intake and mortality: results from the Canadian Multicentre Osteoporosis Study (CaMos). J Clin Endocrinol Metab 98, 3010–8 (2013).
9. Melin, B. S. et al. Genome-wide association study of glioma subtypes identifies specific differences in genetic susceptibility to glioblastoma and non-glioblastoma tumors. Nat Genet 49, 789–794 (2017).
10. Mokry, L. E. et al. Vitamin D and Risk of Multiple Sclerosis: A Mendelian Randomization Study. PLoS Med 12, e1001866 (2015). 11. Manousaki, D. et al. Vitamin D levels and susceptibility to asthma, elevated immunoglobulin E levels, and atopic dermatitis: A
Mendelian randomization study. PLoS Med 14, e1002294 (2017).
12. Pierce, B. L., Ahsan, H. & Vanderweele, T. J. Power and instrument strength requirements for Mendelian randomization studies using multiple genetic variants. Int J Epidemiol 40, 740–52 (2011).
13. Louis, D. N. et al. The2016 World Health Organization Classification of Tumors of the Central Nervous System: a summary. Acta
Neuropathol 131, 803–20 (2016).
14. Burgess, S. et al. Using published data in Mendelian randomization: a blueprint for efficient identification of causal risk factors. Eur
J Epidemiol 30, 543–52 (2015).
15. Burgess, S. & Thompson, S. G. Multivariable Mendelian randomization: the use of pleiotropic genetic variants to estimate causal effects. Am J Epidemiol 181, 251–60 (2015).
16. de Bakker, P. I. et al. Practical aspects of imputation-driven meta-analysis of genome-wide association studies. Hum Mol Genet 17, R122–8 (2008).
17. Bowden, J., Davey Smith, G. & Burgess, S. Mendelian randomization with invalid instruments: effect estimation and bias detection through Egger regression. Int J Epidemiol 44, 512–25 (2015).
18. Dimitrakopoulou, V. I. et al. Circulating vitamin D concentration and risk of seven cancers: Mendelian randomisation study. BMJ
359, j4761 (2017).
19. Brion, M. J., Shakhbazov, K. & Visscher, P. M. Calculating statistical power in Mendelian randomization studies. Int J Epidemiol 42, 1497–501 (2013).
20. Magrassi, L., Butti, G., Pezzotta, S., Infuso, L. & Milanesi, G. Effects of vitamin D and retinoic acid on human glioblastoma cell lines.
Acta Neurochir (Wien) 133, 184–90 (1995).
21. Magrassi, L. et al. Vitamin D metabolites activate the sphingomyelin pathway and induce death of glioblastoma cells. Acta Neurochir (Wien) 140, 707–13; discussion 713–4 (1998).
22. Garcion, E., Wion-Barbot, N., Montero-Menei, C. N., Berger, F. & Wion, D. New clues about vitamin D functions in the nervous system. Trends Endocrinol Metab 13, 100–5 (2002).
23. Zigmont, V. et al. Association Between Prediagnostic Serum 25-Hydroxyvitamin D Concentration and Glioma. Nutr Cancer 67, 1120–30 (2015).
Acknowledgements
HT was supported by a Wellcome Trust Summer Student bursary. AS is supported by a Cancer Research UK clinical Fellowship. In the UK, funding was provided by Cancer Research UK (C1298/A8362) supported by the Bobby Moore Fund. The GICC was supported by grants from the National Institutes of Health, Bethesda, Maryland (R01CA139020, R01CA52689, P50097257, P30CA125123). The UK Interphone Study was supported by the European Commission Fifth Framework Program “Quality of Life and Management of Living Resources” and the UK Mobile Telecommunications and Health Programme. The Mobile Manufacturers Forum and the GSM Association provided funding for the study through the scientifically independent International Union against Cancer (UICC).
Author Contributions
R.S.H. and A.J.C. managed the project. H.T., A.J.C., A.S., P.J.L. and R.S.H. drafted the manuscript. H.T. and A.J.C. performed statistical analyses. B.K., K.L., M.J.S. and R.H.S. provided U.K. data. M. Simon, P.H., M.M.N. and K.-H.J. provided German data. Q.T.O., J.E.E.-P., G.N.A., E.B.C., D.I., J.S., J.S.B.-S., S.H.O., J.L.B., R.K.L., C.J., R.B.J., B.S.M., M.R.W., M.L.B. and R.S.H. provided GICC data. S.C. and P.R. provided National Cancer Institute (NCI) data. M. Sanson provided French data. All authors reviewed the final manuscript.
www.nature.com/scientificreports/
Additional Information
Supplementary information accompanies this paper at https://doi.org/10.1038/s41598-018-20844-w.
Competing Interests: The authors declare that they have no competing interests.
Publisher's note: Springer Nature remains neutral with regard to jurisdictional claims in published maps and
institutional affiliations.
Open Access This article is licensed under a Creative Commons Attribution 4.0 International
License, which permits use, sharing, adaptation, distribution and reproduction in any medium or format, as long as you give appropriate credit to the original author(s) and the source, provide a link to the Cre-ative Commons license, and indicate if changes were made. The images or other third party material in this article are included in the article’s Creative Commons license, unless indicated otherwise in a credit line to the material. If material is not included in the article’s Creative Commons license and your intended use is not per-mitted by statutory regulation or exceeds the perper-mitted use, you will need to obtain permission directly from the copyright holder. To view a copy of this license, visit http://creativecommons.org/licenses/by/4.0/.