Publisher’s version / Version de l'éditeur:
Technical Note (National Research Council of Canada. Division of Building Research), 1967-09-01
READ THESE TERMS AND CONDITIONS CAREFULLY BEFORE USING THIS WEBSITE. https://nrc-publications.canada.ca/eng/copyright
Vous avez des questions? Nous pouvons vous aider. Pour communiquer directement avec un auteur, consultez la
première page de la revue dans laquelle son article a été publié afin de trouver ses coordonnées. Si vous n’arrivez pas à les repérer, communiquez avec nous à [email protected].
Questions? Contact the NRC Publications Archive team at
[email protected]. If you wish to email the authors directly, please see the first page of the publication for their contact information.
NRC Publications Archive
Archives des publications du CNRC
For the publisher’s version, please access the DOI link below./ Pour consulter la version de l’éditeur, utilisez le lien DOI ci-dessous.
https://doi.org/10.4224/20338577
Access and use of this website and the material on it are subject to the Terms and Conditions set forth at
Settlement Study at Ste. Hilaire, P.Q.
Jarrett, P. M.
https://publications-cnrc.canada.ca/fra/droits
L’accès à ce site Web et l’utilisation de son contenu sont assujettis aux conditions présentées dans le site LISEZ CES CONDITIONS ATTENTIVEMENT AVANT D’UTILISER CE SITE WEB.
NRC Publications Record / Notice d'Archives des publications de CNRC: https://nrc-publications.canada.ca/eng/view/object/?id=13087a8b-1a37-4de4-a090-4d84fa057349 https://publications-cnrc.canada.ca/fra/voir/objet/?id=13087a8b-1a37-4de4-a090-4d84fa057349
DIVISION OF BUILDING RESEARCH
NATIONAL RESEARCH COUNCIL OF CANADA
'If
JEClHIN J[CAIL
NOTE
No.
498
PREPARED BY P.M. Jarrett CHECKED BY C. B. C. APPROVED BY R. F. L.
セ September 1967
PREPARED FOR
SUBJECT
Inquiry and Record Purposes
SETTLEMENT STUDY AT STE. HILAIRE. P.Q.
Early in 1966 the Division of Building Research was consulted about damage to a building owned by Newfield Products Ltd. at Ste. Hilair e. P.Q. It was subsequently found that lar ge differ ential movements were occurring. One area of the building has a pile foundation supported on a sand layer about 70 ft below ground level; the remainder rests on a sand mat
built over a 65-ft layer of soft compressible Leda clay, Settlements in the building will probably continue for many years and should result in a valuable case history.
THE B.UILDING
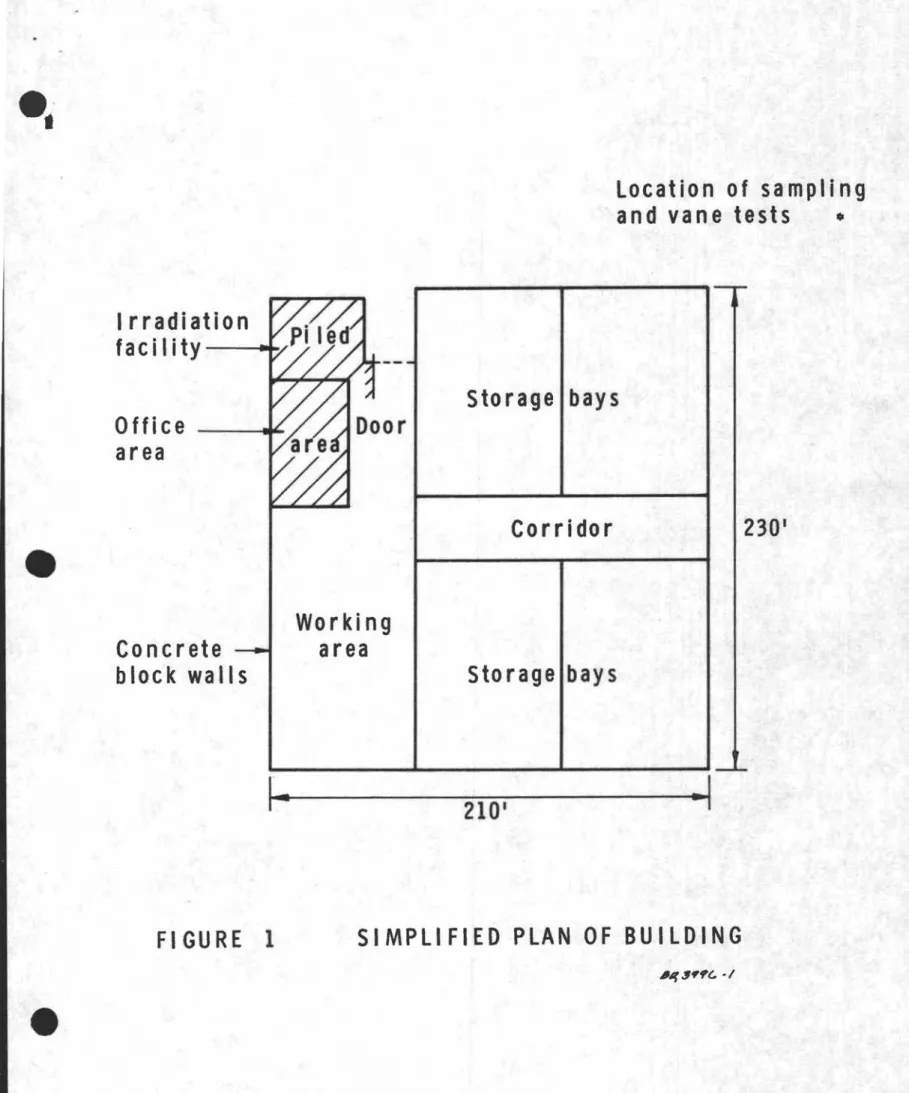
The building was designed as a war ehous e with facilities for the storage and treatment of fresh
vegetables by "gamma radiationI. as a means of
preservation. The irradiation facility and office area are founded on piles (Figure 1) driven to the sand bed shown in the soil profile (Figure 2). The floors of the storage bays and working ar ea ar e founded on a 5 -ft-thick sand fill layer placed above original ground level. The walls ar e of COncr ete blocks founded on strip footings at the base of the sand fill. It is this fill that has caused the problems connected with this building.
Ie
I .,.
- 2
-THE SOIL
General information for the soil profile was obtained from the architects' design drawings. Soil parameter s on the 65-ft layer of grey Leda clay were determined by tests at DBR/NRC on a few soil samples obtained at the site using an N. G.1. piston sampler.
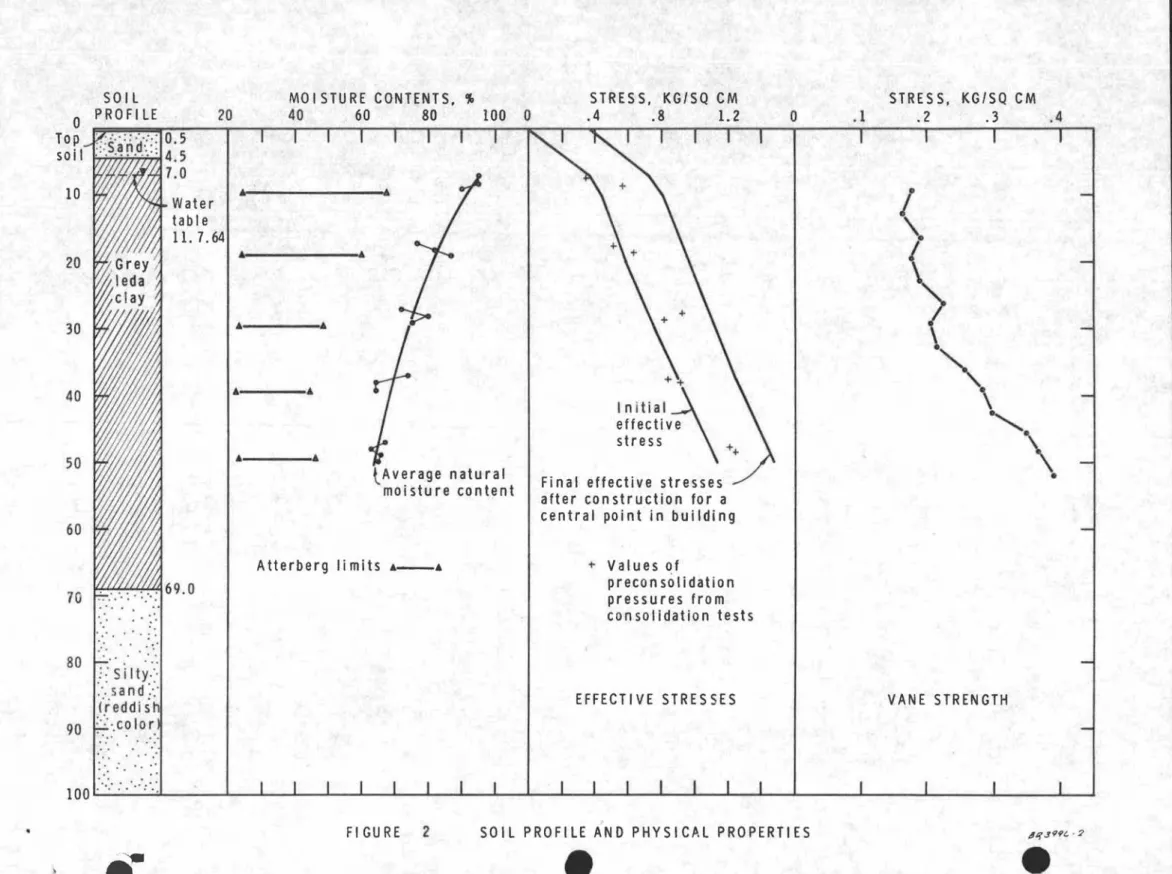
The clay layer appears to be slightly overconsolidated according to the test results shown in Figure 2. The soil is very sensitive, with the natural moisture content about 20 per cent above the liquid limit. After extruding the samples from the tubes photographic and moisture content profiles were made. These showed the material to be banded with clayey and silty bands but the bands were not distinct enough to be regarded as layers, tending rather to merge into each other.
An average grain-size distribution shows about 76 per cent clay-size particles with 24 per cent silt. The salt content in the pore water is low, averaging about 0.4 gm/litre.
STRESS DISTRIBUTION AND BUILDING LOADS The initial vertical str ess in the ground befor e construction was calculated from soil properties measured in the laboratory. Values of natural unit weight for the clay varied from 93 lb/cu it at a depth of 10 ft to 102 lb/cu it
at 50 ft. From these and intermediary values the effective stress distribution in the clay below the water table was calculated assuming the groundwater table was 7 it below ground level, as shown in the architects' drawings, and that the natural unit weight down to the water table was
110 lb/cu ft. The computed effective stresses are shown in Figure 2.
Stresses due to the weight of the building are super-imposed on the initial stresses in Figure 2 and have been assessed as:
1.
Sand fill, 5 ft at 110 lb/cu ft - 550 lb/sq ft 2. Concrete floor - 100 lb/sq ft3. Building load (walls, roof) - 112 lb/sq ft 2 Total Stress Increment - 762 lb/sq ft (0.37 kgm/cm )
- 3
At the interface of the building fill and ground surface, therefore, there is a minilnum stress increment of 0.37 kgm/cm2 • This value does not include the live storage load, which for potatoes was approximately 380 lb/sq ft (0.18 kgm/cm2). Even without the live load, however, it can be seen in Figure 2 that the load increment raises stresses well past the highest preconsolidation pressure measured in laboratory tests. For this section of Figure 2, the stress increment for depths below ground level was calculated for a central point in the building using N ewmar ks charts.
MEASURED SETTLEMENTS
The Division of Building Research was not consulted about this building until it had been in place for almost one year. The considerable initial settlement was ther efor e not observed; it must be estimated in association with a few settlement observations made by others.
Three bench marks, for settlement observations, wer e established on the piled section of the building.
These were Ramset pins fired into the structural concrete. For the internal survey of building settlements, paint spots were placed on the floor at known locations as shown in Figur e 3. Owing to heavy traffic in the building, some of these spots were worn away but survey positioning was
generally possible within 1 or 2 in. Surveys were also made on the external walls by driving Ramset pins into the pilasters and using them as settlement points. Three
settlement gauges (1), were installed under the buildiQ.g '\--to observe in which part of the clay layer settlements
were occurring. These three gauges, located as shown in Figure 3, were placed at the following depths below original ground level:
SI S2 S3
6
ft 18 ft 31 ftSome of the settlement records obtained are presented in Figures 4 and 5. Figure 4 gives east-west and north-south settlement profiles acros s the building.
e"
f
4
-A profile is shown for the initial survey on 27 -April 1966 and for both subsequent surveys on 28 September 1966 and 12 June 1967. Since observations began, the maximum settlement has occurred at point C5 and is approximately 0.21 ft. There are some discontinuities in the profiles. It is believed that these are caused by structural effects within the building. The settlement could generally be described as dish-shaped over the whole ar ea.
A few settlement readings had been taken before regular surveys were initiated by DBR. One such reading was made at a position near B 1 0 and this settlement has been added to that mea sur ed by DBR to construct the time-settlement curve shown in Figure 5. The resultant settlement totals more than 1 ft and has occurred over an approximate 2-year period. Examination of the settlement gauge surveys (also plotted in Figure 5) shows that about 60 per cent of the total settlement recorded since the gauges were installed has occurred in the clay layers between gauges SI and S2,
i. e., from 6 to 18 ft below original ground level. This would indicate that consolidation settlement is at an early stage and that much more can be expected as the deeper clay layers are affected. Excess pore-water pressures may indeed still exist beneath the building and could be measured to obtain some indication of the progress of consolidation.
Considering the stress distribution shown in Figure 2, settlement calculations ba's ed on the limited consolidation tests available indicate a total ultimate settlement of several feet. A major uncertainty in these calculations is the level of the water table. Variation between the surface and the 7 -ft depth assumed could cause vital differences in the initial effective stress calculations and in the degree of overconsolidation. If the water table is higher than 7 ft below gr ound level, the estimate of total settlement would be less.
CONCLUSIONS
1. Since the end of construction the building has settled more than 1 ft in its central area.
2. Settlements are due primarily to the load of the sand fill supporting the floor slab.
-- 5
-3. Even without any live load, settlements can be e:xpected to continue for a number of years.
4. Ultimate settlements will create difficult operating conditions because of the differential movements between the piled ar ea and the sand fill ar ea.
5. The installation of piezometer s outside the building would provide a good indication of the ground water levels and, as such, is highly desirable.
6.
Additional piezometer installations within the building area close to the settlement gauges could provide insight to the progress of the consolidation process.ACKNOWLEDGEMENTS
The author wishes to thank the owners of the building, who invited this investigation and allowed it to proceed.
Initially the building was operated by Newfield Products Ltd. More recently the town of Ste. Hilaire has undertaken
ownership.
Further thanks are extended to Mr. J. B. Bordeleau who carried out the laboratory testing of the soil samples and to the other members of the staff of the Soil Mechanics
Section of DBR who "assisted in the surveys of the building and the other necessary field work.
REFERENCES
(l) Bozozuk, M. The spiral foot vertical ground movement gauge. National Research Council, Division of Building Research, TN 274. April 1959.
Location of sampling
and vane tests
•
Irradiation
fa ciii ty
MセセOOffice -
_
area
Concrete
block walls
r..
storage bays
Corridor
Working
area
storage bays
210'
-I
230'
4 • .4
(
\
\
."
'\
"'-.
\\
•
STRES S, KG/SQ CM .2 .3 .1o
+ Values of preconsolidation pressures from consolidation tests STRESS, KG/SQ CM .4 .8 1.2iョゥエゥ。ャK|セ
effective stress + +Final effective stresses after construction for a central point in building
Atter berg lim its
4-.
MO I STU RE CONTENTS, ." 40 60 80 100 0 tAVerage natural moisture content 4 4 4 4 10 • 20 Water table 11. 7.64 .' SO Il PROFILE
セ
BBBBGos::':S'a'ri'd':;: .
... セZセ 20 60 70 40 30 10so
o
Top soi I..
,..
80 . ,:: SiIty-:' :, sand>.
(reddish 90 セLN」ッャッイ ",...
"EFFECTIVE STRESSES VANE STRENGTH
'0 • • • ,.
100 ,:":' :, ',::,'
fl'
FIGURE 2 SOil PROFILE AND PHYSICAL PROPERTIES