XV. COMMUNICATIONS BIOPHYSICS
Prof. W. A. Rosenblith Dr. N. Y-S. Kiang J. D. Cowantftt Prof. M. H. Goldstein, Jr."i Dr. J. W. Kuipertft A. H. Crist
Prof. W. T. Peake Dr. N. M. Onestoff$ Margaret Z. Freeman Dr. J. S. Barlow$ Dr. T. T. SandellS C. D. Geisler
Dr. Eda Berger** W. A. Clark, Jr.
$
J. L. Hall II Dr. M. A. B. BrazierS Aurice V. Albert P. Latourjj4SDr. Murray Eden't J. Allen*** C. E. Molnar
Dr. B. G. Farley$t J. E. Brown D. F. O'Brien Dr. G. L. Gerstein*** R. M. Brown Jane A. Pike
Dr. F. B. Goffin*** T. F. Weiss
A. ELECTRICAL RESPONSES TO ACOUSTIC CLICKS RECORDED FROM
HUMAN SCALP
In a previous report (1), a description was given of responses recorded from human scalp in response to click stimulation. These responses, only a few microvolts in ampli-tude, were not detectable by visual examination of the electroencephalographic (EEG)
records, and hence were studied by means of an average response computer (ERD). The present study concerns the further investigation of the "early" component of these responses, a study that has been greatly facilitated by the use of the ARC-1 computer (2) and the TX-0 computer.
Figure XV-1 shows the average responses to clicks recorded from various points of the scalp of the subject W. P. The electrode array was on the right side of the head, and
each point was located about 5 cm from its nearest neighbors. The reference electrode was located on the nose. As can be seen, the largest responses are located in the occi-pital region, and only very small responses are recorded from the temporal region.
This work was supported in part by the U.S. Air Force under Contract AF19(604)-4112.
tOn leave of absence at the Istituto di Fisiologia, University of Pisa, Pisa, Italy.
tResearch Associate in Communication Sciences from the Neurophysiological Laboratory of the Neurology
Service of the Massachusetts General Hospital.
Postdoctoral Fellow of the National Institute of Mental Health.
ttResearch Associate in Communication Sciences on leave from the National Heart Institute. "Staff Member, Lincoln Laboratory, M. I. T.
Postdoctoral Fellow of the National Institute of Neurological Diseases and Blindness. T"Sloan Postdoctoral Fellow of the School for Advanced Study, M. I. T.
MResearch Associate in Communication Sciences and Fellow in the School for Advanced Study, M. I. T. Ramo-Wooldridge Fellow in Systems Engineering.
ttGraduate Fellow of British Tabulating Machine Company, Ltd.
"On leave from Instituut voor Zintuigfysiologie RVO-TNO, Soesterberg, Netherlands.
(XV. COMMUNICATIONS BIOPHYSICS) VERTEX 30 msec 7 6 4
/
5cm INIONFig. XV-1. Distribution of responses on the scalp (subject W.P.). Recording electrodes were approximately 5 cm apart. Each trace is the average of 2000 responses. In this and the following figures, neg-ativity with respect to the reference electrode is plotted upwards. Reference electrode was placed on the nose. Clicks were pre-sented periodically at the rate cf 14/sec; the intensity was -30 db re 2. 2 volts delivered to the earphones.
These particular responses were evoked by clicks to the left ear, but a similar pattern is evoked by presentation of the clicks to the right ear. This spatial distribution, con-sistent in most of our subjects, suggests that we are not recording the responses of the auditory projection areas of the cortex which lie within the more temporally located Sylvian fissure. The rather long latency of the responses (30 msec to the first, surface-negative peak) also supports this conclusion. [Most of the succeeding records, average
responses, were computed from the potentials recorded between two scalp electrodes, one located occipitally and the other temporally.]
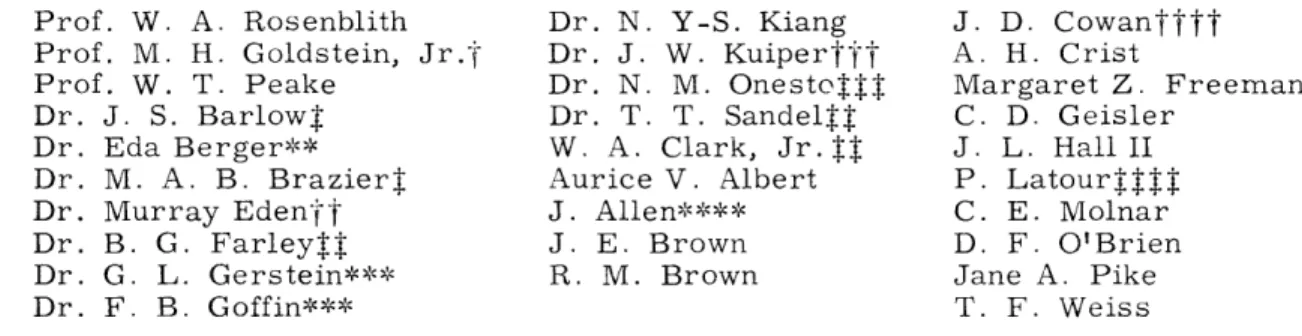
This type of response has been seen in almost all of our subjects, approximately 30 in number. Figure XV-2 gives an indication of the range of responses recorded from different individuals. The five subjects used were picked at random from our labora-tory personnel, and the records give an indication of the inter-subject variability of responses. The amplitudes and waveforms are different, but the latencies are quite consistent. Notice that each response, regardless of its other characteristics, has a peak at 30 msec. In addition, subject R. C.'s response has a later component, some-times seen in other subjects, and subject G.G.'s response has earlier components,
(XV.
COMMUNICATIONS BIOPHYSICS)
G G. R. C.
ME.
30 msec
Fig. XV-2.
Average responses from 5 different subjects.
Clicks were delivered
at either 14/sec or 15/sec at an intensity of -45 db; 4000 responses
were averaged from subject M.E.,
and 8000 for the others.
Poten-tials were recorded between electrode no. 6 and a reference electrode
which was either electrode no. 4 (O.G., R.C., W.P.) or an electrode
on the nose (M.E., G.G.).
See Fig. XV-1 for electrode locations.
which are presently under investigation.
But in each case, a surface-negative deflection
is found at approximately 30 msec.
This response has been found to vary with the intensity of the stimuli, and an
inves-tigation of the effect of this stimulus parameter has been made.
In order to compensate
for possible changes in the "state" over the course of an experiment, the stimuli were
randomized in the following way. Trains of clicks were presented to the subject.
Each
train contained 50 clicks, all of the same intensity, which were presented at a rate of
15/sec.
The intensity of any particular train was selected randomly from 10 stimulus
levels under the two constraints that each intensity be presented 20 times and that every
possible transition between intensity levels should occur only twice.
A time interval of
5 seconds separated the trains.
A total of 200 trains was presented, giving a total of
1000 stimuli at each intensity.
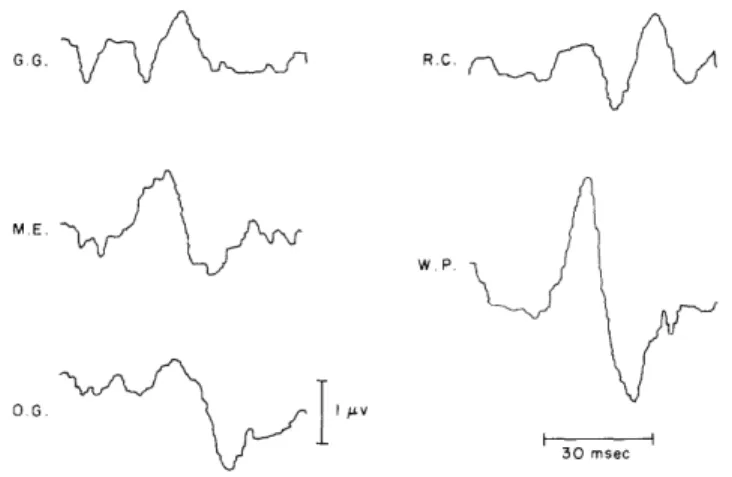
Figure XV-3 shows the average responses recorded from subject W. P. for the
dif-ferent intensities.
For the loudest clicks, a clear average response is seen; for the
softest clicks, the amplitude of the response is much less. In order to quantify the data,
the peak-to-peak amplitude of the responses was measured as shown in the upper
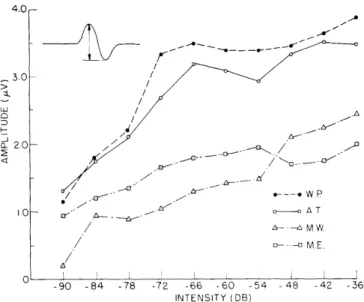
left-hand corner of Fig. XV-4. In this figure the measured amplitude during four separate
experiments, run on four different days, is plotted. The subject's psychophysical
threshold for these clicks, which lies at approximately -88 db, is a significant landmark.
For approximately the first 30 db above threshold, the amplitude grows with intensity.
For more intense stimuli, the response amplitude is little changed. It is of interest to
note that this response pattern, together with the slight increase in the latency of the
PEAK -36 STIM S-42 I-. Z -48 -54 -60 - 66 -52 -78 4t 4V -84 30ms -90 fNI\
Fig. XV-3.
Intensity series
(subject W.P., H-565).
Click
presentation randomized with respect tointen-sity (see text): Approximately 1000 responses averaged at each intensity. Electrodes no. 7 and no. 4 were used.
4.0 30 -1.0 --- *H-563(N-500)F -- 5-9 -- H-565 --- H-5776 / i, NOISE LEVEL -90 84 78 72 -66 60 54 -48 -42 -36 INTENSITY (DB)
Fig. XV-4. Amplitude measurements for intensity series (subject W.P.). Each point represents approximately 1000 responses. Reference electrode was no. 4, the active one was either no. 7 (H-563, H-565) or no. 6 (H-566, H-577). Stimulus pattern was that used for experiments sum-marized in Fig. XV-3. The noise level shown is a measure of the effect of the background activity. It is an approximate amplitude measurement of "spurious" deflections (such as the peak at 5 msec for -48 db in Fig. XV-3) not consistently seen in the average responses.
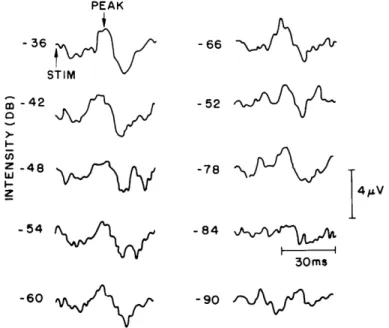
4.0 3.0 wiJ -J -.. P ,1 Ic '' P -- 1- a - d W 10 A--T / - MW. / - -. ME / -90 -84 -78 -72 -66 -60 -54 -48 -42 -36 INTENSITY (DB)
Fig. XV-5. Composite measurements of intensity series for different subjects. Each point represents at least 3500 responses. Stimulus pattern was that used for experiments summarized in Fig. XV-3. An
occip-ital electrode (either no. 6 or no. 7) and electrode no. 4 were used.
RATE (CLICKS PER SECOND)
0.5 50 msec 1.02 V A 2.5 x 5.0 N 2000 10.0 20.0 40.0 N 500
Fig. XV-6. Rate series (subject W.P.). Repetitive stimuli presented at -30 db. Recording electrodes shown.
(XV. COMMUNICATIONS BIOPHYSICS) S0-0
-G
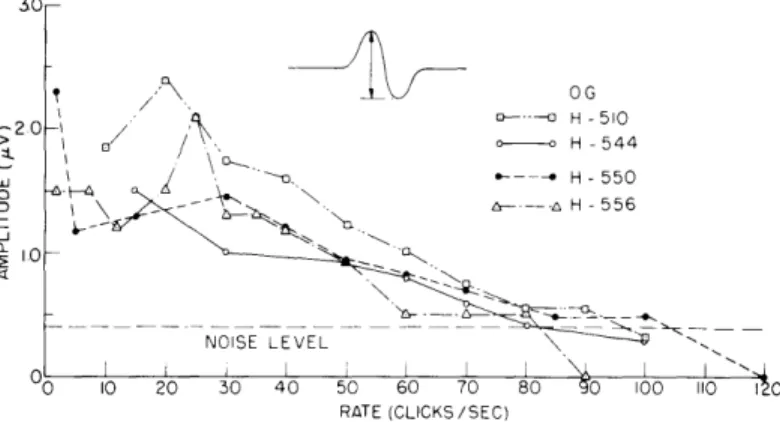
20- H -510 / 0- H -544 S-. H-550 \ - -- aH 556 IO -- "" -NOISE LEVEL 0 10 20 30 40 50 60 70 80 0 100 110 1 0 RATE (CLICKS/SEC)Fig. XV-7. Amplitude measurements for rate series (subject O.G.). Each point represents 1000 responses, except at low rates where only 500 were averaged. An occipital elec-trode (no. 7 for subject H-544 and no. 6 for the others) and electrode no. 4 were used.
response to soft clicks, has been observed for cortical responses in the anesthetized cat (3). The cat's responses have peak latencies of approximately 15 msec and are not directly comparable with those recorded from human scalp. Nevertheless, the simi-larity in behavior of these two different types of responses is significant.
In order to compress these data to a single curve, the amplitude for each intensity was averaged over the four experiments and plotted. This summary curve, along with similar curves obtained from three other subjects, is plotted in Fig. XV-5. For three of the four subjects, growth with intensity is limited to the first 30 db above psychophys-ical threshold.
Figure XV-6 shows the average responses recorded from subject W. P. for various rates of click presentation. Responses are seen for all rates of stimulation, and the response amplitude is little diminished for rates as high as 40/sec. Since only 500 responses were averaged in each case, the effect of the background activity (i.e., activity unrelated, on the average, to the clicks) is still plainly seen in the "spurious" deflections. When more responses are averaged, as for the rate of 10/sec, the effect
of the background activity is further reduced, and the waveshape becomes much smoother.
Amplitude measurements have also been made for this type of experiment. When the individual responses are clearly seen, as for 10/sec, the peak-to-peak amplitude was measured. For higher rates, the peak-to-peak amplitude of the periodic waveform was measured. Figure XV-7 shows subject O.G.'s response amplitude for various rates obtained during four separate experiments on four different days. As the rate is increased, response amplitude decreases; responses to 100 clicks per second are just barely detectable. By way of comparison, click responses obtained from the auditory
(XV. COMMUNICATIONS BIOPHYSICS)
cortex of the unanesthetized cat show very similar response patterns (4). Here again, the cat's responses have peak latencies of approximately 15 msec and are not directly comparable with the human responses reported here.
In summary, then, bilateral responses to clicks have been obtained from the scalp of many human subjects. The responses have amplitudes of a few microvolts, and the largest responses are recorded from the occipital regions. The behavior of the response as the rate and intensity of the click stimuli are varied is quite repeatable and is simi-lar to cortical response data obtained from cats. The latency and spatial distribution, however, argue against a site of origin in the auditory projection areas of the cortex.
This is not a dismaying fact, for in addition to the responses obtained from classical auditory areas, "secondary" responses have been recorded from many parts of cat and monkey cortex (5, 6). It is concluded that these responses recorded from human scalp are most probably cortical in nature, but are generated elsewhere than in the Sylvian fissure.
C. D. Geisler
References
1. C. D. Geisler, L. S. Frishkopf, and R. M. Brown, The "early" response to clicks in awake subjects, Quarterly Progress Report, Research Laboratory of Elec-tronics, M.I.T., July 15, 1957, pp. 144-147.
2. Communications Biophysics Group and W. M. Siebert, Processing Neuroelectric Data, Technical Report 351, Research Laboratory of Electronics, M.I.T., July 7, 1959;
see Appendix C.
3. W. A. Rosenblith, Electrical responses from the auditory nervous system, Ann. Otology, Rhinology and Laryngology 63, 839-851 (1954).
4. M. H. Goldstein, Jr., N. Y-S. Kiang, and R. M. Brown, Responses of the audi-tory cortex to repetitive acoustic stimuli, J. Acoust. Soc. Am. 31, 356-364 (1959).
5. P. Buser et P. Borenstein, Reponses corticales "secondaires" a la stimulation sensorielle chez chat curariz6 non anaesthesie, EEG Clin. Neurophysiol. Supp. 6, 89-108
(1957).
6. T. E. Starzl and D. G. Whitlock, Diffuse thalamic projection system in monkey, J. Neurophysiol. 15, 449-468 (1952).
B. REPETITIVE CORTICAL RESPONSES TO ACOUSTIC CLICKS
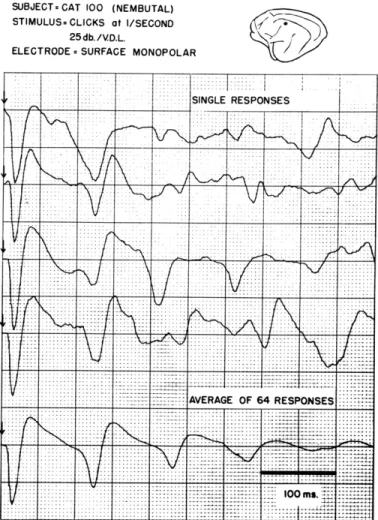
Acoustic click stimuli, presented at a repetition rate of 1/sec or less, frequently elicit cortical responses like those shown on the single traces shown in Fig. XV-8. The average of 64 such responses, shown in the last curve, displays a sequence of surface-positive deflections that recur at intervals of approximately 100 msec. This response pattern is similar to that observed by Chang (1950) in single responses from more deeply anesthetized cats, in which the cortical background activity has been depressed suffi-ciently to make the detection of the later deflections in each single response easy. We
(XV.
COMMUNICATIONS BIOPHYSICS)
SUBJECT= CAT 100 (NEMBUTAL) STIMULUS= CLICKS at I/SECOND
25db./VD.L
ELECTRODE SURFACE MONOPOLAR
1"*
/
Fig. XV-8.
Single cortical responses and average
of 64 responses to acoustic clicks.
have studied these repetitive after-discharges recorded from the auditory cortex of
lightly anesthetized cats, with the aid of averaging techniques.
Unless otherwise noted, all the data to be discussed were recorded from the pia of
adult cats with gross surface electrodes.
The cats were initially anesthetized with 30
to 50 mg/kg of nembutal (given intraperitoneally) and maintained at as light a depth of
anesthesia as possible by subsequent small doses of dilute (6 mg/cc) nembutal
adminis-tered intravenously.
The right auditory cortex was exposed, and click stimuli were
pre-sented to the left ear by a PDR-10 earphone excited with a 100- lsec voltage pulse.
We shall refer to the first surface positive deflection in the average response, the
peak of which occurs with a latency of approximately 15 msec after the stimulus
presen-tation, as the primary evoked response. The subsequent surface positive deflections in
the average response will be referred to as repetitive responses (1st, 2nd, etc.,
repeti-tive). Click intensities are shown in decibels relative to VDL (visual detection level), the
144
SINGLE RESw
K//KY
... - - --- --- .. . .. - ' ' ' - - - ' '- --- --.... ...~
' -'. .. ...~-~.
... .... ... ... AVERAGE OF 64 RES Q N S E S ... .... ... ... ... . . ... ...~
"~~'...
... I .... ...~i
I-- I \ ;1- I r I-- --- -- ---~
r:: ... :I .. ... .... ... .... .~ ~
' ' ''"''~''~'~'''... .... ..."~ . . ... ... ...-... ... 100"~~'~'~~~' .. . . . . .. . .. .. . . .. .. .. . - t ~::::~(XV.
COMMUNICATIONS BIOPHYSICS)
intensity at which the primary evoked response is just barely detectable by a visual
examination of single responses displayed on an oscilloscope.
Figure XV-9 shows the stability of the averaged repetitive responses, as well as
of the primary response, over a period of nearly two hours. An average response to
100 click stimuli, at a repetition rate of 1/sec, was obtained at 6:05, 6:50, and 7:48 p.m.
from the same preparation. Note that there is a slight decrease in the time interval
between successive repetitive responses during this period. This change is probably
due to a gradual change in the level of anesthesia in the animal. Additional doses of
anesthesia, as little as 3 or 4 mg of nembutal, increase this interval noticeably. As
the interval between successive repetitive responses is increased to 150-175 msec by
larger doses of nembutal, the repetitive response diminishes in amplitude and becomes
barely discernible in the average response.
Interaction of repetitive responses with a primary evoked response has been studied
SUBJECT= CAT 102 (NEMBUTAL)
STIMULUS= CLICKS at I/SECOND
30 db./V D L
ELECTRODE SURFACE MONOPOLAR
AVERAGES OF 100 RESPONSES
<'i;-
TIME (PM) 6=05 6=50 7:48 100 MSFig. XV-9. Stability of averaged repetitive responses to acoustic
clicks as a function of time in the experiment.
145
I i 2 : : .i i i l i i~ : ' i~ i i i l : i i i i i l i i : ' : : .. ....: : : .:1 " ..., ...: .: .. .. i~ ~ ~ ~
.. ... .iii~ i l ...l ... .... . . . ., ' . .. ..' ' .'' . ... . . . .. . . . .. ... ... . . .. . . .. . i,~~~ I . .. . . . .. . .. ... .... ... .. . ..-... . . . .... . ... ... ... . . : ... . . . ... ... .. ..... ..: . ... .... . . . . . .: . . . .. . . . .. . . . . , . . . . . . .. . . . . . . . , . . . . . .. , . . . . .. , . . . . . . . .. . . . . . . . . .. . I . . . . . . . i . . . . . . . I . . . I . . . I . . . . . . I . . . . . . . . . ' , . .. . . , . . .,1.. ,. . . . . .. .. .~~~~~ . . , .~
~~
.~~~~~~~~~~
. . ., , . . . ., . .. . . . , . . . . ., . . . .. ... .. . .. . .. . . . . . . .. . . . i . . . . . . . , . . . , . . . , . . . . . , . . . . . . . . . . . . . . .. . . . , . . . . . . , . . . . , . . . . .. , . . . . , . . . , . . . . .., .... ..., . i~ i : : ... .. .. ... ... .: : .: .., ... ... ..:
::
:
:
:!
]
i~
i~
! ?i
ii
ii
i
ii
]
ii
i:
r
SUBJECT= CAT WM-I0I (NEMBUTAL) STIMULUS= PAIRED CLICKS
I PAIR/SECOND BOTH 20db./VDL ELECTRODE SURFACE MONOPOLAR
AVERAGES OF 100 RESPONSES */'
>1*
SEPARATION . ..... _::..
. ...
.
....
.
.
.
..
..
...
.
. ....
..
..
.
.
.
.
.
.
.
.
. .
..
.
..
.
.
.
..
.
..
.
.
.
.
.
.
..
.
.
..
.
.
~
~
~
' '
.
.
.
.
.
.
.
.
.
.
.
.
.
.
.
.
.
.-
-
-
-
-
-.
..
..
..
...
.
..
.
.
.
.
..
..
.
.
..
.
.
.
..
.
.
.
.
.
: : : I : : :. : 1
:I
: : ::
:...
'
..:::
.
.
.
.
..
.
..
.
.
.
.
.
.
.
..
.
.
.
~
~
~~
~
.
.
.
.
.
.
...
.
.
.
.
.
..
: : : : I : : : I : : : :
.
.
.
.
..
.
.
.
.
.
:.
..
.
.
..
..
..
.
.
.
.
.
.
..
.
- --
.
.
.
.
.
..-
-.
.
..
.
.
.
.
.
.
.
..
..
~
.
..
.
.
.
.
.
.
. .
.
.
.
.
.
.
.
.
.
..
.
.
.
::::I::~:
'''' ''~
...
...
...
..
....
...
' '' ' ' '
...
''..
.
.
.
.
.
..
.
.
..
~'''''' ~
''' '''~ ' ' ~ '
'' ' '
...
...
...
...
...
.~
..
'
..
'
4
-1
...
"
"
~'~- ~ ~ ''~.
....
....
. ...
...
..~~~~
..
..
...
....
..
...
.
' '' ' ~
'' "
~~
' ~ ~ ''~~~~~~'
. ..
'~
....
..
..
...
...
..
.
...
....
..
" " " " "~
" " " "~
..
...
...
...
."'~
~~'
' ~ ' ' ' ~'
' ' '
' ' ' ' ' ' ~
' ~ ~'~
.
..
...
~'
'
.
...
.~
' ' ' ~
' ' '~ ' ' '
....
..
~~~~'~ " ' " '' " "
...
.
' ' ~ ' ' ' ' ' ' ' ' ' ~
'.
' ' ' ' ' ' ~
...
~
~ ~ ~
...~"
~
---
' ' '
---i ---i
i...
...
i
...
...
...
...
~''''''' "' ' '- ' ~I~ ''''''' ~ ~ '~
....
...'-
~'~
'~~
" " ~ " ~
" " ' " ~
~ "
"--
---
---
:
.
...
...
....
.'
' '~~
~' ' ' '' ~
~ '''
'' ' ''~'
~
~~~~~'
~ ~
...
...
~ "'
'
'~'~
'
' ~ ~
~ ' ~ ~ '~'''
...
''
'''...
'
''' '~' '
..
...
..
...
..
....
""''~~~"'
...
--
.
--
..
.
..
-~
'' ~ '
" '~' '' ~~
'' ~'' ~' '' ~'
...
'
...
' ~' '~ ''
...
''^".
"
....
.
...
...
....'
.
...
..
..
..
'~
~ ~' ' ' ' ' ~ ' ' ~' '' ' '~ ~~'
..
...
...
..
~~~~"~'"'
..
"'~' ~ ~
...
' '' ''
~' ~'' ~~ ~~
..
...
.
I
'...
.
...
'' '' '~
...
..
....
' '~'
..
...
'
..
.
' ~
'...
' ' ' ~' '~ ' ' ' ' ' ' ' ' ' ' ~'
...
...
''~ ~~'
..
...
..
....
'~ ''
"
'''' '~' '~'
~' ~ '
..
....
...
.
....
....
...
...
...
''
''' ~ ~
....
~~~ ~ ' ~
..
...
~ " ' ' '''
..
...
..
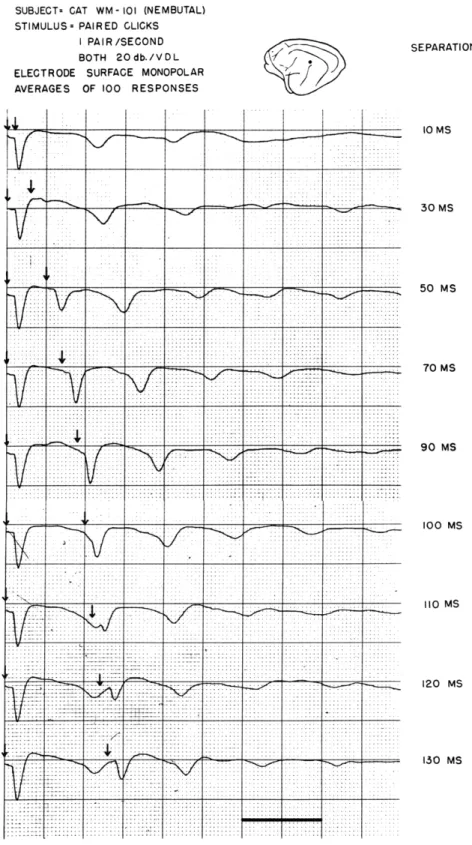
100 MSFig. XV-10.
Average response to pairs of acoustic clicks as a
function of the time separation between the clicks.
146
. __ 10 MS 30 MS 50 MS 70 MS 90 MS 100 MS 110 MS 120 MS 130 MS - I(XV.
COMMUNICATIONS BIOPHYSICS)
by presenting pairs of click stimuli separated by an adjustable time interval
T.Figure XV-10 shows that, when the interval is less than 30 msec, the time at which
the first repetitive response occurs depends only slightly on the interval between the
two clicks, but as
Tis increased further, the "timing" of the repetitives is "reset" by
the second click. The time interval between the second stimulus presentation and the
following repetitive responses remains nearly constant as
Tis further increased.
SUBJECT= CAT WM-102 STIMULUS= PAIRED CLICKS
I PAIR/SECOND BOTH 30db./VDL
ELECTRODE= SURFACE MONOPOLAR AVERAGES OF 100 RESPONSES A B SEPARATION
.
...
..
i i i i
.
...
...
l ~ : i i i
..
I
. .. .. . .. . . . . . . ... ... . ... ... EL E C T R O D E B ..-. .... : : : :' .... . . . .. . . .. ... . . . .. . . . . ... . . . .... ... . . . . . . . . . . . . . . . . .. . . .. . . .. .. ... .. . . . ..-.. . . ... .... . . . .. ...
.
.
..
.
.
I
.
... .
. .. . .. .. . .. . .. . . . . . . . .. . . .. . . . . . .. , . . . . , . . . . . . ... . . .... : ' ... ... .. *... .. .... .. ... ... ; ,.. 100 Ms. 100 MS 110 MS 120 MS 100 MS 110 MS. 120 MS.Fig. XV-11. Average response to pairs of acoustic clicks
at two different electrode locations (A in AI
and B high in EP).
147
-~
SUBJECT= CAT WM-IOO STIMULUS= PAIRED CLICKS
I PAIR/SECOND 92 MS. SEPARATION SECOND CLICK 25db/VDL
ELECTRODE SURFACE MONOPOLAR
AVERAGES OF 100 RESPONSES
...
.
...
..
...
: .. . .... :::: ...:.- ..' : ..... !i~ ii ! q i"X i' i i i ii i i i... !l!,.. ,.,;li',lll~~~~~~i .[. : : : i : " F t :' : ... .... ... . . . .. .. . .. . . ..- , 1 , , , , ' '! r " . ... .' t H F r -.. " - . . .. . . ... . - , ,, , : , , .T -[ :T: .v, - '-
---
'
~
"
~
' "
~
. ... :. : . ... tO 0 M.S.........
...
...
...
...
...
...
...
...
...
7 1 . .. . .. . ... . A r .. ... . .. ... . .. '' ' t . . . . . .. . ... ... . . .. .. 444H+' ''Ait-TI, ++'''' 100 MS~~ <0 INTENSITY OF FIRST CLICK RE/VDL -5db. 5db. 15db. 25db.Fig. XV-12. Average response to pairs of acoustic clicks as
a function of the intensity of the first click.
148
(XV.
COMMUNICATIONS BIOPHYSICS)
For
7
from 90 to 130 msec, the primary evoked response to the second click
inter-acts
with the first repetitive response to the first click, as is seen in Fig. XV-10. For
T
=
90 msec, the primary evoked response to click 2 occurs just before the first
repeti-tive response to click 1, and for equal stimulus intensities it is about equal in size to
that of the primary response to click 1. As
Tis increased to 100 msec, the primary
evoked response to click 2 and the repetitive response to click 1 merge into one surface
positive deflection. As
Tis further increased, the primary evoked response to click 2
is seen to emerge from the first repetitive response, with a peak-to-peak amplitude
that is about half that of the primary response to click 1.
Although we have not studied the dependence of this phenomenon on the location
of the recording electrode in great detail, Fig. XV-11 indicates that such a
depend-ence exists.
The primary evoked response at electrode A that results from the
presentation of click 2 is somewhat decreased in size with respect to the response
(XV.
COMMUNICATIONS BIOPHYSICS)
to click 1 at
T=
110 msec, but is clearly distinguishable from the repetitive response,
whereas, at electrode B the primary evoked response to click 2 is barely
dis-cernible when i is 110 msec, and remains diminished in size even when 7 is120 msec.
The effect of varying the intensity of click 1 with
Theld fixed at 92 msec
is shown in Fig. XV-12.
With the intensity of click 2 constant, increasing the
intensity of click 1 appears to shorten the interval between successive repetitive
responses.
Click
1
thus has a marked effect even when it is
10 db less intense
than the later click. Figure
XV-13
shows the effect of varying the intensity of
click 2 while
Tand the intensity of click 1 remain constant. The abrupt resetting
SUBJECT, CAT WM-10O (NEMBUTAL) STIMULUS. PAIRED CLICKS
I PAIR/SECOND 92 MS. SEPARATION FIRST CLICK 25db/VDL ELECTRODE. SURFACE MONOPOLAR
AVERAGES OF 100 RESPONSES /
v: .. : : .
~.
:; 1: ;;i, ijI .i i i i li iiiiiil~ i :!ii~ ii~ili ii i l i i i ! lji!!!iiii ::::l ":: l:l.:: .: .: .... ii ii....
iii ii i ii i i: 100 MS. INTENSITY OF SECOND CLICK RE. V.D.L. Odb. 3db. 5db. IOdb, 25 db.Fig. XV-13. Average response to pairs of acoustic
clicks as a function of the intensity of
the second click.
149
I I
--(XV. COMMUNICATIONS BIOPHYSICS)
of the timing of the repetitive responses as the intensity of click 2 is raised from
3 db to 5 db is particularly striking; it shows that a small change in stimulus
inten-sity can have a relatively large effect on the timing of the repetitive responses.
C. E. Molnar, T. F. Weiss
References
1.
H.-T. Chang, The repetitive discharges of corticothalamic reverberative circuit,
J. Neurophysiol. 13, 235-258 (1950).
C.
FIRING PATTERNS OF SINGLE CELLS IN THE AUDITORY CORTEX
We have continued to study firing patterns of single neurons in the auditory cortex
of the cat.
Details of the experimental equipment and conditions have already been
described (1). Acoustic clicks were presented to the anesthetized cat in a repeating
pat-tern of 15 seconds of stimulation followed by 15 seconds of silence.
Recorded data
were processed by the TX-0, a general purpose digital computer, to yield two forms
of analysis which, for convenience, are again defined: (a) Time histogram
-
a
histo-gram of the distribution of action potentials in time relative to the instant of stimulus
presentation (summed over many stimulus presentations); and (b) interval histogram
-
a histogram of the distribution of the interspike intervals (i. e., time intervals that
TIME -64-..11I I SEC ... T34 K SP SN T 16 941
Ii
I~i
A
1
-a
dII.
I
I SECFig. XV-14.
Cell showing initially decreased activity.
Stimulated condition
on left, spontaneous on right.
(In these figures the stimulus
conditions are shown in upper right corner of each histogram.)
150
T 345 K-L -ISC 15 sme
(XV.
COMMUNICATIONS BIOPHYSICS)
128-,LL* i .JhIIL 256- T 330 8-C i EIM 4 266 CAT G G 116 DEPTH, 11404 . STIMULUS, I/S VDL + 20 DB BIN, 8 MSEC EC CLICKSFig. XV-15. Cell showing initially increased activity and late small peaks of firing.
separate two successive action potentials).
All firing patterns that we have observed can be classified in terms of the first 200 msec of the time histogram and fall conveniently into three categories which are briefly described below. It should be noted that all cells studied fired spontaneously
1-10 times per second. Depths indicated on the figures were measured from first con-tact of the electrode with the incon-tact dura. The actual depth of penetration of the electrode tip below the cortical surface was therefore approximately 1 mm less than indicated.
(a) Decreased activity. The time histogram shows a 70-150 msec period of decreased firing following presentation of the click. The inhibition may be partial or complete. There may be several subsequent increases and decreases of the firing
151
256- T-330 A.-8 09I
7
S219
9
". ... .. ...I C ... " ....
TIME I.SEC I SEC
INTERVAL I SEC
; . .. . ... . . . . . . ;. . . . ... . .
(XV. COMMUNICATIONS BIOPHYSICS)
activity, spaced approximately 100 msec apart. Figure XV-14 shows time histograms for a cell with partially reduced firing.
(b) Increased activity. The time histogram shows a large peak (i. e., frequent firing) coinciding in time with the gross evoked response. Such a cell generally then demon-strates a silent period, and at a later time may show preferred times of firing spaced at about 100 msec. The extent to which such later firing peaks appear varies consider-ably, as will be described later. Figure XV-15 shows time and interval histograms for this type of cell with small late peaks.
(c) Unchanged activity. The time histogram shows no visually significant difference between the stimulated and spontaneous conditions. Figure XV-16 shows time histo-grams for such a cell observed with several different rates of click stimulation. This type of cell seems rare - the example given in Fig. XV-16 came from a relatively deaf cat whose VDL for the gross evoked response was some 60 db above normal.
The interval histograms for most cells show a little change between the stimulated and spontaneous situations. There is characteristically a high peak at small values of time interval, which corresponds to firing of the cell in short fast bursts of two or three action potentials. For cells that exhibit late peaks or preferred firing times on a time histogram, there is usually a corresponding 100-msec peak on the interval histogram. Figure XV-17 shows a typical set of interval histograms at three different rates of stim-ulation for a cell that was inhibited by the click (type 1 above).
One of the longstanding problems plaguing workers in this field has been the clarifi-cation of the relationship between single-neuron action potentials and the spontaneous and evoked "slow waves" [see the review by Purpura (2)]. Typically, the oscilloscope record shows no correlation of the action potential to either the slow wave at the cortical surface or to the slow waves at the microelectrode location, except in a few isolated instances (3,4). If the slow waves are interpreted as post-synaptic potentials in dendritic structures, the apparent lack of correlation is not surprising: the observed slow wave is an extremely complex spatial summation of the effects of many different inter-woven dendrites, whereas the action potential represents the activity of only one cell. The effects of the spatial summation can be mitigated by recording intracellularly. Under such conditions (5, 6) the observed post-synaptic and action potentials originate in the same cell and there is indeed a very high degree of correlation. By use of statistical methods, this correlation could be employed to isolate the post-synaptic potentials of a single cell from a summated extracellular recording by averaging the summated slow wave relative to the times of occurrence of bursts of action potentials from the selected cell. This would be a difficult process at best, but would allow study of the spatial dis-tribution of that portion of an extracellular slow wave which is contributed by a particular cell.
The possibility of a relatively small interaction of the summated extracellular slow
TIME
T 350 35 J- J* I<
IISEC
IS -64-34 33
343 373
.au,..,. l L.a
],,I~LpL
L
I SEC T 350 L- I SEC 36 947 200 MSEC CAT GG 119 I SEC - 64- ... .
iQI
SEC 35 612 200 MSEC DEPTH, 2200/STIMULUS , ALTERNATING 15-SEC PERIODS OF
CLICKS AND SILENCE
Fig. XV-16.
Cell showing unchanged activity.
INTERVAL
S...
- 2 5 6 -32. S.. .C ... ... ... ... .... . ... ...... AT GG 120DEPTH , 2340 ,u BIN , 8 MSEC
STIMULUS, ALTERNATING
5-SEC PERIODS OF
CLICKS AND SILENCE
... :". f 5 .~ 5 6 - ... I "" *
~
:
-5-2 5 633-4~
T3
3*I 29 .29 I 3 1474...
....
....
...
... ... ... ...
. . . ... .. . . . .. ... .... . ... ... . ... .. .... ... . . .. .. .. . .. . .. . . ... . . .. .. .. ... ° . .. . .. . . ... . .. ... ... . . . ... .. .. .. .i . ... ... . .. .. .... .... .. .. ... ... : . .. . . . . .. .... .. . ... ... .. . .. . .. . . .. .. . . . . . .. . ... ...A.A.--A
... ... :-1 T 0 L ' 9ll:u -256-S31
S1.21 ....... ... ... .... 30 *042 I SEC I SECFig. XV-17.
Interval histograms for a cell showing initially decreased
activity. Various rates of stimulation are indicated. The
associated interleaved spontaneous periods are shown in
the right-hand column.
TIME ... .... L t -6 4 -26 2912 ST 363 43-
5fS
C -64-21 1447liii
,L.
.,~
CAT GG 120DEPTH, 21340 ,. BIN, 2 MSEC
STIMULUS, ALTERNATING
15-SEC PERIODS OF
CLICKS AND SILENCE
:22 1432 : S... K -... " ' l ' ' , -128 . ... ' I . 2: 24
1
.
1334
! : ! : ii
200 MSEC 200 MSECFig. XV-18. Time histograms at various rates of stimulation; associated
spontaneous periods at right. The curves are the average of
the slow wave observed with the same electrode.
(XV. COMMUNICATIONS BIOPHYSICS)
wave and the occurrence of action potentials can be investigated in our recordings by other statistical means. This has been done by comparing the time histogram of the action potentials (i. e., the average firing probability at various times after stimulus delivery) with the average of the slow wave at the same times after stimulus. Instead of comparing the occurrence of the action potential and some feature of the slow wave directly (as can be done in a statistical sense), we are relating each phenomenon to the instant of stimulus delivery. A parallel time course of fluctuations in the averages then indicates a high degree of correlation between certain features of the summated extra-cellular slow wave and the occurrence of action potentials. (We are repeatedly using summated slow wave to emphasize that interactions of such slow waves with the occurrence of action potentials imply the graded interactions of many cells with
T 345 K-
iI
SEC 4 21 878 ... .... ... ... :T.. .34.5 ..LE - 64I17
-342 200 MSEC CAT GG 118 DEPTH, 2550,u. STIMULUS, ALTERNATING 15-SEC PERIODS OFCLICKS AND SILENCE
T 345 L-1 SF"qT
18 .511
200 MSEC
Fig. XV-19.
Data from another cell, processed as in Fig. XV-18.
(XV. COMMUNICATIONS BIOPHYSICS)
the one cell under study.)
A comparison of the kind just described is shown in Figs. XV-18 and XV-19 for two different cells. The time histogram for various click presentation rates follows previous format. The curves are slow-wave averages relative to the instant of stimulation which were computed by the ARC-1 computer. The slow-wave average is plotted positive downwards for convenience in examining the parallel time course of fluctuations. It is not surprising to find that an average positive slow wave is related to a smaller firing probability for the cell, whereas an average negative slow wave is related to a higher firing probability. This experiment does not establish a particular causal relationship of the two phenomena: It should be noted in this context that most action potentials can be abolished by increasing the depth of anesthesia without significantly altering the observed slow waves; i.e., the relationship is dependent upon physiological state.
In examining the auditory cortex with gross electrodes and short click or shock
TIME
- 256
CLICKS, I/sec
VDL + 50 Db
Fig. XV-20.
Time histogram for a cell showing initially increased activity
and late peaks of firing. The curve shows repetitive responses
in the slow-wave average.
in the slow-wave average.
(XV. COMMUNICATIONS BIOPHYSICS)
stimulation, one frequently observes the evoked response followed by a train of similar waves spaced at approximately 100 msec. Such large repetitive waves have been studied by Chang (7) at deep levels of anesthesia where variability of the response is low, and more recently with the aid of ARC-1 by Molnar and Weiss (Sec. XV-B) at light levels of anesthesia.
In an operational sense it is interesting to see whether such large, widespread fluc-tuations of the summated slow waves are associated with changes at the cellular level. Figure XV-20 shows a time histogram of a cell whose firing was increased by the click stimulus, and which also exhibited late peaks of firing. The curve is the average of the slow wave on the same time scale, positive downwards. As before, higher firing prob-ability of the cell is related to negative peaks of the slow wave. There seems little indi-cation that the firing probability decreases much below the "spontaneous" value during any portion of the repetitive slow wave. The later observation should be contrasted with reported cyclic supernormal and subnormal variations of cortical responsiveness assessed in terms of the amplitude of the evoked response to clicks.
It is perhaps appropriate to emphasize again that caution should be used in drawing conclusions from such comparisons of the behavior of slow waves and of action poten-tials (a) because of the very complex anatomical structure of cortex and (b) because interactions of cells in a cluster are so poorly understood that a systematic study of neural "domains" is urgently necessary. The slow wave in particular may show
con-siderable variation as a function of location or depth. Dendritic portions of a particular cell may span several regions where the slow wave is quite different from that measured by the electrode that records the action potential.
The relation between the graded and discrete aspects of cortical function represents one of the most challenging tasks in assessing the activity of the nervous system; many approaches need to be employed to deal with the multivariate character of these relations.
G. L. Gerstein
References
1. G. Gerstein, Firing patterns of single cells in the auditory cortex, Quarterly Progress Report No. 56, Research Laboratory of Electronics, M.I.T., Jan. 15, 1960,
pp. 189-192.
2. D. Purpura, Nature of Electrocortical Potentials, International Review of Neurobiology, Vol. 1, edited by C. Pfeiffer and J. Smythies (Academic Press, Inc., New York, 1959).
3. C.-L. Li and H. Jasper, Microelectrode studies of the electrical activity of the cerebral cortex in the cat, J. Physiol. (London) 121, 117 (1953).
4. V. B. Mountcastle, Modality and topographic properties of single neurons of cat's somatic sensory cortex, J. Neurophysiol. 20, 408 (1957).
(References continued on following page)
(XV. COMMUNICATIONS BIOPHYSICS)
5. D. Albe-Fessard and P. Buser, Activites intracellulaires recueillies dans le cortex sigmolde du chat: participation des neurones pyramidaux au "potentiel evoque"l somasthdsique, J. Physiol. (Paris) 47, 67 (1955).
6. C. G. Phillips, Intracellular records from Betz cells in the cat, Quart. J. Exptl. Physiol. 41, 58 (1956).
7. H.-T. Chang, Changes in the excitability of cerebral cortex following single electric shock applied to cortical surface, J. Neurophysiol. 14, 95 (1951).