HAL Id: inserm-02937689
https://www.hal.inserm.fr/inserm-02937689
Submitted on 14 Sep 2020
HAL is a multi-disciplinary open access
archive for the deposit and dissemination of
sci-entific research documents, whether they are
pub-lished or not. The documents may come from
teaching and research institutions in France or
abroad, or from public or private research centers.
L’archive ouverte pluridisciplinaire HAL, est
destinée au dépôt et à la diffusion de documents
scientifiques de niveau recherche, publiés ou non,
émanant des établissements d’enseignement et de
recherche français ou étrangers, des laboratoires
publics ou privés.
systemic glucose level
Nsrein Ali, Hamid Reza Rezvani, Diana Motei, Sufyan Suleman, Walid
Mahfouf, Isabelle Marty, Veli-Pekka Ronkainen, Seppo Vainio
To cite this version:
Nsrein Ali, Hamid Reza Rezvani, Diana Motei, Sufyan Suleman, Walid Mahfouf, et al.. Trisk 95 as a
novel skin mirror for normal and diabetic systemic glucose level. Scientific Reports, Nature Publishing
Group, 2020, 10 (1), pp.12246. �10.1038/s41598-020-68972-6�. �inserm-02937689�
Trisk 95 as a novel skin mirror
for normal and diabetic systemic
glucose level
Nsrein Ali
1,6*, Hamid Reza Rezvani
2,3, Diana Motei
1, Sufyan Suleman
1, Walid Mahfouf
2,
Isabelle Marty
4, Veli‑Pekka Ronkainen
5& Seppo J. Vainio
1,6,7Developing trustworthy, cost effective, minimally or non‑invasive glucose sensing strategies is of great need for diabetic patients. In this study, we used an experimental type I diabetic mouse model to examine whether the skin would provide novel means for identifying biomarkers associated with blood glucose level. We first showed that skin glucose levels are rapidly influenced by blood glucose concentrations. We then conducted a proteomic screen of murine skin using an experimental in vivo model of type I diabetes and wild‑type controls. Among the proteins that increased expression in response to high blood glucose, Trisk 95 expression was significantly induced independently of insulin signalling. A luciferase reporter assay demonstrated that the induction of Trisk 95 expression occurs at a transcriptional level and is associated with a marked elevation in the Fluo‑4AM signal, suggesting a role for intracellular calcium changes in the signalling cascade. Strikingly, these changes lead concurrently to fragmentation of the mitochondria. Moreover, Trisk 95 knockout abolishes both the calcium flux and the mitochondrial phenotype changes indicating dependency of glucose flux in the skin on Trisk 95 function. The data demonstrate that the skin reacts robustly to systemic blood changes, and that Trisk 95 is a promising biomarker for a glucose monitoring assembly.
In view of its dynamic behaviour in the presence of multiples stress, the human skin is widely used to test cellular and molecular responses to specific treatments. Mirroring the biological and physiological internal changes in healthy and disease environments via the skin is the new revolutionary approach. The paradigm is based on the skin ultrastructure, consisting a sensory neuron network in tight connection with the skin keratinocytes1.
Moreo-ver, there are numerous clinical studies describing the skin features related to pancreas diseases2,3, rheumatic
disorders4 and lung diseases5. Recent reports have revealed the presence of specific biomarkers in the skin that
may serve for early diagnosis of neuronal conditions such as Alzheimer’s and Parkinson’s diseases6. In addition,
acute or chronic ulcers, which are the most widely described skin features related to type I diabetes, are associ-ated with reduced skin wound healing and an increased risk of infections7–10. These facts have meant that new
biomarkers and non-invasive devices for glucose monitoring in the skin have emerged on the market in the last decade11–14. In fact, the currently most widely used devices require skin penetration as far as the interstitial fluid,
and are thereby invasive, although a new generation of devices based on the measurement of various metabolites in sweat such as sodium, lactate, potassium and glucose has been proposed recently15–18. One major drawback
with such devices, however, is the amount of sweat required, resulting in secondary effects such as skin irrita-tion. In view of all the devices and the skin features to high glucose, we propose a new paradigm that operates by converting the skin keratinocytes cells to serve as biosensors for monitoring blood glucose.
Keratinocytes are the main cell type (≈ 90%) constituting the epidermis19,20, and with respect to their key roles
in wound healing21, they have been extensively studied, notably in cases of diabetes22–24. Reports have
demon-strated that impaired keratinocytes function can result in delayed wound healing, and that multiple physiological processes in keratinocytes, such as proliferation25, migration26, apoptosis27 and differentiation28, may be affected
by a hyperglycaemic condition. Moreover, the skin barrier dysfunction29,30 and increased inflammation31–33
open
1Laboratory of Developmental Biology, Faculty of Biochemistry and Molecular Medicine, Biocenter Oulu,
University of Oulu, Aapistie 5A, 90220 Oulu, Finland. 2Inserm, BMGIC, UMR 1035, University of Bordeaux,
Bordeaux, France. 3Centre de Référence pour les Maladies Rares de la Peau, CHU de Bordeaux, Bordeaux,
France. 4Inserm U1216, Grenoble Institut des Neurosciences, University Grenoble, La Tronche, France. 5Biocenter
Oulu, University of Oulu, 90220 Oulu, Finland. 6Infotech Oulu, University of Oulu, 90220 Oulu, Finland. 7Borealis
brought about by a hyperglycaemic environment will prevent the keratinocytes from healing; probably leading to continuously infected severe skin lesions34,35. In view of the literature, skin keratinocytes could be used as
indicators of the status of normal and diabetic skin.
We set out here to investigate whether blood glucose concentration could be monitored by means of keratino-cytes and whether this sensing activates specific biomarkers and their signalling pathways. Our results show that Trisk 95 expression is increased in the skin and its primary keratinocytes following an increase in blood glucose concentration. In turn, upregulation of Trisk 95 is associated with an increase in the intracellular calcium level, which then triggers a particular modification in the morphology of the mitochondrial network.
Our data suggest that keratinocytes could serve as promising biological sensors for developing a new genera-tion of blood glucose monitoring devices, especially for use with diabetic patients.
Results
Skin glucose levels are rapidly influenced by glucose concentrations in the blood.
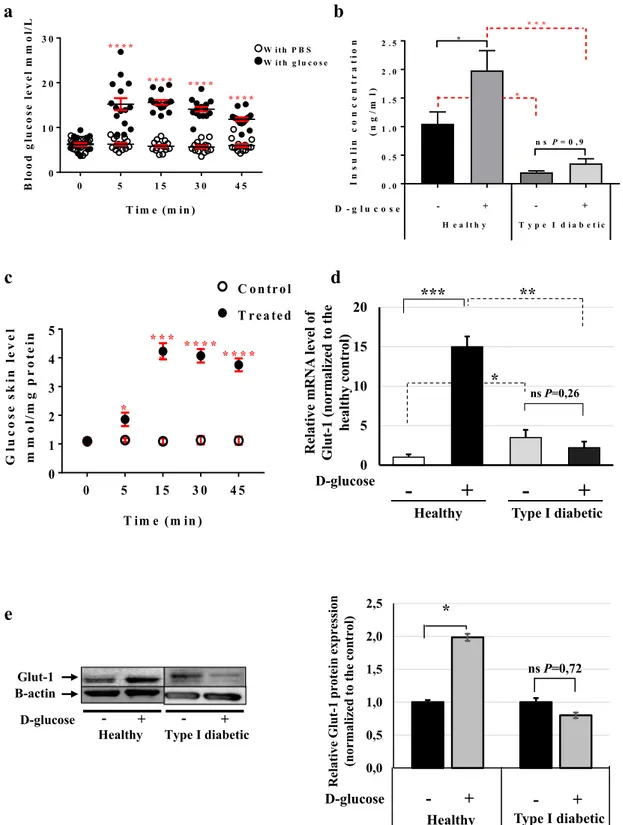
Little is known about the responses of epidermal cells to increased blood glucose concentrations or whether a particu-lar signalling network is activated in these cells. To test this hypothesis, we first injected glucose into healthy and type I diabetic mice, the latter having been prepared as previously described36. Briefly, C57BL/6 mice weredivided into two groups: (healthy) controls, which were injected intraperitoneally with citrate buffer (pH 4.5), and type I diabetic mice, which received one single dose of 150 mg/kg streptozotocin (STZ). Blood glucose was monitored every 48 h and the mice were considered diabetic when its level was ≥ 15 mmol/l (data not shown). The first step was to select a suitable end-point at which the blood glucose level in the healthy mice reaches that found in the diabetic mice (≥ 15 mmol/l), as this can be used for collecting the skin samples. For this purpose, we performed a glucose tolerance test (GTT) on the healthy mice. After fasting for 12 h, the mice were divided into two groups: a control group in which PBS was injected intraperitoneally, and a treatment group that received 2 g/kg d-glucose. Serum was collected from both groups (15 animals/group) at time-points 0, 5, 15, 30 and 45 min and blood glucose levels were monitored. The results showed a significant increase in blood glucose at 5 min post-injection in the glucose-injected mice (15.20 mmol/l ± 1.36) (Fig. 1a, full circle) as compared with the placebo-treated mice (6.27 mmol/l ± 0.31) (Fig. 1a, empty circles). The glucose concentration remained at this level up to the 45 min time-point and then started to drop (Fig. 1a). However, no changes in the blood glucose were observed in the glucose- and placebo-injected type I diabetic mice (Supplementary Fig. 1a and Table 1).
Measurement of the blood insulin concentrations at 45 min after glucose injection showed a significant increase in its level in the glucose-injected healthy mice (1.98 ng/ml ± 0.34) versus (1.05 ng/ml ± 0.20) in the placebo-injected mice, whereas the blood insulin concentration in the type I diabetic mice did not differ between those receiving a placebo or a glucose injection (0.35 ng/ml ± 0.08; and 0.20 ng/ml ± 0.026, respectively) (Fig. 1b). To determine the impact of the increase of blood glucose concentrations on that of the skin, the skin glucose levels were monitored at the different time-points following glucose injection. Results showed that the skin glucose levels were increased gradually with a peak at 15 min after glucose injection in healthy mice (Fig. 1c). The skin glucose concentration remained at this level up to 45 min after glucose injection, as observed for the blood glucose level. However, no changes in the skin glucose level were observed between placebo-injected type I diabetic mice (Supplementary Fig. 1b). Comparing the skin glucose concentrations among four groups revealed that a significantly much higher amounts of glucose detected in the skin of the placebo- and glucose-injected type I diabetic mice compared to the healthy mice at different time-points (Supplementary Fig. 1c,d). To find the mechanism by which blood glucose is taken up by the skin, we examined the expression of glucose transporter-1 (Glut-1) at the mRNA and protein levels at 45 min post-injection. Our data demonstrated a 15-fold increase in Glut-1 mRNA in the healthy mice after the glucose injection (Fig. 1d), while the Glut-1 protein level was upregulated (Fig. 1e).
Examination of Glut-1 expression in the diabetic mice indicated that glucose injection affected neither its mRNA expression nor its protein expression (Fig. 1d,e and Supplementary Fig. 1e,f). On the other hand, the
Glut-1 mRNA expression level in the placebo-injected type I diabetic mice was 3.4-fold higher than in the
placebo-injected healthy ones (Fig. 1d). This may explain why the glucose level is significantly higher in the skin of diabetic mice than in that of healthy mice. Taken together, these results suggest that a modification in blood glucose concentration will regulate the skin glucose level in the same direction.
Trisk 95 is a novel biomarker for detecting glucose in the skin.
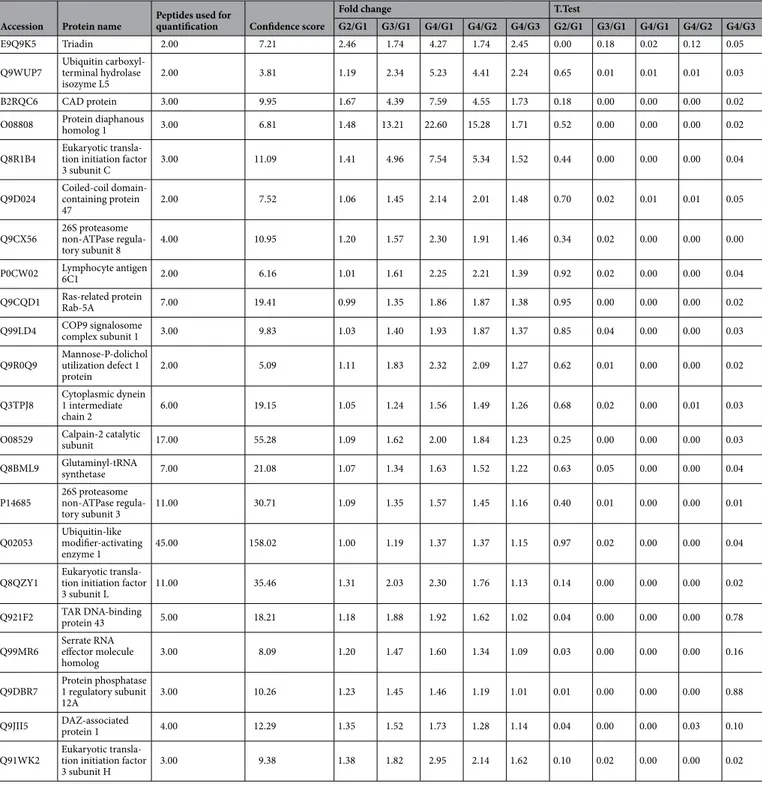
We then examined whether a spe-cific pathway is activated in the skin upon an increase in blood glucose concentration. In respect to our finding showing that both blood and skin glucose levels are starting to decrease at 45 min, as well as the fact that 45 min is an optimal period for the glucose diffusion in the skin37–39.We, therefore, performed label-free differential proteomic analyses of the skin biopsies taken from the placebo and glucose-injected healthy and type I diabetic mice at 45 min post-injection. The results highlight the proteins that were significantly increased in three groups of comparisons (G2 vs G1, G4 vs G1, and G4 vs G3) (Supplemen-tary Fig. 2a and Table 2). Based on our approach consisting on the identification of the potential biomarkers that respond as glucose-dependent and insulin-independent signalling, we found that Triadin isoform-1 (Trisk 95) was the protein among all others that significantly increased in both the healthy and type I diabetic groups after glucose injection (Fig. 2a). To investigate further the effect of blood glucose concentration on Triadin expres-sion, Trisk 95 mRNA levels were measured in the skin of the different groups of mice at 45 min post-injection. Consistent with the proteomic data, the results showed 3.45–4-fold increases in Trisk 95 mRNA in both the healthy and type I diabetic mice receiving an intraperitoneal injection of glucose (Fig. 2b). Since the blood insulin
Figure 1. Skin rapidly senses any increase in blood glucose. (a) GTT assay using C57BL/6 mice. The mice were divided into two
groups: the control group (empty circle) was injected IP with PBS, and the treated group (full circle) with 2 g/kg d-glucose diluted in PBS. Blood glucose levels were monitored at the given time points (n = 15 mice/group). (b) Insulin concentrations in healthy and type I diabetic mice. Insulin levels at 45 min post-injection were measured using the Insulin Rodent Chemiluminescence ELISA technique (n = 6 mice/group). (c) Skin glucose levels in vivo. The GTT assay was performed and skin biopsies were collected at 0, 5, 15, 30 and 45 min post-injection (n = 7 mice/group). Glucose levels were measured using the YSI 2,950 Biochemistry Analyzer (YSI Life Sciences) and normalized to the total concentration of proteins (mmol/mg protein). (d) Glut-1 mRNA levels at 45 min post-injection in the skin of both healthy and type I diabetic mice was quantified by qRT-PCR. The results are shown as averages after normalization to the controls ± SD (n = 6/group). (e) Glut-1 protein expression level at 45 min post-injection was determined then quantified by western blotting and b-actin was used as a loading control. Two-way ANOVA analysis was performed in a using GraphPad Prism software, ****P < 0.0001 and (c) (*P < 0.02; ****P < 0.0001 respectively). One-way ANOVA was used for multiple comparisons in (b) (*P < 0.03; *P < 0.041; ***P < 0.0002, ns not significant 0.9, respectively). Two-tailed Student’s test was used in (d) (*P < 0.01; **P < 0.0094; ***P < 0.0003, respectively), and (e) (*P < 0.023, ns not significant 0.72).
concentration in type I diabetic mice does not change after a glucose injection, we concluded that the upregula-tion of Trisk 95 in the skin mediated by an increase in blood glucose takes place via an insulin-independent pathway. To further confirm this observation, we have injected the healthy mice using different glucose con-centrations; 45 min post-injection Trisk 95 mRNA expression levels were examined. Our finding demonstrated significant increases of Trisk 95 mRNA expression that were associated with the increases of blood glucose in dependent manner (Fig. 2c). This data show a strong evidence that Trisk 95 expression is actively dependent of glucose-pathway.
Because the skin contains different cell types, and to further confirm specifically the Trisk 95 expression in primary mouse keratinocytes, we then cultured them in the presence of low (5 mM) and high (25 mM) d-glucose concentrations. In this experiment, primary keratinocytes isolated from healthy mice were cultured in a low-glucose medium for 10 days. The medium was then replaced with a fresh medium containing either a low (5 mM) or a high (25 mM) glucose level. Forty-five minutes later cell and medium samples were collected for further analysis. Measurement of the glucose uptake indicated a significant increase in glucose consumption when the cells had been incubated for 45 min in the presence of a high glucose concentration (2.43 ± 0.1 mmol/ ug protein versus 0.43 ± 0.07 mmol/ug protein) (Fig. 2d), while Trisk 95 mRNA and protein expression levels had likewise increased 2.3 and 1.6-fold, respectively (Supplementary Fig. 2b,c; Fig. 2e,f). Consistently with this, immunostaining of keratinocytes pointed to a significant increase in the expression of Trisk 95 (red) when cells were cultured in the presence of 25 mM d-glucose (Fig. 2g).
To further examine whether the glucose concentration affected the transcriptional expression of Trisk, we used a luciferase reporter plasmid in which the 882 bp region upstream of the ATG translation initiation codon of human TRDN had been cloned upstream of the luciferase. The results showed a significant increase in luciferase expression upon treatment of the cells with 25 mM d-glucose (Fig. 2h), indicating that the extracellular glucose concentration affects Triadin expression at the transcriptional level.
An increased blood glucose concentration will trigger intracellular calcium level modifica‑
tions.
Given that Trisk 95 is a well-known actor in calcium release from the endoplasmic reticulum (ER) in skeletal and heart muscles40–43, we then wondered whether the Trisk 95 overexpression mediated by a highglucose concentration might affect the calcium level in the ER store. To answer this question, the basal level of intracellular calcium was imaged live using Fluo-4 AM 45 min after culturing primary mouse keratinocytes with either a low or a high-glucose medium.
To evaluate the release of calcium from ER, thapsigargin (an inhibitor of sacro/endoplasmic reticulum Ca2+ ATPase (SERCA) pump function) was added to block the pumping of calcium back into the ER. A signifi-cant increase in the maximum amplitude (background-subtracted F1/F0, where F0 is the minimum level of
Table 1. Blood glucose level in type I diabetic mouse model. GTT assay was performed by using two groups:
the control group was injected with PBS, and the treated group with 2 g/kg d-glucose. Blood glucose levels were monitored at the given time points (n = 8 mice for control and n = 10 for treated).
Blood glucose level (mmol/L)/Time in min
Mouse number 0 5 15 30 45 PBS injcetion 1 27.3 26.2 33 33 30 2 27.4 27.3 33 33 33 3 28.4 33 33 33 33 4 29.6 32.6 33 32.9 33 5 29 31.6 32.4 33 33 6 28.3 30.6 33 33 33 7 33 33 33 33 33 8 30.2 32 33 33 33 d-glucose injection 1 28.8 32.7 33 33 33 2 28.1 33 33 33 33 3 29.4 26.3 33 33 33 4 30.4 27.4 33 33 33 5 17 28.7 27.6 33 30.9 6 33 33 33 33 33 7 26.5 33 33 33 33 8 22.6 33 32.1 33 33 9 33 33 37.9 33 33 10 33 33 33 33 33
Table 2. The effect of the glucose injection on the proteomic profiles in both of the healthy and diabetic mice.
Description (Accession, protein name, peptides used for quantification, confident score, and fold change) of a set of proteins that are significantly increased in response to high glucose in the different comparisons (G2/G1, G3/G1, G4/G2, G4/G3). G2 and G4 represent the mice from healthy and type I diabetic that were injected with d-glucose (respectively), while G1 and G3 represent the mice rom healthy and type I diabetic that received PBS injection. Two-tailed Student’s t-test was used for statistical analysis and with P value of < 0.05 was considered as significant.
Accession Protein name Peptides used for quantification Confidence score
Fold change T.Test
G2/G1 G3/G1 G4/G1 G4/G2 G4/G3 G2/G1 G3/G1 G4/G1 G4/G2 G4/G3
E9Q9K5 Triadin 2.00 7.21 2.46 1.74 4.27 1.74 2.45 0.00 0.18 0.02 0.12 0.05 Q9WUP7 Ubiquitin carboxyl-terminal hydrolase
isozyme L5 2.00 3.81 1.19 2.34 5.23 4.41 2.24 0.65 0.01 0.01 0.01 0.03 B2RQC6 CAD protein 3.00 9.95 1.67 4.39 7.59 4.55 1.73 0.18 0.00 0.00 0.00 0.02 O08808 Protein diaphanous homolog 1 3.00 6.81 1.48 13.21 22.60 15.28 1.71 0.52 0.00 0.00 0.00 0.02 Q8R1B4 Eukaryotic transla-tion initiation factor
3 subunit C 3.00 11.09 1.41 4.96 7.54 5.34 1.52 0.44 0.00 0.00 0.00 0.04 Q9D024 Coiled-coil domain-containing protein
47 2.00 7.52 1.06 1.45 2.14 2.01 1.48 0.70 0.02 0.01 0.01 0.05 Q9CX56 26S proteasome non-ATPase
regula-tory subunit 8 4.00 10.95 1.20 1.57 2.30 1.91 1.46 0.34 0.02 0.00 0.00 0.00 P0CW02 Lymphocyte antigen 6C1 2.00 6.16 1.01 1.61 2.25 2.21 1.39 0.92 0.02 0.00 0.00 0.04 Q9CQD1 Ras-related protein Rab-5A 7.00 19.41 0.99 1.35 1.86 1.87 1.38 0.95 0.00 0.00 0.00 0.02 Q99LD4 COP9 signalosome complex subunit 1 3.00 9.83 1.03 1.40 1.93 1.87 1.37 0.85 0.04 0.00 0.00 0.03 Q9R0Q9 Mannose-P-dolichol utilization defect 1
protein 2.00 5.09 1.11 1.83 2.32 2.09 1.27 0.62 0.01 0.00 0.00 0.02 Q3TPJ8 Cytoplasmic dynein 1 intermediate
chain 2 6.00 19.15 1.05 1.24 1.56 1.49 1.26 0.68 0.02 0.00 0.01 0.03 O08529 Calpain-2 catalytic subunit 17.00 55.28 1.09 1.62 2.00 1.84 1.23 0.25 0.00 0.00 0.00 0.03 Q8BML9 Glutaminyl-tRNA synthetase 7.00 21.08 1.07 1.34 1.63 1.52 1.22 0.63 0.05 0.00 0.00 0.04 P14685 26S proteasome non-ATPase
regula-tory subunit 3 11.00 30.71 1.09 1.35 1.57 1.45 1.16 0.40 0.01 0.00 0.00 0.01 Q02053 Ubiquitin-like modifier-activating
enzyme 1 45.00 158.02 1.00 1.19 1.37 1.37 1.15 0.97 0.02 0.00 0.00 0.04 Q8QZY1 Eukaryotic transla-tion initiation factor
3 subunit L 11.00 35.46 1.31 2.03 2.30 1.76 1.13 0.14 0.00 0.00 0.00 0.02 Q921F2 TAR DNA-binding protein 43 5.00 18.21 1.18 1.88 1.92 1.62 1.02 0.04 0.00 0.00 0.00 0.78 Q99MR6 Serrate RNA effector molecule
homolog 3.00 8.09 1.20 1.47 1.60 1.34 1.09 0.03 0.00 0.00 0.00 0.16 Q9DBR7 Protein phosphatase 1 regulatory subunit
12A 3.00 10.26 1.23 1.45 1.46 1.19 1.01 0.01 0.00 0.00 0.00 0.88 Q9JII5 DAZ-associated protein 1 4.00 12.29 1.35 1.52 1.73 1.28 1.14 0.04 0.00 0.00 0.03 0.10 Q91WK2 Eukaryotic transla-tion initiation factor
fluorescence before adding thapsigargin) was observed in the cells incubated with 25 mM d-glucose compared with the controls (0.32 ± 0.037 versus 0.2 ± 0.02) (Fig. 3a). We then measured the speed with which half of the maximum fluorescence amplitude was reached, and the results showed a significant difference between these two conditions, the speed being significantly slower in the cells incubated with high glucose (76.82 ± 5.28 s) than in the controls (62.16 ± 3.59 s) (Fig. 3b), suggesting that the release of calcium from the ER was higher under these conditions. Two representative movies showing the time lapse measurements with analysis of the regions of interest and the averaged fluorescence intensity traces under both sets of conditions are presented as supplementary data (Supplementary Fig. 3a,b).
Primary keratinocytes exhibit alteration in mitochondrial network morphology due to the
Trisk 95 upregulation.
To test the hypothesis that mitochondria act to buffer intracellular calcium levels through the action of the mitochondrial calcium uniporter complex43,44, thereby affecting mitochondrialmetab-olism and the morphology of the mitochondrial network45,46, we first examined the effect of the extracellular
glu-cose concentration on mitochondrial morphology using electron microscopy (EM). The results showed that the majority of the mitochondria were subjected to a modification in their morphology when cells were incubated with 25 mM d-glucose during 45 min (Fig. 4a). For quantification purposes, we classified the mitochondria into two groups: 1—a normal group that can take various shapes (elongated or round) with arranged cristae and an electron-dense matrix (yellow dotted circles) (Fig. 4a), and 2—an abnormal group that are swollen, enlarged and round in shape, the disarrangement of their cristae accompanied by a partially or totally electron-lucent matrix (red dotted circles) (Fig. 4a).
Quantitative analyses indicated that while the majority of the mitochondria in the cells incubated with low glucose during 45 min belonged to the normal group, the majority of those in the cells incubated with high glucose exhibited an abnormal shape (Fig. 4a,b). Since mitochondria always behave as a network47,48, we then
assessed the effect of a high glucose concentration on the morphology of the mitochondrial network at 45 min in keratinocyte mitochondria staining with the MitoTracker probe. While the majority of the control keratinocytes demonstrated an interconnected network located mostly around the nucleus, the majority of the cells incubated with high glucose exhibited a fragmented mitochondrial network that was dispersed in the cytoplasm (Fig. 4c,d). To examine whether mitochondria are also affected under our in vivo conditions, skin biopsies were col-lected at 45 min post-injection from the four groups of mice and visualized under EM. A similar mitochondrial phenotype was observed in the basal keratinocytes of both the healthy and type I diabetic groups upon receiving an injection of glucose. Indeed, while the majority of the mitochondria in the placebo-injected healthy group belonged into our normal mitochondrial class (yellow dotted circles) (Fig. 4e,f), the majority of those in both the glucose-injected healthy and type I diabetic groups were swollen, enlarged and round in shape with disarrange-ment of their cristae (red dotted circles) accompanied by a partially or totally electron-lucent matrix (Fig. 4e,f). Significantly, the number of mitochondria belonging to the normal group was lower in the placebo-injected type I diabetic mice than in the placebo-injected healthy mice and that of the abnormal group higher (Fig. 4f). This could have been due to the high glucose level found in the skin of the type I diabetic mice even in the absence of glucose injection (see Fig. 1c).
Trisk 95 knockout abolishes the increase in intracellular calcium mediated by a high glucose
concentration and rescues the mitochondrial phenotype in the skin and its primary keratino‑
cytes.
To investigate the functional relation between Trisk 95 and intracellular calcium during the skin’s response to high blood glucose, skin biopsies were collected from the Trisk 95 KO mice 45 min after the injection of glucose or a placebo. To evaluate the basal calcium level, keratinocytes isolated from both groups were loaded with Fluo-4 AM. The results did not show any significant differences in basal calcium concentration betweenFigure 2. Trisk 95 is a new skin sensor for high blood glucose concentrations. (a) Proteomic profile of the skin
after glucose injection in vivo. Skin biopsies collected at 45 min post-injection from four groups were subjected to proteomic analysis. The results are presented as ratios of the fold change after normalization to the healthy mice injected with PBS (n = 5/group). (b) Trisk 95 mRNA expression level were quantified in the skin at 45 min after glucose injection using qRT-PCR. The results are shown as averages normalized to the control ± SD (n = 6 in the healthy group and n = 5 in the type I diabetic group). (c) Trisk 95 mRNA expression levels were quantified in the healthy mouse skin at 45 min after injection of different glucose concentrations. The results are shown as averages normalized to the control ± SEM (n = 4, 6, 7 and 5, respectively). (d) Glucose consumption in vitro using primary keratinocytes. Glucose consumption was measured and normalized to protein concentrations. Data are presented as means ± SEM from three separate experiments. (e) Western blot analysis of Trisk 95 in primary keratinocytes. (f) Quantification of Trisk 95 protein expression levels in the primary keratinocytes. The results are shown as averages after normalization to the control ± SEM in three separate experiments. (g) Detection of Trisk 95 (red) and DAPI (blue) by immunofluorescence. The C2C12 cell line was used as a positive control. Trisk 95 expression was observed in the ER of myoblasts as well as in the keratinocytes (white arrows), the signal being stronger in the cells incubated with high glucose than in the controls. Scale bar = 50 µm. (h) Triadin as a promotor of high glucose. Relative luciferase activities are presented as means ± SEM after normalization to the negative controls (n = 3 in separate experiments conducted in triplicate). Two tailed Student’s t-test was used in (a) (*P < 0.02; **P < 0.002), (b) (**P < 0.005; ****P < 0.0001), (d) (***P < 0.0002) and (f) (*P < 0.02). One-way ANOVA multiple comparison was used in (c) (*P < 0.01; ***P < 0.0008; ****P < 0.0001,
ns not significant P = 0.53). Two-way ANOVA multiple comparison was used in (h) (ns not significant. 0.99,
****P < 0.0001). ◂
the placebo and glucose-injected Trisk 95 KO mice (2.74 ± 0.62 vs 3.83 ± 0.58, p = 0.27) (Fig. 5a), indicating that Trisk 95 expression is necessary for high blood glucose-mediated modification to the skin calcium homeostasis.
In order to assess the role of Trisk 95 in the transitional modification of the mitochondrial phenotype, keratinocytes isolated from Trisk 95 KO mice and cultivated for 45 min in the presence of low or high glucose were examined by EM. Interestingly, the majority of the mitochondria in the Trisk 95−/− keratinocytes incubated
with high glucose exhibited an elongated shape accompanied by arranged cristae and an electron-dense matrix (Fig. 5b,c), a phenotype that has been classified as normal. These results indicate that Trisk 95 expression plays an important role in keratinocyte responses to the extracellular glucose level. To examine this hypothesis fur-ther, skin mitochondrial phenotype comparisons were made between the placebo and glucose-injected Trisk
Figure 3. High extracellular glucose concentrations induce changes in the intracellular calcium in primary
keratinocytes. (a) Intracellular calcium levels in primary keratinocytes after 45 min of glucose treatment. Cells were incubated for 30 min in the presence of Fluo-4 AM and intracellular calcium basal levels were measured for 50 s, after which thapsigargin was added to the medium. Time lapse recording was used to follow the increase in the fluorescence signal until the maximum amplitude was reached. The data showed a significant increase in the amount of cytosolic calcium in the cells incubated with high glucose relative to the controls (n = 41). (b) Speed required to reach the half maximum of the fluorescence signal. The keratinocytes incubated with high glucose were slower to reach their peak than were the controls. The two-tailed Student’s t-test was used for statistical analysis in (a) (*P < 0.01) and (b) (*P < 0.02).
95−/− mice, whereupon the results showed that the majority of the mitochondria in the basal keratinocytes were
normal in both groups (Fig. 5d,e), indicating that Trisk 95 downregulation blocks the mitochondrial phenotype modification mediated by a high blood glucose concentration in.
To further examine the role of calcium in mitochondrial phenotype modification when monitoring high extracellular glucose concentrations, keratinocytes isolated from healthy mice were first incubated with BAPTA, a well-known calcium chelator, for 45 min and then subjected to low or high glucose conditions for 45 min. His-tological examination of the mitochondrial phenotype indicated that treatment with DMSO (in which BAPTA was dissolved) did not affect the influence of extracellular glucose on the mitochondrial phenotype (Fig. 5f, see also Fig. 4b). The addition of BAPTA, however, significantly reduced the number of abnormal mitochondria in the cells subjected to high glucose (Fig. 5g). Taken together, our results indicate that the mitochondrial phenotype is triggered by calcium changes and can be rescued by adding BAPTA.
In order to analyse the molecular mechanism by which cytoplasmic calcium fluctuation could trigger mito-chondrial phenotype alternation in the skin and its primary cells, we examined at 45 min the expression of MCU and MICU1 (two well-known mitochondrial calcium uniporters), and found that, upon subjection to high glucose injection, MCU and MICU1 expression at the mRNA level were significantly increased in both healthy (3 and 2.8-fold increases, respectively) and type I diabetic mice (3.8 and 4-fold increases) compared with their control counterparts (Fig. 5h,i). Interestingly, when looking at MCU and MICU-1 expression levels in the Trisk 95 KO mice, we found that only MCU was significantly upregulated in the glucose-injected mice relative to the placebo-injected ones (a 1.16-fold increase) but not MICU1 (Fig. 6j). These findings suggest firstly that MCU and MCU1 are required together for activation of the mitochondrial calcium uniporter complex in keratinocytes, allowing calcium uptake, and secondly that the main function of Trisk 95 in keratinocyte responses to high extracellular glucose is to orchestrate that activation.
Discussion
This report provides evidence of skin functionality and its ability to sense internal changes communicated from other organs, and as an example; we describe a novel paradigm of using skin cells as biological sensors for mir-roring blood glucose levels (Supplementary Fig. 5). Our hypothesis in this schematic diagram is that the blood sugar level systemically influences the skin, resulting in the activation of specific mediators that can be used as potential targets when applying genome-editing technology. Thus, the edited stem cells are turned_on or _off by visualisation of the induced action of sugar. This strategy may be extended to monitor other health parameters in normal and diseases conditions and it is this that represents the main goal of our registered patent (No. PCT FI2016/050917, https ://encry pted.googl e.com/paten ts/WO201 71092 92A1?cl=no).
As the first proof of this concept, our results show that upon an increase in blood glucose concentration the skin in both healthy and type I diabetic mice takes up more glucose, suggesting that this takes place through an insulin-independent pathway. When looking for the mechanism underlying this increased uptake of glucose by keratinocytes we found that Glut-1 mRNA expression was significantly increased in the mice receiving d-glucose compared with the controls, and that Glut-1 mRNA expression was significantly higher in the type I diabetic mice than in the healthy mice, which may explain the higher skin glucose level. However, the (non significant) decrease in Glut-1 mRNA expression and protein levels observed in the d-glucose-injected type I diabetic mice compared to their controls may be explained by an auto-regulation of the glucose uptake via reduction in the expression of Glut-1, as previously shown24.
In view of our results showing that a high extracellular glucose concentration induces Trisk 95 expression at the protein as well as the transcriptional level, we propose Trisk 95 as a new biomarker for glucose in keratino-cytes. This result is a promising one obtained with our mouse model in which the injection of an edited Trisk 95-iPSC was shown to be feasible. Nevertheless, because of the ethical restriction on performing the same manip-ulation on humans, we thought that it was worth investigating the potential role of Trisk 95 in glucose signalling in keratinocytes in order to find the molecular signature in terms of outcomes extending beyond this signalling. Triadin is a key player in the functioning of the heart and skeletal muscles in that it regulates the excita-tion–contraction (EC) coupling process41,49–51. Moreover, it modulates intracellular calcium haemostasis via its
interaction with various proteins such as Junctin42, RYR 52,53 and CSQ54. Indeed, it has been shown that Triadin
regulates calcium release from the sarcoplasmic reticulum (SR) by binding directly to the RYR receptor in a specific domain55.
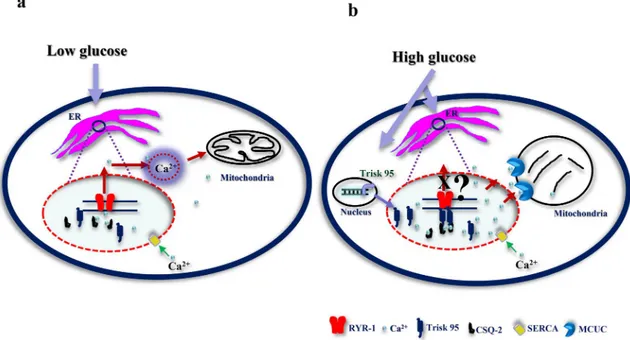
In view of its collaboration mechanism with RYR and CSQ, we testes whether their expression is modified under our conditions and looked at their expression in our mouse models. The results showed a significant increase in the RYR-1 mRNA level in both glucose-injected healthy and type I diabetic mice relative to their counterparts. Regarding CSQ-2 mRNA, its expression level was significantly increased in the glucose-injected type I diabetic mice (Supplementary Fig. 4a,b). Similar results were obtained from primary keratinocytes after 45 min of high glucose incubation (Supplementary Fig. 4c). On the other hand, the RYR-1 and CSQ-2 mRNA levels in Trisk 95 KO skin did not change in response to a high-glucose injection (Supplementary Fig. 4d). Com-bining our findings with others that demonstrate the essential role of Trisk 95 in muscle function, we propose a similar model for the mechanism by which Trisk 95 may play a potential role in orchestrating calcium signalling as a consequence to fluctuations in blood glucose concentration. In healthy individuals (blood glucose level ~ 5 mmol/l), Trisk 95 does not bind RYR-1 or CSQ-2 and a constant calcium leak from ER into the cytosol is maintained via the RYR-1 channels. Under those conditions, the cytoplasmic calcium is involved in physiologi-cal processes in the mitochondria. Under type I diabetic conditions, however, in which blood glucose levels are high (≥ 15 mmol/l), Trisk 95 is upregulated at both levels (mRNA and protein). Binding of the skin Trisk 95/ CSQ-2 complex to the RYR-1 channels leads to their closure and subsequently to increased ER calcium stores.
This increase in ER calcium eventually triggers modifications in the mitochondrial network and consequently in its optimal functioning. It is worth mentioning here that deeper investigations are needed to demonstrate the relationship between Trisk 95 and RYR channel activity.
Given that calcium signalling is a key regulator of mitochondrial behaviour56, we hypothesize that an increase
in intracellular and ER calcium may affect mitochondrial function. Our data obtained in vivo and in vitro indi-cate that mitochondria present a specific phenotype after high glucose in the skin of both healthy and type I diabetic mice. The mitochondrial phenotype could be attributable to calcium uptake resulting in mitochondrial damage57. The mitochondrial calcium uniporter complex is responsible for calcium uptake across the inner
membrane43,44,58,59, and in agreement with this, our data showed that the expression of MCU and MICU1 at the
mRNA level was significantly upregulated after high glucose in both healthy and diabetic mice.
Overall, our study highlights the rapid, dynamic physiological behaviour occurring in the skin and its primary keratinocytes in response to changes in blood glucose concentration. The data demonstrate for the first time that high blood glucose for 45 min induces the activation of a number of players that are cross-talking, leading to the activation of signalling cascades. Trisk 95 is shown to be an essential mediator in the interaction between these cascades and we proposes that the ensuing calcium or its mitochondrial metabolites can be used as indicators of blood glucose level in the skin.
Materials and methods
The animal care and experimental procedures in this study were in accordance with Finnish national legislation on the use of laboratory animals, the European Convention for the protection of vertebrate animal used for experimental and other scientific purposes (ETS 123), and the EU Directive 86/609/EEC. The animal experi-mentation was also authorized by the Finnish National Animal Experiment Board (ELLA) as being compliant with the EU guidelines for animal research and welfare.
Cell culture and glucose treatment.
Primary keratinocytes were isolated from the skin of 6–8-week-old mice as previously described (Supplementary ref. 1). Briefly, mice (C57/BL6) were sacrificed (by cervical disloca-tion) and the hair shaved from their backs. The skin was then sterilized by immersion in a beaker of 10% beta-dine for 2 min, in a beaker of 70% ethanol for 1 min and then in sterile Dulbecco’s phosphate (PBS) for 1 min. The skin samples were treated with trypsin for 2 h at 33 °C to separate the epidermis from the dermis. Keratino-cytes were cultured in F12 (21765-037)–DMEM (41965-062), medium, both from Thermo Fisher, supplemented with hydrocortisone (0.5 µg/ml), epidermal growth factor (EGF) and insulin (5 µg/ml), all from Sigma. The medium was changed three times a week. When the cultures reached 70–80% confluence the keratinocytes were incubated with two concentrations of d-glucose (G7021-Sigma) (5 mM + 20 mM mannitol (for osmolality)) or 25 mM for 45 min and then used for the various experiments.The type I diabetic mouse model.
Type I diabetes was induced after one single intraperitoneal (IP) injection of streptozotocin (STZ), as previously described36. One week before the experiment, all the mice werehoused in individual cages. On the day of the experiment, they fasted for 4 h and were then divided into two groups: controls and type I diabetic mice. The control mice were injected IP with Na citrate buffer (pH 4.5), while the type I diabetic mice were injected with STZ (150 mg/kg) diluted in Na citrate buffer to a total volume of 100 µl. The mice were diagnosed as diabetic when their blood glucose level was ≥ 15 mmol/l.
Figure 4. Keratinocytes exhibit a specific mitochondrial phenotype after high glucose treatment. (a) High
extracellular glucose leads to an abnormal mitochondrial phenotype in keratinocytes. After 45 min of incubation in the presence of a low or a high-glucose medium, cells were fixed, and sections were examined using a Tecnai Spirit G2 transmission electron microscope. Keratinocytes incubated with high glucose
demonstrated changes in the mitochondrial phenotype (swollen and enormous, round in shape, disarrangement of the cristae accompanied by partially or totally electron-lucent matrix) (red dotted circles); the normal mitochondria of different shapes (elongated or round) with well-arranged cristae and electron dense were observed in the cells incubated with low glucose (yellow dotted circles). Scale bar = 2 µm. (b) Quantification of the mitochondria confirms the histological observations. A significant increase in the abnormal mitochondria was noted in the cells incubated with high glucose (n = 45) compared with the controls (n = 51). (c) The mitochondrial network in the keratinocytes was visualized using MitoTracker staining. A neat mitochondrial network surrounding the nucleus was observed in the control cells, but a fragmented network presented itself in the cells treated with high glucose. (d) Quantification of normal and fragmented mitochondria in control cells (n = 328) and treated cells (n = 316). (e) The morphology of the mitochondria was assessed in the skin after the GTT test. Histological examination of the mitochondria from the skin of healthy and type I diabetes mice demonstrated abnormal morphology (red dotted circles) after glucose injection similar to that observed in the primary cells, while the majority of the mitochondria of the control mice in the healthy and type I diabetes groups were healthy in shape (yellow dotted circles). Scale bar = 1 µm. (f) Quantification of mitochondria in the skin. A significant increase in abnormal mitochondria was observed in the skin of both groups of healthy and type I diabetic mice injected with d-glucose (n = 42 cells for all groups except n = 35 cells for the type I diabetic mice injected with glucose) relative to their counterparts. One-way ANOVA multiple comparison was used for statistical analysis in (b) (*P < 0.03; **P < 0.004; ****P < 0.0001), (d) (**P < 0.001; ****P < 0.0001) and (f) (*P < 0.03; ***P < 0.0003; ****P < 0.0001).
Insulin measurement.
To determine the insulin concentration in the serum, blood samples were collected from the facial vein of the mice 45 min after the d-glucose injection. Serum was obtained after centrifugation at 3,500 rpm for 10 min at 4 °C and insulin was measured using the Insulin Rodent (Mouse/Rat) Chemilumines-cence ELISA kit (ALPCO) according to the manufacturer’s instructions.Glucose tolerance test.
For adaptation purposes, the mice were housed in individual cages for 1 week. Prior to the experiment the healthy and type I diabetic mice fasted overnight (12 h) and each group was then divided into two parts, yielding four groups in all: healthy and type I diabetic groups that were injected intra-peritoneally (IP) with PBS, and healthy and type I diabetic groups that were injected IP with d-glucose (2 g/kg). Blood glucose levels were monitored at 0, 5, 15, 30- and 45-min post-injection. After 45 min, all the mice were killed and skin samples were collected for the various experiments (RT-qPCR, western blotting and EM).All the animal procedures were performed in accordance with the European Convention (ETS 123), EU Directive 86/609/EEC and the Finnish national legislation, as approved by the local ethical committee.
Luciferase reporter assay.
The Triadin promoter region containing a 882 bp (chr6:123636957 + 123637838) DNA fragment was cloned into the pGL3 basic vector (Promega) upstream of the luciferase reporter gene. HaCat cells were seeded in a 96-well white plate at a concentration of 2 × 10⁴ in the presence of 100 μl DMEM (41965039gibco) medium supplemented with 10% FBS and 1% PS. 12 h later, the medium was replaced with 100 µl of DMEM-free serum supplemented with 1% PS containing 5 mM d-glucose + 20 mM d-mannitol or 25 mM d-glucose (Sigma). The cells were then immediately transfected with a promoter construct, negative and positive control plasmids (100 ng each) and an internal control plasmid pGL4.74 (40 ng) (Promega), using Turbofect (0.533 Thermofischer Scientific) as the transfection reagent according to the manufacturer´s protocol. The cells were incubated at 37 °C in 5% CO. Two days later the Dual-Glo Luciferase Assay System (E2940, Promega) was used to measure the luciferase activity of the cells on a bio-luminometer, following the manufacturer´s protocol.
To avoid interference from firefly luminescence, all the samples on the 96-well plate were measured before inducing renilla luminescence. All the readings were based on measurements obtained from at least three rep-licate wells. The change in the activity of each gene promotor was determined by measuring the activity of luciferase in the transduced keratinocytes incubated with high glucose (25 mM) versus those incubated with low glucose (5 mM). Statistical significance was analysed using the two-tailed Student’s t test. Each experiment was performed independently three times. The following primers were used for cloning the Triadin promoter region (882 bp):
Triadin-882-NheI-F CTA GCT AGC TTC TCC CCC TGG AAA CAACC Triadin-882-XhoI-R GTA CTC GAG CAC CTG TCT AGG AGT GG.
Proteomic analysis.
Details of the sample preparation, nano-scale liquid chromatographic tandem mass spectrometry analysis, database search, processing of the results and label-free quantitative data analysis are provided in the “Supplementary information” section.Western blotting.
Equal amounts of total protein were resolved by SDS-PAGE and electrophoretically transferred to nitrocellulose membranes (BioTop 741,280). The membranes were then incubated overnight at 4 °C with a 1:1,000 dilution of Trisk 95 (Supplementary ref. 2), Glut-1 (Supplementary ref. 3) 1:5,000 anti-GAPDH (MAB374, Millipore), 1:5,000 anti-β-actin (A5441, Sigma Aldrich). After treatment with peroxidase-linked antibody (Dako, polyclonal) for 1 h, blots were developed using the 20X LumiGLO® Reagent and 20 × Peroxide (Cell Signaling Technology, #7003).Figure 5. Trisk 95 KO rescues phenotype changes in both calcium and mitochondria in the skin and its
primary cells. (a) Calcium uptake after high glucose injection was assessed. The relative intensity of Fluo-4 staining was measured by flow cytometry. The results are presented as means ± SEM (n = 3 injected with PBS and n = 4 injected with glucose and 10,000 cells/mouse). (b,c) High glucose did not affect the mitochondria phenotype in Trisk 95 KO keratinocytes. Keratinocytes isolated from Trisk KO exhibited a normal mitochondrial phenotype (b), scale bar = 2 µm. Quantification of mitochondria confirmed the histological observation (n = 20) compared with the controls (n = 29) (c). (d,e) High glucose did not affect the mitochondrial phenotype of Trisk 95 KO skin. The majority of the mitochondria from the Trisk 95 KO basal keratinocytes represented a normal phenotype (red dotted circles), as also observed in the controls (yellow dotted circles) (d), scale bar = 2 µm. Quantification of the mitochondria in the skin injected with d-glucose (n = 158 cells) as compared with the controls (n = 132 cells) (e). (f) DMSO pre-incubation did not affect the mitochondrial phenotype brought about by high glucose. (g) BAPTA pre-incubation rescued the mitochondrial phenotype induced by high glucose in primary keratinocytes. (h,i,j) Effect of high glucose on mitochondrial uniporter proteins in the skin. MCU and MICU1 expression in the skin. mRNA expression levels of MCU and MICU1 in the skin of healthy (h), type I diabetic (i) and Trisk 95 KO (j) mice was examined using qRT-PCR. The results are shown as the averages after normalization to the controls ± SEM (n = 6/group). The two-tailed Student’s t-test was used in (a) (ns not significant P = 0.27), (g) (**P < 0.003, *P < 0.041), (h) (***P < 0.0002, *P < 0.012), (i) (*P < 0.042 and *P < 0.025) and (j) (*P < 0.035). One-way ANOVA multiple comparison was used in (c) (*P < 0.03; ***P < 0.0002), (e) (*P < 0.01; ****P < 0.0001), and (f) (****P < 0.0001; ***P < 0.0002; ***P < 0.0008). ◂
Measurement of glucose uptake and intracellular glucose consumption.
To evaluate glucose uptake or its intracellular concentration, we used the YSI 2950 Biochemistry Analyzer (YSI Life Sciences), which employs immobilized enzyme to catalyse the corresponding chemical reactions in order to measure the concen-tration of a specific metabolite. Briefly, to measure glucose uptake, keratinocytes were incubated in triplicate for 45 min in a 24-well plate in 1 ml of DMEM complete medium supplemented with glucose (5 mM or 25 mM). The concentration of glucose in the collected medium was evaluated by the YSI analyser using corresponding fresh medium as a reference.To measure intracellular glucose concentrations, skin samples were collected at different time-points after a glucose injection from the various groups of mice and then immersed in a hypotonic buffer (2.5 mM Tris/HCl, pH 7.5 and 2.5 mM MgCl2) on ice for 15 min, homogenized and then sonicated for 15 s. The concentrations of
glucose in the skin lysates were then evaluated. The data were expressed as mmol·μg−1 of protein.
Intracellular calcium imaging and measurement.
To image and measure intracellular calcium changes in vivo, primary keratinocytes were isolated and cultured in dishes with a glass bottom (35/10 MM, Greiner Bio-one International, 627,871) for 1 week. On the day of the experiment the cells were washed and incubated for 45 min in the presence of 5 mM d-glucose + 20 mM mannitol or 25 mM d-glucose. Then Fluo-4 AM (2 µM final concentration) (Thermo Fisher, F14201) was added directly to the medium and incubated for another 30 min at 37 °C. Changes in the intracellular calcium level was calculated by measuring the background-subtracted fluo-rescence signals (F1) and dividing these by the baseline signal (F0) before adding thapsigargin (Sigma, T9033) to a final concentration 100 nM. Zeiss Cell Observer Microscope (Carl Zeiss, Germany) in epifluorescence imaging mode was used to detect and measure the fluorescence of Fluo-4. The data were analysed and calculated by using Zen 2012 (Blue), the 2018 version of Origin and presented as means ± standard deviation.To assess calcium levels after GTT, keratinocytes were isolated from skin biopsies collected at 45 min and stained Fluo-4 AM was added to the medium and incubated in the dark for 30 min. After two washes with PBS, the cells were analysed by flow cytometry. Data from ten thousand individual cells were collected for each sample.
Immunostaining of cells.
To examine the expression of Trisk 95 and its localization in the primary keratinocytes, cells were cultured in dishes with a glass bottom for 45 min after treatment with two concentra-tions of glucose. They were then fixed in 4% paraformaldehyde (PFA) for 10 min at RT and incubated with blocking solution (10% BSA, TBST (Tris buffer saline-Tween) 0.1%) for 30 min. This was followed by a further incubation with the primary antibody anti-Trisk 95, as previously described (Supplementary ref. 2), diluted in the blocking solution for 1 h at RT and then with DAPI, and with a secondary antibody for 30 min. Fluorescence was detected using a confocal microscope (Zeiss LSM 780, Carl Zeiss, Germany).Figure 6. Proposed model for the mechanism by which high glucose triggers calcium uptake in the ER and
mitochondria via Trisk 95. Under normal conditions (low glucose) no binding occurs between Trisk 95 and RYR and the calcium level in the ER is thus maintained via constant exchange with the cytosol. The calcium level is important for the functioning of the mitochondria (a). In the presence of high glucose Trisk 95 is overexpressed at transcriptional and then protein level, leading to its binding to the RYR channel and resulting in the closure of the latter. As a consequence, the increased calcium store in the ER triggers mitochondrial changes because of calcium uptake via MCUC (b).
Transmission electron microscopy (TEM).
Skin biopsies were collected at 45 min post-injection from the four groups (three mice per group) after the GTT assay, and cultured cells were mounted on coverslips and fixed in 1% glutaraldehyde and 4% formaldehyde in 0.1 M phosphate buffer, pH 7.4. The remaining steps were followed as previously described (Supplementary ref. 4). Sections from the skin samples and cells were examined using a Tecnai Spirit G2 transmission electron microscope. Images were captured with a Veleta CCD camera and Item software (Olympus Soft Imaging Solutions GMBH, Munster, Germany).Statistical analysis.
GraphPad Prism software, version 7, was used for the statistical analyses. The one-way or two-one-way ANOVA test or the two-tailed Student t-test were employed and *P-values less than 0.05 were considered significant.Data availability
The data sets generated and/or analyzed during the current study are available from the corresponding author on request.
Received: 23 October 2019; Accepted: 3 July 2020
References
1. Talagas, M., Lebonvallet, N., Berthod, F. & Misery, L. Cutaneous nociception: role of keratinocytes. Exp. Dermatol. 28(12), 1466– 1469 (2019).
2. Kempeneers, D., Hauben, E. & De Haes, P. IgG4-related skin lesions: case report and review of the literature. Clin. Exp. Dermatol.
39, 479–483 (2014).
3. Rongioletti, F. & Caputo, V. Pancreatic panniculitis. G. Ital. Dermatol. Venereol. 148, 419–425 (2013).
4. Kuwahara, A. et al. Angiogenin expression in the sera and skin of patients with rheumatic diseases. Biosci. Trends 6, 229–233 (2012).
5. Fallon, J., Majeed, S., Adamali, H. & Gunawardena, H. Lesson of the month 2: dry skin, yellow nails and breathlessness. Clin. Med.
(Lond) 17, 371–372 (2017).
6. Htike, T. T., Mishra, S., Kumar, S., Padmanabhan, P. & Gulyas, B. Peripheral biomarkers for early detection of Alzheimer’s and Parkinson’s diseases. Mol. Neurobiol. 56, 2256–2277 (2019).
7. Lam, D. W. & LeRoith, D. The worldwide diabetes epidemic. Curr. Opin. Endocrinol. Diabetes Obes. 19, 93–96 (2012). 8. Quondamatteo, F. Skin and diabetes mellitus: what do we know?. Cell Tissue Res. 355, 1–21 (2014).
9. Aye, M. & Masson, E. A. Dermatological care of the diabetic foot. Am. J. Clin. Dermatol. 3, 463–474 (2002). 10. Bristow, I. Non-ulcerative skin pathologies of the diabetic foot. Diabetes Metab. Res. Rev. 24(Suppl 1), S84–S89 (2008). 11. Ge, X. et al. Detection of trace glucose on the surface of a semipermeable membrane using a fluorescently labeled glucose-binding
protein: a promising approach to noninvasive glucose monitoring. J. Diabetes Sci. Technol. 7, 4–12 (2013).
12. Vashist, S. K. Non-invasive glucose monitoring technology in diabetes management: a review. Anal. Chim. Acta 750, 16–27 (2012). 13. Vashist, S. K. Continuous glucose monitoring systems: a review. Diagnostics (Basel) 3, 385–412 (2013).
14. Bruen, D., Delaney, C., Florea, L. & Diamond, D. Glucose sensing for diabetes monitoring: recent developments. Sensors (Basel) https ://doi.org/10.3390/s1708 1866 (2017).
15. Choi, J., Ghaffari, R., Baker, L. B. & Rogers, J. A. Skin-interfaced systems for sweat collection and analytics. Sci. Adv. 4, eaar3921 (2018).
16. Currano, L. J. et al. Wearable sensor system for detection of lactate in sweat. Sci. Rep. 8, 15890 (2018).
17. Garcia, S. O. et al. Wearable sensor system powered by a biofuel cell for detection of lactate levels in sweat. ECS J. Solid State. Sci.
Technol. 5, M3075–M3081 (2016).
18. Cuartero, M., Parrilla, M. & Crespo, G. A. Wearable potentiometric sensors for medical applications. Sensors (Basel). https ://doi. org/10.3390/s1902 0363 (2019).
19. Wong, R., Geyer, S., Weninger, W., Guimberteau, J. C. & Wong, J. K. The dynamic anatomy and patterning of skin. Exp. Dermatol.
25, 92–98 (2016).
20. Kabashima, K., Honda, T., Ginhoux, F. & Egawa, G. The immunological anatomy of the skin. Nat. Rev. Immunol. 19, 19–30 (2019). 21. Li, W. et al. Signals that initiate, augment, and provide directionality for human keratinocyte motility. J. Invest. Dermatol. 123,
622–633 (2004).
22. Falanga, V. Wound healing and its impairment in the diabetic foot. Lancet 366, 1736–1743 (2005).
23. Hu, S. C. & Lan, C. E. High-glucose environment disturbs the physiologic functions of keratinocytes: focusing on diabetic wound healing. J. Dermatol. Sci. 84, 121–127 (2016).
24. Spravchikov, N. et al. Glucose effects on skin keratinocytes: implications for diabetes skin complications. Diabetes 50, 1627–1635 (2001).
25. Terashi, H., Izumi, K., Deveci, M., Rhodes, L. M. & Marcelo, C. L. High glucose inhibits human epidermal keratinocyte prolifera-tion for cellular studies on diabetes mellitus. Int. Wound. J. 2, 298–304 (2005).
26. Jeon, H. H. et al. FOXO1 regulates VEGFA expression and promotes angiogenesis in healing wounds. J. Pathol. 245, 258–264 (2018).
27. Blakytny, R. & Jude, E. The molecular biology of chronic wounds and delayed healing in diabetes. Diabetes Med. 23, 594–608 (2006).
28. Usui, M. L., Mansbridge, J. N., Carter, W. G., Fujita, M. & Olerud, J. E. Keratinocyte migration, proliferation, and differentiation in chronic ulcers from patients with diabetes and normal wounds. J. Histochem. Cytochem. 56, 687–696 (2008).
29. Sakai, S. et al. Characteristics of the epidermis and stratum corneum of hairless mice with experimentally induced diabetes mel-litus. J. Invest. Dermatol. 120, 79–85 (2003).
30. Okano, J. et al. Hyperglycemia induces skin barrier dysfunctions with impairment of epidermal integrity in non-wounded skin of type 1 diabetic mice. PLoS ONE 11, e0166215 (2016).
31. Lan, C. C., Wu, C. S., Huang, S. M., Wu, I. H. & Chen, G. S. High-glucose environment enhanced oxidative stress and increased interleukin-8 secretion from keratinocytes: new insights into impaired diabetic wound healing. Diabetes 62, 2530–2538 (2013). 32. Portugal-Cohen, M. & Kohen, R. Exposure of human keratinocytes to ischemia, hyperglycemia and their combination induces
oxidative stress via the enzymes inducible nitric oxide synthase and xanthine oxidase. J. Dermatol. Sci. 55, 82–90 (2009). 33. Lan, C. C. et al. High-glucose environment inhibits p38MAPK signaling and reduces human beta-defensin-3 expression [corrected]
in keratinocytes. Mol. Med. 17, 771–779 (2011).
34. Abdulrazak, A., Bitar, Z. I., Al-Shamali, A. A. & Mobasher, L. A. Bacteriological study of diabetic foot infections. J. Diabetes
35. Muller, L. M. et al. Increased risk of common infections in patients with type 1 and type 2 diabetes mellitus. Clin. Infect. Dis. 41, 281–288 (2005).
36. Zhu, S. et al. Wld(S) ameliorates renal injury in a type 1 diabetic mouse model. Am. J. Physiol. Renal Physiol. 306, F1348–F1356 (2014).
37. Shih, W. C., Bechtel, K. L. & Rebec, M. V. Noninvasive glucose sensing by transcutaneous Raman spectroscopy. J. Biomed. Opt.
20, 051036 (2015).
38. Wisniewski, N. A., Klueh, U. & Stenken, J. Interstitial fluid physiology as it relates to glucose monitoring technologies: symposium introduction. J. Diabetes Sci. Technol. 5, 579–582 (2011).
39. Samant, P. P. & Prausnitz, M. R. Mechanisms of sampling interstitial fluid from skin using a microneedle patch. Proc. Natl. Acad.
Sci. U. S. A. 115, 4583–4588 (2018).
40. Brandt, N. R., Caswell, A. H., Wen, S. R. & Talvenheimo, J. A. Molecular interactions of the junctional foot protein and dihydro-pyridine receptor in skeletal muscle triads. J. Membr. Biol. 113, 237–251 (1990).
41. Oddoux, S. et al. Triadin deletion induces impaired skeletal muscle function. J. Biol. Chem. 284, 34918–34929 (2009).
42. Zhang, L., Kelley, J., Schmeisser, G., Kobayashi, Y. M. & Jones, L. R. Complex formation between junctin, triadin, calsequestrin, and the ryanodine receptor. Proteins of the cardiac junctional sarcoplasmic reticulum membrane. J. Biol. Chem. 272(37), 23389–23397 (1997).
43. Kamer, K. J. et al. MICU1 imparts the mitochondrial uniporter with the ability to discriminate between Ca(2+) and Mn(2+). Proc.
Natl. Acad. Sci. U. S. A. 115, E7960–E7969 (2018).
44. Xing, Y. et al. Dimerization of MICU proteins controls Ca(2+) influx through the mitochondrial Ca(2+) uniporter. Cell. Rep. 26, 1203-1212.e4 (2019).
45. Marchi, S. et al. Mitochondrial and endoplasmic reticulum calcium homeostasis and cell death. Cell Calcium 69, 62–72 (2018). 46. Rieusset, J. The role of endoplasmic reticulum-mitochondria contact sites in the control of glucose homeostasis: an update. Cell.
Death Dis. 9, 1–12 (2018).
47. Guo, R., Gu, J., Zong, S., Wu, M. & Yang, M. Structure and mechanism of mitochondrial electron transport chain. Biomed. J. 41, 9–20 (2018).
48. Xie, L. L. et al. Mitochondrial network structure homeostasis and cell death. Cancer Sci. 109, 3686–3694 (2018).
49. Kirchhefer, U. et al. Transgenic triadin 1 overexpression alters SR Ca2+ handling and leads to a blunted contractile response to beta-adrenergic agonists. Cardiovasc. Res. 62, 122–134 (2004).
50. Roux-Buisson, N. et al. Absence of triadin, a protein of the calcium release complex, is responsible for cardiac arrhythmia with sudden death in human. Hum. Mol. Genet. 21, 2759–2767 (2012).
51. Shen, X. et al. Triadins modulate intracellular Ca(2+) homeostasis but are not essential for excitation-contraction coupling in skeletal muscle. J. Biol. Chem. 282, 37864–37874 (2007).
52. Goonasekera, S. A. et al. Triadin binding to the C-terminal luminal loop of the ryanodine receptor is important for skeletal muscle excitation contraction coupling. J. Gen. Physiol. 130, 365–378 (2007).
53. Lee, J. M. et al. Negatively charged amino acids within the intraluminal loop of ryanodine receptor are involved in the interaction with triadin. J. Biol. Chem. 279, 6994–7000 (2004).
54. Shin, D. W., Ma, J. & Kim, D. H. The asp-rich region at the carboxyl-terminus of calsequestrin binds to Ca(2+) and interacts with triadin. FEBS Lett. 486, 178–182 (2000).
55. Wium, E., Dulhunty, A. F. & Beard, N. A. A skeletal muscle ryanodine receptor interaction domain in triadin. PLoS ONE 7, e43817 (2012).
56. Szymanski, J. et al. Interaction of mitochondria with the endoplasmic reticulum and plasma membrane in calcium homeostasis, lipid trafficking and mitochondrial structure. Int. J. Mol. Sci. https ://doi.org/10.3390/ijms1 80715 76 (2017).
57. Giorgi, C., De Stefani, D., Bononi, A., Rizzuto, R. & Pinton, P. Structural and functional link between the mitochondrial network and the endoplasmic reticulum. Int. J. Biochem. Cell Biol. 41, 1817–1827 (2009).
58. Nemani, N., Shanmughapriya, S. & Madesh, M. Molecular regulation of MCU: implications in physiology and disease. Cell Calcium
74, 86–93 (2018).
59. Fieni, F., Lee, S. B., Jan, Y. N. & Kirichok, Y. Activity of the mitochondrial calcium uniporter varies greatly between tissues. Nat.
Commun. 3, 1317 (2012).
Acknowledgements
We thank Dr. D. Vicente for his help in performing the GTT and Dr. G. Bart for her assistance and helping in extracting RNA from the skin tissues. We thank Dr. I. Skovorodkin for his scientific advice, J. Kekolahti-Liias and P, Haipus for their excellent technical assistance in the laboratory, and S. Tausta for her expert assistance and advice concerning GTT and the type I diabetes mouse model. We thank Dr. I. Miinalainen for his help with imaging the mitochondria using electron microscope. We are also grateful to Dr. M. Kaakinen for the C2C12 cell line and to Prof. K. Hiltunen and Docent A. Kastaniotis for their help with the mitochondrial phenotype. This work was supported Academy of Finland Grants (251314, 315030, 307533, 206038, 121647), Finnish Cultural, Sigrid Jusélius and Finnish Cancer Research Foundations, the European Community’s Seventh Framework Pro-gramme Health (FP7/2007-2013) under Grant Agreement FP7-HEALTH-F5-2012-INNOVATION-1 EURenOm-ics 305608, and H2020-FETOPEN-2018-019-2020-01 projects MindGap GA 829040 and Gladiator (GA 828837).
Author contributions
N.A. and S.J-V. created the idea. N.A. designed the experiments. N.A. performed and analysed experiments. H.R-R. and W.M. performed and analysed experiments related to measuring the glucose uptake and consump-tion. D.M. performed western blot for both Glut-1 and Trisk 95. S.S. performed Trisk 95 promoter study. I.M. provided and helped in performing GTT test using Trisk 95 KO mouse model. V-P.R. helped in measuring the intracellular calcium level in keratinocytes. N.A. wrote the original draft of paper. S.J-V and H.R-R. edited the paper and improved it. All authors reviewed and edited paper.
Competing interests
The authors declare no competing interests.
Additional information
Supplementary information is available for this paper at https ://doi.org/10.1038/s4159 8-020-68972 -6.
Reprints and permissions information is available at www.nature.com/reprints.
Publisher’s note Springer Nature remains neutral with regard to jurisdictional claims in published maps and
institutional affiliations.
Open Access This article is licensed under a Creative Commons Attribution 4.0 International
License, which permits use, sharing, adaptation, distribution and reproduction in any medium or format, as long as you give appropriate credit to the original author(s) and the source, provide a link to the Creative Commons license, and indicate if changes were made. The images or other third party material in this article are included in the article’s Creative Commons license, unless indicated otherwise in a credit line to the material. If material is not included in the article’s Creative Commons license and your intended use is not permitted by statutory regulation or exceeds the permitted use, you will need to obtain permission directly from the copyright holder. To view a copy of this license, visit http://creat iveco mmons .org/licen ses/by/4.0/.