HAL Id: hal-01818205
https://hal.archives-ouvertes.fr/hal-01818205
Submitted on 18 Jun 2018
HAL is a multi-disciplinary open access
archive for the deposit and dissemination of sci-entific research documents, whether they are pub-lished or not. The documents may come from teaching and research institutions in France or abroad, or from public or private research centers.
L’archive ouverte pluridisciplinaire HAL, est destinée au dépôt et à la diffusion de documents scientifiques de niveau recherche, publiés ou non, émanant des établissements d’enseignement et de recherche français ou étrangers, des laboratoires publics ou privés.
Heat-aware metrics for computing modules
Laura Siso, Ramon Fornós, Assunta Napolitano, Jaume Salom, Georges da
Costa, Eugen Volk, Handrew Donoghue
To cite this version:
Laura Siso, Ramon Fornós, Assunta Napolitano, Jaume Salom, Georges da Costa, et al.. CoolEmAll D5.1 White paper on Energy-and Heat-aware metrics for computing modules. [Research Report] IRIT-Institut de recherche en informatique de Toulouse. 2012. �hal-01818205�
Project acronym: CoolEmAll
Project full title: Platform for optimising the design and
operation of modular configurable IT infrastructures and
facilities with resource-efficient cooling
D5.1 White paper on Energy- and Heat-aware
metrics for computing modules
Author: Laura Sisó, Ramon B. Fornós, Assunta Napolitano & Jaume
Salom (IREC)
Version: 1.4
Date: 28/12/2012
Deliverable Number: D5.1 Contractual Date of Delivery: 28/12/2012 Actual Date of Delivery: 28/12/2012
Title of Deliverable: White paper on Energy- and Heat-aware metrics for computing modules
Dissemination Level: Restricted
WP contributing to the Deliverable:
WP 5
Author: Laura Sisó, Ramon B. Fornós, Assunta Napolitano &
Jaume Salom (IREC)
Co-Authors: Georges Da Costa (IRIT), Eugen Volk (HLRS), Andrew
Donoghue (451G)
History
Version Date Author Comments
0.1 10/02/2012 A Napolitano (IREC) 1st Draft version.
0.2 02/03/2012 A Napolitano (IREC) 2nd Draft version.
0.3 21/03/2012 E. Volk (HLRS), G.
Da Costa (IRIT)
Integration of GPI-Overview and update on Equipment usage section.
0.4 21/03/2012 RB Fornós (IREC) 4th Draft version.
0.5 30/03/2012 RB Fornós (IREC) Addition of Financial metrics and minor corrections.
0.6 11/07/2012 RB Fornós (IREC) Reorganization of the document.
0.61 26/07/2012 RB Fornós (IREC) Reorganization of the document.
0.62 30/07/2012 G. Da Costa (IRIT) Characterization of applications.
0.7 14/09/2012 RB Fornós (IREC) Developing of metrics formulation, figures and schemes. Conception of aggregation of metrics. Minor corrections.
History
Version Date Author Comments
0.8 08/10/2012 Eugen Volk (HLRS)
Andrew Donoghue (451G)
Review of the Document.
0.9 23/11/2012 Laura Sisó (IREC)
G. Da Costa (IRIT)
Comments over 1st Review
Revision of formula of applications Extension of the document
according inputs from 1st Review Brussels 30th October.
1.0 30/11/2012 Laura Sisó (IREC)
Eugen Volk (HLRS)
Extension of contents. New chapters. New metrics. Selection of metrics.
1.1 06/12/2012 Laura Sisó (IREC)
G. Da Costa (IRIT)
Changes accepted according telco-meeting of 04/12/2012 and minor extension of contents.
1.2 12/12/2012 Ariel Oleksiak
(PSNC)
Eugen Volk (HLRS) Micha von der Berge (Christmann) G. Da Costa (IRIT) Juan Luis Prieto (ATOS)
Laura Sisó (IREC)
New metric DPPE. Table of sensors.
Table of selected metrics.
Update of chapter about metrics selection.
Refinement on some metrics definition.
1.3 20/12/2012 Eugen Volk (HLRS)
Andrew Donoghue (451G)
Laura Sisó (IREC)
Quality review improvements
1.4 21/12/2012 Ariel Oleksiak
(PSNC)
Laura Sisó (IREC)
Last review. Minor changes on chapter 7.4.1 2) to avoid redundancy
Approval
Abstract
This deliverable provides a set of selected metrics to assess the energy efficiency of the different Data Centre Efficiency Building Blocks (DEBBs). It also addresses the requirements of the Work Packages where these metrics can be used, which are the SVD Toolkit (WP2), ComputeBox Prototype (WP3), the Workload and Resource Management Policies (WP4), the Validation Scenarios (WP6) and the Dissemination activities (WP7). It’s a fact that some of the aspects that CoolEmAll has to evaluate for a correct energy efficiency assessment on data centres and its components, are not covered by the existing metrics. Some other metrics are redundant or irrelevant for CoolEmAll. Therefore the project not only includes a review of useful metrics but also attempts to define new ones where possible.
This White Paper, in one hand collects the present state of the art about metrics for data centres and on the other hand establishes a first selection of metrics for CoolEmAll purposes. However, the assessment and checking of the metrics with Validation Scenarios (WP6) will permit to refine these metrics definition and conclude with a useful selection that will be reported on D5.6
Keywords
Metric, Data centre Efficiency Building Block (DEBB), Boundaries, Energy efficiency assessment, Watts, Kilowatthour, Temperature, Heat-aware, Performance, Applications, Productivity, Power Usage Effectiveness (PUE), partial PUE, PUE Scalability, Deployment Hardware Utilisation Ration (DH-UR), Space-Watt-and-Performance (SWaP), Data Centre Utilisation (DCU), Data Centre Infrastructure Efficiency (DCiE), Data Centre Density (DCD), Energy Efficiency Ratio (EER), Fixed to Variable Energy Ratio (FVER), Primary Energy Balance, Carbon emissions balance, GEC (Green Energy Coefficient), Carbon Usage Effectiveness (CUE), Water Usage Effectiveness (WUE), Global KPI of Energy Efficiency (KPIEE), Data centre performance per energy (DPPE), Payback return, Return of
Table of Contents
1 Introduction ... 10
2 Energy uses in data centres ... 11
3 Classification of metrics ... 16
3.1 Metric general description ... 16
3.2 Metrics requirements ... 16
3.2.1 General requirements ... 16
3.2.2 CoolEmAll requirements ... 17
3.3 Data centre boundaries ... 20
3.3.1 General description of boundaries in data centres ... 20
3.3.2 Metrics classification in GAMES ... 23
3.3.3 New boundaries proposal ... 25
3.4 Metrics classification in CoolEmAll ... 29
4 Definition of metrics ... 31 4.1 Node Level ... 31 4.1.1 Resource Usage ... 31 4.1.2 Power-based metrics ... 33 4.1.3 Energy-based metrics ... 36 4.1.4 Heat-aware metrics ... 36 4.2 Node-Group Level ... 38 4.2.1 Resource Usage ... 39 4.2.2 Power-based metrics ... 42 4.2.3 Energy-based metrics ... 43 4.2.4 Heat-aware metrics ... 44 4.3 Rack Level ... 47 4.3.1 Resource Usage ... 47 4.3.2 Power-based metrics ... 47 4.3.3 Energy-based metrics ... 49 4.3.4 Heat-aware metrics ... 50
4.4.1 Resource Usage ... 55 4.4.2 Power-based metrics ... 55 4.4.3 Energy-based metrics ... 61 4.4.4 Heat-aware metrics ... 67 4.4.5 Green metrics ... 71 4.4.6 Financial metrics ... 76 4.5 Application Level ... 79 4.5.1 Power-based metrics ... 79 4.5.2 Energy-based metrics ... 82
5 Tendencies on metrics standardisation ... 85
6 Gaps on existing metrics and new proposals from CoolEmAll ... 87
7 Selection of metrics for CoolEmAll ... 89
7.1 Summary of metrics ... 89
7.2 Interrelation of metrics ... 91
7.3 Measurement sensors ... 99
7.4 First selection of metrics for CoolEmAll ... 101
7.4.1 Selected metrics for the assessment of physical testbed scenarios .... ... 104
7.4.2 Selected metrics for the assessment of workload simulation results ... ... 107
7.4.3 Selected metrics for the assessment of CFD simulation results: ... 108
8 Conclusions ... 110
9 References ... 112
Table of Tables
Table 3-1 Critical Environment Teams concerning data centres [19] ... 17
Table 3-2 Relation between GAMES’ layers and CoolEmAll’s boundaries ... 28
Table 4-1 Weighting factors for different energy sources ... 53
Table 4-2 Example of energy and productivity values ... 65
Table 7-1 Summary of metrics collected in the present report (node and node-group level) ... 89
Table 7-2 Summary of metrics collected in the present report (rack, data centre and application level) ... 90
Table 7-3 Sensors on the test bed ... 99
Table 7-4 Measurements by applications ... 100
Table 7-5 Simulated values ... 100
Table 7-6 Metrics selected at node, node-group and rack level ... 102
Table 7-7 Metrics selected at data centre level ... 103
Table of Figures
Figure 2-1 Simple schematic with the key data centre subsystems [12] ... 12Figure 2-2 Representative Energy End Use Breakdown [13] ... 13
Figure 2-3 Benchmarking examples [13] ... 13
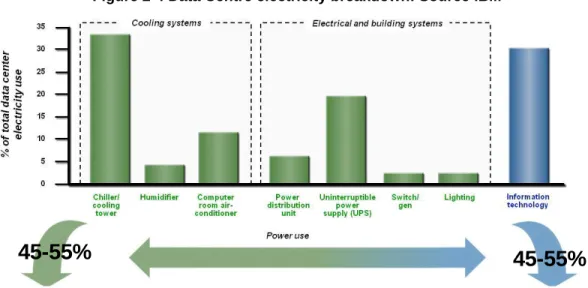
Figure 2-4 Data Centre electricity breakdown: Source IBM ... 14
Figure 2-5 Data Centre electricity breakdown: Source APC ... 14
Figure 2-6 Data Centre electricity breakdown: Source Google ... 14
Figure 2-7 Data Centre electricity breakdown, taking into account low utilisation [17] ... 15
Figure 3-1 Data centre Electricity Flow and Metric Measurement Points: Source Uptime Institute ... 20
Figure 3-2 Energy use boundaries for Dedicated Data centres and Mixed-Use Data centres ... 21
Figure 3-3. Data centre control volume. Source: IREC based on [25] [24] ... 22
Figure 3-4 Classification of metrics in GAMES project [26] ... 24
Figure 3-5 Major boundaries of a data centre for the assessment of metrics: Source IREC ... 26
Figure 3-6 Components within boundaries in data centre: Source IREC ... 28
Figure 4-1 CPU Power vs Server Usage: Source IREC ... 35
Figure 4-2 Example of use of NCI: Source IREC ... 37
Figure 4-3 DEBBs hierarchy according the monitoring system TIMaCS [29] ... 39
Figure 4-4 Aggregation methods for Server Usage metrics from Node to Node-Group level: Source IREC ... 41
Figure 4-5 Weighted energy balance in data centres: Source IREC ... 54
Figure 4-6 Total power variation versus IT load variations: Source [28] ... 59
Figure 4-7 Comparisson between DCiE and PUE: Source APC ... 60
Figure 4-8 Different cases of data centre total surface calculation: Source IREC ... 61
Figure 4-9: FVER Values [44]. ... 64
Figure 4-10 FVER evaluation example: Source IREC ... 66
Figure 4-11 Example of racks grouping: Source IREC ... 68
Figure 4-12 Data centre air mass flows [45] ... 69
Figure 4-13 Breakdown of the TCO cost components for a typical rack in high availability 2N data centre [61] ... 77
Figure 4-14 Annualized cost by component as a fraction of the total [60] ... 77
Figure 4-15 Using of APF#7 comparing two management policies ... 82
Figure 7-1 Interrelation of Resource Usage metrics between layers: Source IREC ... 93
Figure 7-2 Interrelation of Power-based metrics between layers: Source IREC . 94 Figure 7-3 Interrelation of Energy-based metrics between layers: Source IREC 95 Figure 7-4 Interrelation of Heat-aware metrics between layers: Source IREC .... 96
Figure 7-5 Interrelation of Green metrics between layers: Source IREC ... 97
1
Introduction
The awareness of significant data centres energy footprints and the increase in energy prices have stimulated investigations into possible metrics to define and quantify the energy efficiency of data centres. A first step towards this direction was taken by the Uptime Institute in 2003 with the introduction of the Triton Coefficient of Effectiveness, defined as the total utility energy required for operating a data centre divided by the critical electrical load in the computer room [1]. Up to this date, the only point of view was the one of raw performance, defined by simple metrics such as Operation per second [2] or Request per second [3]. Since then, the urgent need of establishing energy efficiency evaluation methodologies pushed most of the important players in the field to set own metrics, leading to the advent of several figures. Among them, the PUE (Power Usage Effectiveness) [4] has been widely adopted since 2007, with the support of The Green Grid institution. Actually the wide adoption of PUE has resulted in a corresponding common understanding or a shared calculation methodology for PUE. Only in 2010 did several organizations joined their efforts in a taskforce to agree on standard approaches and reporting conventions for key energy efficiency metrics [5].
The CoolEmAll project wishes to contribute to a common understanding of existing metrics towards the establishment of a consistent approach for the energy evaluation of a data centre from the points of view of infrastructure, equipment and applications. To this end, a review of existing metrics has been done and an overview on energy uses in data centres is outlined in this report.
2
Energy uses in data centres
At the CeBit forum 2008 in Hannover, some estimates were published proclaiming that in 2005 worldwide data centres needed the equivalent of 17 power plants of 1GW to power the required servers and their infrastructure such as cooling [6]. This use was estimated to grow at a rate of 17% a year, and this rate seems to increase as well. A study made by Gartner [7] shows that data centres account for 0.5% of global CO2 emissions, a quarter of the whole ICT
production, being on a par with the aviation industry but rising at a faster pace. First alarms on consumption in data centres came in 2007, when the EPA (Environmental Protection Agency) published a report assessing the energy used by government, commercial servers and data centres in the U.S. on the basis of best publicly available data [8]. The main energy use relates to electricity, being the driving energy of IT equipment and thereby the energy carrier mostly used for providing auxiliaries services as well, such as cooling.
As of 2006, the electricity use attributable to the nation’s servers and data centres was estimated at about 61 billion kWh, or 1.5% of total U.S. electricity consumption. Compared with year 2000 data, this electricity use was estimated to have more than doubled. Such estimation called a higher and higher attention to data centres energy footprint, as long as needs for digital services were documented to increase in a wide range of business fields, from industries to universities, from governmental institutions to banks, and for both applications types computing and storage [8].
Such a trend is documented in Europe as well [9] and still visible nowadays. According to the last annual survey carried out by the Digital Realty Trust on 205 European enterprise sized companies (€650M/£600M+ or more in revenues and/or 2,000 total employees), an average enterprise company has three data centres in operation and 83% of reporting companies indicated that they definitely/probably would expand their data centre capacity in 2011 [10]. Also projections foresee an increasing in the data centres consumption unless specific energy efficiency measures are implemented [8] [11].
The high electricity consumption in a data centre is not only due to the specific IT power demand but also to the long operation time, due to the fact that data centres are expected to run 24 hours per day and all over the year, including the supporting systems necessary for its operation. So data centres energy demand has been considered belonging to two groups (Figure 2-1).
IT loads: Relevant to the IT equipment, namely servers, storage and network equipment.
Building load (referring to the supporting systems): relevant to the mechanical and electrical systems that support the IT.
Figure 2-1 Simple schematic with the key data centre subsystems [12]
Typically only about half the power entering the data centre is used by the IT equipment [8]. The rest is used in the IT operation supporting facilities. Such a percentage actually varies in data centres according to the computing load intensity and the efficiency of the mechanical and electrical systems. The usual electricity breakdown in a data centre derived from a study carried out on 14 data centres is shown in Figure 2-2 [13]. Nevertheless, percentages can largely vary as shown in Figure 2-3 where the case on the left utilised a highly efficient system that was designed using best practices with better than standard HVAC (Heating, Ventilation and Air Conditioning) components and controls. The centre represented by the chart on the right utilised traditional distributed air-cooled CRAC (Computer Room Air Conditioners).
Figure 2-2 Representative Energy End Use Breakdown [13]
Figure 2-3 Benchmarking examples [13]
More recent data confirm the general breakdown attributed to the IT equipment, HVAC system and UPS (Uninterruptable Power System) the larger electricity uses (
Figure 2-4 Data Centre electricity breakdown: Source IBM
Figure 2-5 Data Centre electricity breakdown: Source APC
Figure 2-6 Data Centre electricity breakdown: Source Google
When accounting for the energy uses in IT equipment, servers demand high energy than storage and network does, being the CPU (Central Processing Unit) the most energy consuming component [14]. It has to be highlighted that the power provided to a server is not fully used for providing IT work, as shown in Figure 2-7. In fact, the power feeding a server is used for a large number of operations like powering memory, disks or the motherboard [15] [16].
Figure 2-7 Data Centre electricity breakdown, taking into account low utilisation [17]
The energy uses in data centres have been herein documented to identify the main energy consuming system for which it is necessary to define a minimum set of metrics.
3
Classification of metrics
This section explains the justification of choosing a concrete classification of metrics which best-fit the goals of CoolEmAll. The result of this justification process drives the selection of a particular way of classifying and selecting metrics useful for CoolEmAll.
3.1 Metric general description
In 2005 Herrlin defined how to develop be a good cooling index [18]. This is a good starting point to obtain guidelines on the selection of existing data centre metrics. From such approach we can extract a general view about what should be a suitable and useful metric for CoolEmAll.
Treat energy performance and “green” aspects of the data centre, which ideally should depend on the geographic location.
Be defined in a precise and accurate way, indicating how they must be measured in terms of measuring point location and time frames.
Be measurable in such as CFD (Computational Fluid Dynamics) models as testbed as real data centres.
Be simple and easy understandable for data centre industry. Be suitable for comparison between different data centres. Be suitable to be represented graphically.
Other desirable features of such a metric would be: Be dimensionless.
Content the target value. E.g. PUE target value is 1, and it is also the lower value possible.
3.2 Metrics requirements
3.2.1 General requirements
As result of the analysis of the data centre literature, most metrics were initially defined on a power basis: they could be easily related to the equipment features declared by the manufacturers and be used to assess the data centre in the design phase on peak power capacity. A peak power based metric can then be used to evaluate the investment. Any improvement of such a metric is then reflected in a diminishment of the investment costs: for this reason so defined metrics are more interesting for the data centre owner [19].
The increasing sensitivity about energy consumption has moved the attention from the design/peak power data to the operation data. Of course also during the operation it is possible to obtain power-based metrics. Nevertheless instantaneous power at a data centre varies over time in a cyclic fashion 50 to 60
times a second [20]; thereby a correct evaluation would require an average power which is derived by measuring energy use over a period of time and then dividing by that time period. The energy-based metrics quantify the energy carriers used in a data centre and they enable an estimation of the operating cost and also equivalent emissions, which is the core of the “Green” concept.
With the increasing awareness of the importance of both the power and energy based metrics, metrics initially defined in terms of power have been then extended to energy based metrics, like in the case of PUE for which it is recommended to use annual energy consumption for all energy types as the unit of measure [21].
The Uptime Institute groups the energy and power efficiency metrics for a green data centre into four categories addressing different functions and responsibilities (Table 3-1). This state of the art will mention the stakeholders for different metrics but without addressing specific functions within an enterprise. Hereby a higher importance is attributed to different levels of detail in metrics as they require different measurements effort. Nevertheless efficiency metrics can be defined within each area, reaching the level of detail of single energy systems efficiency and applications. The CoolEmAll approach will go in deep with metrics review and definition in both the areas, addressing onsite generation efficiencies, RES (Renewable Energy Source) utilisation, heat reuse, IT operational utilisation and work productivity in line with the latest development in the field [22].
Table 3-1 Critical Environment Teams concerning data centres [19]
3.2.2 CoolEmAll requirements
Before we identify metrics concerning energy-awareness and heat-awareness in data centres, firstly the project needs are herein identified. In that way, the energy efficiency characterisation of the DEBBs (Data centre Efficiency Building
capacity of the data centre on different levels of granularity. In addition it requires information about the behaviour of several components and sets of components within the data centre under specific conditions. This is also required by the energy efficiency characterisation of applications and workload schedulers. The workload is understood as a set of jobs, ranging from single sequential jobs, through parallel and distributed jobs, up to the whole workflows containing time dependencies between them. The energy consumption may vary for a given application, depending on the workload configuration (sequential jobs vs. parallel, etc.) and also on other characteristics like the size of the jobs. Therefore the workload is not directly measurable and must be understood as a set of factors that determines the energy consumption of the IT equipment (as a result of workload execution) and consequently on the supporting systems.
Characterisation of the data centre types according the service they provide it is also required to identify the measurable work that addresses indirectly to the productivity of a data centre. This concept is widely known in the industry as the useful work produced in a data centre. Here is remarked the definition of proxy indicator introduced and developed by The Green Grid resulting on a list of methods of measuring indirectly the useful work in a data centre [20]. In that way, CoolEmAll has identified the following data centre types regarding the services provided and what is understood as useful work:
HPC (High Performance Computing): FLOP or the number of floating-point operations.
Cloud: Number of service invocations. General-purpose: Number of transactions.
Applications have a particular role concerning metrics. This role is symmetric as metrics can be used to evaluate applications, but at the same time, several metrics use applications (usually called benchmarks) to provide insight on other levels of the infrastructure. As an example, HPC centres are usually evaluated using the Linpack benchmark that provides an evaluation of the maximum floating point possibilities of a super-computer. In this part the focus is rather on evaluating application, not on using application for evaluation. Metrics concerning productive applications will be described, then metrics concerning the runtime environment.
In this case metrics are used to compare several applications or libraries given a fixed infrastructure. This field is comparable with classical performance evaluation of application, the difference being that usually physical resource usage (processor load, memory, etc.) is put in second to energy.
In this case, comparison between several application and libraries with the same goal is often achieved using “energy-to-solution”. It was demonstrated how to use energy-to-solution to compare and choose linear algebra kernels [23]. This metric is adaptable for HPC and Clouds systems which are the aims of CoolEmAll. For HPC, usually energy-to-solution is used for obtaining a final result, i.e. total
energy needed to compute a weather forecast. For Clouds, usually it is used at a finer granularity: energy-per-request.
The main limit of current approaches is their non-holistic and non-temporal approach. Usually energy-to-solution refers only to the energy of computing elements. In CoolEmAll, a more holistic approach taking into account also cooling and other energy consuming devices is proposed. Even more problematic is the non-temporality as two applications with different power profiles can have the same energy-to-solution. A parallel application consuming a constant power on all nodes and during the whole experiment will be completely different for the cooling infrastructure than another consuming the same total energy, but concentrating the power consumption on a few nodes during a limited time. The difficulty lies in being able to express such a diversity of power profiles in a simple mean.
Metrics concerning middleware evaluate how by using possible leverages (scheduling, DVFS, sharpshooting, switching off nodes, etc.) they either achieve energy reduction with reduced impact on performance, or reduce performance and productivity when subject on power or energy limits.
Depending on fields, middleware has to manage several types of performance and productivity. In HPC it usually means maximum and mean completion time, and delay. In clouds, it usually means delay and maximum and mean time-to-solution. For clouds it is usually expressed as SLA (Service Level Agreement) violations.
For middleware we extract three types of metrics:
Fixed performance: These metrics evaluate the energy gains compared to doing nothing while having no impact on performance or productivity. Fixed power: These metrics evaluate the maximum performance or
productivity reached with a constrained instantaneous budget.
Mixed objective: Usually a Pareto function of power/energy and performance/productivity. It helps evaluate the middleware capacity of decision in complex environment.
Current middleware metrics have the same type of limits as application ones. There is a lack of temporal and temperature vision. For instance, a middleware that tries to limit the imbalance of heat dissipation is not, using current metrics, seen as better than one that do not take this into account.
3.3 Data centre boundaries
3.3.1 General description of boundaries in data centres
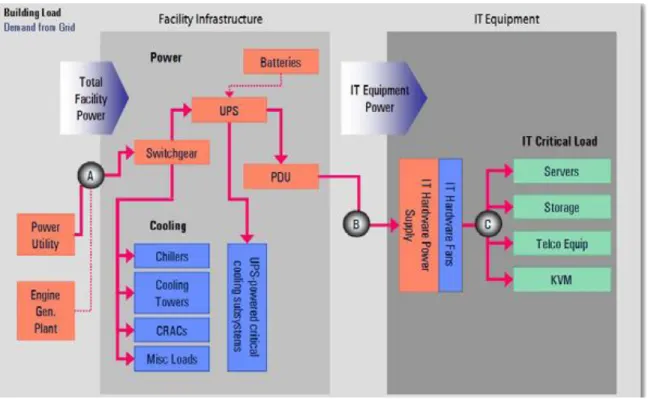
In order to identify possible needs for new metrics and to establish consistent efficiency evaluation approaches, it is useful to clearly define the boundaries, going much more in detail with respect to Figure 2-1. Once the physical boundaries are set, the energy streams used for different purposes can be easily identified, enabling the definition of metrics, such as in the example proposed by the Uptime Institute that actually considers the only electricity flows (Figure 3-1). Usually there is a distinction between:
IT Equipment that mainly includes servers, storage, network and hardware fans.
Data centre Facility Infrastructure that mainly includes the HVAC facilities and the power facility. The HVAC facilities include the cooling system, ventilation system and auxiliaries such as distribution pumps, valves and power facility by power generator, UPS (Uninterruptable Power System), PDU (Power Distribution Unit), batteries and switchgears.
Figure 3-1 Data centre Electricity Flow and Metric Measurement Points: Source Uptime Institute
Such a distinction is visible in Figure 3-1 developed by the Uptime Institute to point out the measurements points for the definition of metrics. It can be noted
that any power generation system available on site is not included within the facility infrastructure. Its energy use is not accounted but its electricity supply to the facility infrastructure. The rationale behind this is that it is not of interest how the electricity is produced but only how it is used within a data centre and such an approach is not coherent with any energy efficiency assessment and improvement. Here some key points need to be pointed out:
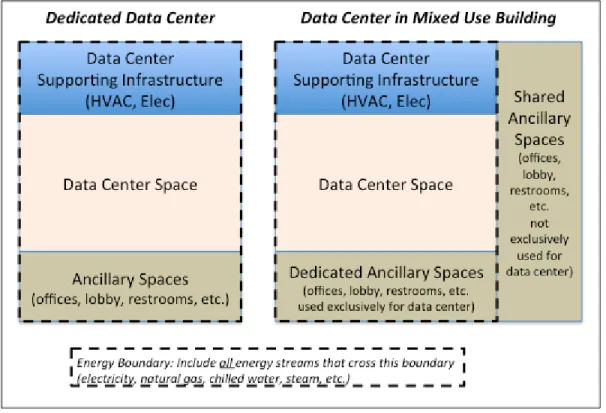
Last developments on metrics [21] differentiate between: o Dedicated Data centre as a free-standing building.
o Mixed-Use Data centre with dedicated supporting systems. The data centre is within a larger building that has other uses, but the data centre has dedicated HVAC and electrical systems.
Figure 3-2 Energy use boundaries for Dedicated Data centres and Mixed-Use Data centres
Such an approach (Figure 3-2) apparently mixes physical spaces, like the ancillary spaces, and energy use areas like the data centre supporting infrastructure. A CRAC unit is a data centre supporting system but can be still part of the data centre space. Indeed, for the evaluation of data centre efficiency it is only necessary to account for the energy which is produced by shared systems but used for purposes not related to the data centre operation, e.g. electricity use for lighting the main building or heating use and so on.
The RES power systems like solar and wind are considered as part of external utilities according to the Data Centre Efficiency Task Force [21] and Global Taskforce [24] Their energy provision is accounted as produced from the grid, even if on site built and dedicated to the data centre. The environmental benefit of RES is related with the property of Certified Green Credits instead of the concept of on-site generation and consumption or exportation to the network. The environmental benefit of RES, in other fields, are related with the concept of on-site generation and consumption, that contributes to minimize the related CO2 emissions and
primary energy consumption of electricity that comes from the grid. In that sense, it is relevant to define the boundaries of the building (or data centre) and the energy flows with the surroundings.
When talking of energy reuse, also in case of data centres, relevant efforts are going on to clearly define these boundaries and the control volume to measure the metrics [25], [24]. The following schema shows the concepts introduced by The Green Grid and endorsed by Global Task Force.
Figure 3-3. Data centre control volume. Source: IREC based on [25] [24]
Data Center Control Volume Utility Cool UPS PDU ICT e.g. greenhouse rejected Electricity Rejected heat Cooling Measurement points
3.3.2 Metrics classification in GAMES
The classification proposed by the GAMES project classifies metrics, also called GPI (Green Performance Indicators) in four clusters according Jiang [26] and Kipp et al. [27]:
IT Resource Usage GPIs: They characterise the IT resource usage of applications and their environment. The energy consumption of an application service is characterised as a function of resource utilisations by a given application service, whereas resources refer to CPU, Memory, I/O, Storage, etc. Their utilisation can be measured on various level of granularity and the values on higher levels can be obtained as a sum or the average value of the according lower level measurements.
Application Lifecycle KPIs (Key Performance Indicators): Application Lifecycle indicators are not considered as GPIs as they do not directly impact the greenness or energy consumption of a data centre. This kind of indicators is a measure of performance of an application by characterizing service or process quality and efforts for designing and maintaining the process. The characterisation of service or process quality is done according to KPI, defined as a set of indicators that evaluate the quality measures of an application. In addition, the characterisation of effort for designing and maintaining the process can be expressed in terms of costs, reflected by Application Cost Indicators, including costs for analysis, design, coding, deployment and maintenance [26].
Energy Impact GPIs: They describe the impact of a data centre on the environment considering power supply, consumed materials, emissions, and other energy related factors. It includes productivity and performance of data centres at any level of granularity.
Organizational GPIs: They define the energy-related metrics that measure organisational factors in terms of impact on the infrastructural costs and serve as guidelines for managing data centres according to ecological related laws and regulations.
The metrics identified in the GAMEs project are presented in a interrelation diagram shown in Figure 3-4. In this proposal four layers are identified: These are Compute Node, Application, Facility and Organisation as the highest layer. The relationship between the GAMES classification of metrics and CoolEmAll approach are discussed in sections 3.3.3 and3.4.
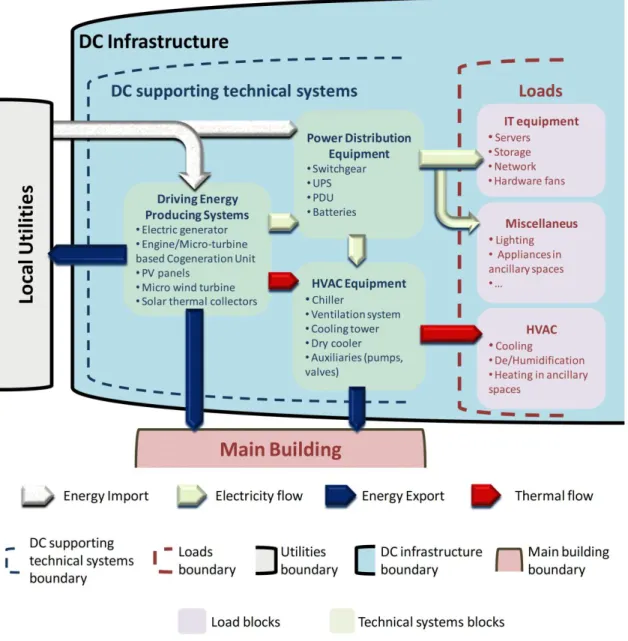
3.3.3 New boundaries proposal
In a future perspective of energy producing buildings, relying on renewable sources or high efficient systems, the data centre supporting systems actually includes three categories of facilities: energy producing systems, power distribution equipment and HVAC equipment, as shown in Figure 3-5.
The IT Equipment includes all the loads associated with computing, storing, networking and supplemental equipment such as KVM switches, monitors, and workstations/laptops used to monitor or otherwise control the data centre. Whereas the Total Facility includes:
Power delivery components, such as UPS, switch gear, generators, PDUs, batteries, and distribution losses external to the IT equipment;
Cooling system components such as chillers, CRAC units, DX (direct expansion) air handling units, pumps, and cooling towers.
Compute, network, and storage nodes.
Other miscellaneous component loads such as data centre lighting
In fact, in a so called “Green Data Centre”, highly efficient or renewable sources driven on-site energy supply systems are probably going to be adopted, such as cogeneration unit, PV (Photovoltaic) panels or solar thermal surfaces. Thereby a wider group of technologies is interposed between the local grids from which the driven energy carriers are imported, like gas for a cogeneration unit, and the equipment which receive the energy from the supply systems before feeding it into the IT equipment. Such technologies can support the data centre operation by supplying electricity but also heat for cooling purposes, like in the case of tri-generation or solar cooling systems. Hence the scheme in the Figure 3-5 takes into account all the energy carriers flowing within a data centre infrastructure and the energy export as well.
Some of the energy supply systems supporting the data centre operation can export energy to the utility or can be shared with the main building where the data centre is installed. For an accurate energy efficiency evaluation of the data centre, it is needed to take into account the energy export towards the grid or the main building, especially when some energy carrier is used to run the supply systems. For instance in the case of a gas driven cogeneration unit, it is needed to subtract the amount of gas corresponding to the electricity and the heat exported to local grids or to the main building.
Figure 3-5 Major boundaries of a data centre for the assessment of metrics: Source IREC
The Figure 3-5 is not in contradiction with the system boundaries usually referred in the literature [1] [21] and within the established bodies working on metrics definition and standardization as for instance, U.S. Regional Task Force, Global Task Force [24] or The Green Grid [28]. There is still no standard about boundaries definition on data centre. It is expected that the EN 506001 standard series addressing the design of Data Centre facilities and infrastructures partly based on the criteria of energy efficiency will consider these issues. The first
1
Standard developed by CEN-CENELEC. European Committee for Electrotechnical Standardisation
version of the standard has been ratified (September 2012), but is not yet available.
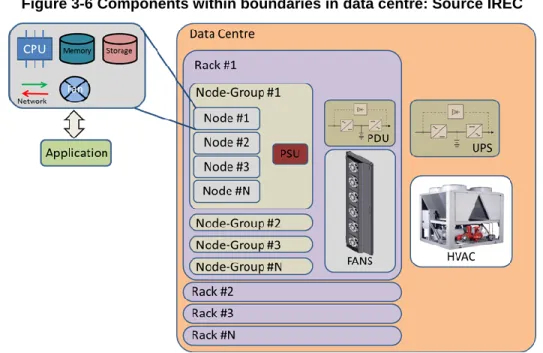
However, for CoolEmAll purposes, a deeper approach must be done rather on what is defined as the “Loads” boundary in Figure 3-5. In the mentioned figure and leveraging the DEBBs concept [29], it must be defined more levels of granularity differentiating the Node Level and the Node-Group Level both composed by typical IT hardware components. Here it can be noted that the Rack Level cannot be include on this “Loads” boundary due to it includes optionally elements from the “Data centre supporting technical systems” boundary like an rackable UPS and a water-cooled heat exchanger. Keeping on the Figure 3-5 the Data centre Level is coincident with “Data centre Infrastructure” boundary. At this point a definition of what includes physically the different DEBBs is necessary and given then.
Node: A motherboard with CPU, cooling elements (including Fan), memory and optionally storage.
Node-Group: An aggregation of Nodes in a common bus and including the PSU (Power Supply Unit).
Rack: An aggregation of Node-Groups not necessarily in a common bus but placed in a single rack which optionally can include a heat exchanger and a UPS.
Data Centre: The aggregation of Racks with HVAC systems, Power Distribution Equipment and Driving Energy Producing Systems as defined in Figure 3-5.
The components included in each boundary are represented in the Figure 3-6.
Figure 3-6 Components within boundaries in data centre: Source IREC
The relation of this proposal of boundaries with the layered GPIs in GAMES project is shown in Table 3-2.
Table 3-2 Relation between GAMES’ layers and CoolEmAll’s boundaries
GAMES CoolEmAll
Organization Out of the focus of CoolEmAll
Facility Data Centre
Rack
Compute Node Node-Group
Node
3.4 Metrics classification in CoolEmAll
The CoolEmAll project goes further to the explained in previous Sections and defines DEBBs (Datacentre Energy Building Block) as an abstract description of a piece of hardware on different granularity levels [29] which is used to define levels of granularity in SVD Toolkit and ComputeBox blueprints. The global deliberation of how a metric should be, the identification of CoolEmAll’s requirements and considering the proposal of GAMES about metrics classification drives to the following conclusions.
The characterisation of the energy impact of the applications is necessary to find out what workload management policies produce more productivity of data centre facilities and IT equipment, thereby a useful classification of metrics in CoolEmAll must include the application layer. Particularly the energy consumption of an application is characterised as function of IT components resource utilisations [26]. In addition, a fine-grained description of metrics for Facility layer defined by GAMES project (Figure 3-4) is necessary, taking node-group, ComputeBox1 (rack-level) and ComputBox2 level into account, as covered in DEBB concept [29].
Consequently the classification of metrics in CoolEmAll will follow the DEBB concept and will include the application boundary as well. This makes sense at the moment that the exercise of following the workflow in a data centre is done. In this way, the applications use the data centre facilities and the IT equipment to produce a useful work. In that way classifying metrics according DEBBs adds another advantage due to they are structured like an onion where each boundary includes the boundaries beneath. Therefore it makes sense that metrics will be defined from the lower physical boundary (Node Level) to the highest (Data Centre), such that metrics in a particular boundary will be based on the metrics of the boundary before and consequently there is no need to repeat the same metrics over and over again. Despite of that, in the literature there are defined metrics specially addressed to particular levels of granularity and useful to cover CoolEmAll’s requirements. Due to facilitate the acceptation of this analysis of metrics in the data centre industry and in the standardization bodies, CoolEmAll will take advantage of them.
Moreover a sub-classification of metrics is needed according requirements on different CoolEmAll’s tasks (Section 3.2.2) and where the approach made within the GAMES project (Section 3.3.2) makes advantage on that task. Therefore metrics on each boundary/DEBB-level will be classified as follow:
Resource Usage metrics: The ratio of utilisation resulting in dividing the consumption of a particular resource by the total amount of that resource concerning a component or set of components.
Energy metrics: It includes metrics addressed to the energy impact of data centre considering all its components and subsystems, whereas are distinguished:
o Power-based metrics: Metrics defined under power terms. The information provided is useful for designers because drives to peak power measurements.
o Energy-based metrics: Metrics defined under energy terms where the time of the measurement must be chosen.
o Heat-aware metrics: The heat-aware metrics take in account temperature to characterise the energy behaviour of the data centre.
Green metrics: These metrics describe the impact of the operation of a data centre in the natural environment.
Financial metrics: These metrics describe the financial impact of the operation of a data centre in a business organization.
4
Definition of metrics
In the present Section useful metrics for CoolEmAll have been selected and classified as per the criteria explained in the previous sections.
4.1 Node Level
The Node Level is the simplest and lower level of granularity in a data centre. It is coincident with the Node Level defined also as the simplest of the DEBBs [29]. Looking at the physical description it can be noted that the PSU is excluded, so power and energy must be measured just at the output of the PSU in DC (Direct Current) Voltage. The key components at this level have been identified as: CPU, Memory, Storage, Node Fan, Network bus and any additional I/O device.
4.1.1 Resource Usage 1) CPU Usage
CPU Usage is measured by evaluating the percentage amount of time that the allocated CPU spends for processing the instructions of the applications. It gives an indication of the CPU load, which is usually represented as a load average over a period of time [26]. CPU usage and load can be unified according to GAMES definition [26]. They are measured by evaluating how much CPU allocated to a process is used by a process over a given time interval.
Eq. 1
2) Server Usage
Being defined by The Green Grid, the Server Usage reflects utilisation level of a server and it is computed as follows [30]:
Eq. 2
This approach really evaluates the ratio of utilisation of the CPU at the Server level and it matches with the CPU usage indicator that desktop computers, laptops and also servers provide as direct measurement. However it must not be confused with the CPU Usage metric, which corresponds in to “Activity of the CPU”. Server Usage is to be considered as “normalized” CPU Usage, which is normalized by considering maximum ability in the highest frequency state.
3) Network Usage
Defined by The Green Grid, it measures the bandwidth used relative to the bandwidth capacity [30].
Eq. 3
The Network Usage is obtained as a direct measurement from desktop computers, laptops and also servers.
4) Memory Usage
The Memory Usage is the ratio of the average size of the portion of memory used by the process to the total amount of memory available [30].
Eq. 4
The requirement of high memory naturally drives to consume more energy [30]. The Memory Usage is a good indicator of electronic energy waste even if it is not a direct indicator of efficiency. Thus less Memory Usage for the same host would improve metrics based on ecological impact without having an impact on performance. The Memory Usage is obtained as a direct measurement from desktop computers, laptops and also servers.
5) Storage Usage
The Storage Usage is the ratio of the disk space used by a process with respect to the total disk space available for the application [30]:
Eq. 5
An application using high amount of disk space intends to consume more energy [30]. With the Storage Utilisation, it happens the same than with Memory Utilisation, thereby even it is not a direct indicator of efficiency, it would improve other metrics based on ecological impact without performance impact. The Green Grid also uses this metric and it defines it in the same way [30]. The Storage Usage is obtained as a direct measurement from desktop computers, laptops and also servers
6) I/O Device Usage
It describes the percentage of occupation of the corresponding I/O device for communications and the number of messages transferred by an application over a set of system components [26].
⁄ ⁄
⁄ Eq. 6
The number of I/O operations is an accumulative quantity, thereby this metric must be addressed to a particular period of time where it has been identified maximum and average time of jobs or batched jobs completion and time of response of interactive applications.
4.1.2 Power-based metrics
Defining the following concepts is required to a full understating of Power-based metrics in the Node.
Power used by the Node (Pnode) is the electrical power drawn by the Node. As
the Node is composed by several components as described in previous Sections, and being possible to measure power drawn individually per each component it is suitable to estimate the power usage by summing the power usage of all components in the Node.
Rated power of the Node (Pnode,rated) is the rated electrical power drawn by the
Node according manufacturer’s specifications.
1) Node Power Usage
It is highlighted that in the literature [27] appears utilisation metrics for all components, all of them defined above, included in IT equipment and in this case, in the Node. But also, it is observed the necessity of a global utilisation metric including all components in the Node, rather a Node usage metric. This can be defined as the ratio of the power used by the Node and the rated power usage of the Node.
Eq. 7
2) MHz / Watt
Indicator of how efficiently power is being used by a CPU or processor [31] [26]. [ ] Eq. 8 Where,
γCPU is the performance of the CPU, [MHz].
3) Bandwidth / Watt
It indicates how much data is moved or accessed per second or time interval per unit of power. This is often associated with capacity per watt [31] [26].
⌈ ⌉ Eq. 9 Where,
φnetwork is the data transfer rate by the network measured in bits per second, [bps].
Pnetwork is the electrical power drawn by the network, [W].
4) Capacity / Watt
This metric refers to how much power is used by the storage facility [31]. For inactive data or off-line and archive data, the capacity per watt can be an effective measurement gauge however for active workloads and applications activity per watt also needs to be considered in order to get a representative indicator of how power is being used [26].
⌈ ⌉ Eq. 10
Where,
Cstorage is the capacity of the Storage measured in bytes, [b]. Pstorage is the electrical power drawn by the Storage, [W].
5) IOPS / Watt
Indicator of how efficiently power is being used to perform a given amount of work [31]. The work could be I/O’s transactions, throughput or other indicator of IT equipment activity [26]. [ ] Eq. 11 Where,
IOPSi is the number of I/O operations or transactions per second made by an I/O device in the Node, [IOPS].
Pi is the electrical power drawn by an I/O device in the Node, [W].
5) Power usage depending on the ratio of utilisation
This metric will help designers to size Cooling and Power supporting devices because it allows knowing the profile of behaviour of the Node comparing the
power usage of the Node and any Resource Usage metric defined in Section 4.1.1.
It must also be taken into account other factors that will determine this metric. Those are, the particular workload and the environmental conditions, being the inlet air temperature and relative humidity. Its evaluation can be done by drawing a graph with the power usage (Watt) at Y-axis and the usage ratio (%) at X-axis. Thus, it will be obtained a single graph for each set of environmental conditions and the particular workload running on the Node. All components in the Node are susceptible to be affected by environmental conditions modifying its global performance, however the more affected are the CPU (the main heat producer) and the fans (the active heat removing device), being the key environmental magnitude the server air inlet temperature [32].
Figure 4-1 CPU Power vs Server Usage: Source IREC
As usage metrics it is recommended to use all described in Section 4.1.1, which are addressed to specific components and also to the whole Node. Possible combinations are:
CPU Power vs. Server Usage Memory Power vs. Memory Usage Storage Power vs. Storage Usage Network Power vs. Network Usage I/O Device Power vs. I/O Device Usage
4.1.3 Energy-based metrics
Specific metrics about productivity at the Node are not present in the literature, due to the fact that they are all defined at the Data Centre. Nevertheless it is made a new approach according CoolEmAll’s requirements already described. Defining the following concepts is required to a full understating of Energy-based metrics in the Node.
Energy consumed by the Node (Enode) is the electrical energy consumption of
the Node during a given period of time. Being the Node composed by several components as described before, and being possible to measure the energy consumption individually per each component it is suitable to estimate it by summing them.
Useful work produced by the Node (Wnode) is the quantity of useful work
produced in the Node according the services provided. In this way and as is defined in Section 3.2.2, CoolEmAll focuses on HPC environments [FLOP], Cloud [Number of service invocations] and General-purpose services [number of transactions].
1) Node Productivity
The productivity according the type of service provided can be calculated as the ratio of the measurable produced work and the energy consumed by the Node during a given period of time.
[
] Eq. 12
Alternatively, a unit of watt hour [Wh] can be converted to Watt second [Ws] that is equal to Joule [J]. Furthermore, [second] in denominator can be shifted as reciprocal to nominator (while keeping its mathematical meaning). In that way, a unit of useful work i.e. [FLOP] (in HPC) per [Ws] can be converted to FLOP per seconds [FLOPS] per [W] as shown:
[ ] [
] 4.1.4 Heat-aware metrics
1) Node Cooling Index
Classical use of temperature at the scale of a Data Centre is for problem detection. In current Data Centres, alert events are started once a temperature of a node rises over a certain threshold. In this case the exact value of temperature is often discarded, and only events of overheating are kept. At the scale of nodes, there is a feedback between temperature and cooling, usually provided by fans and sometime by rack-level cooling. Fans are usually impacted by maximum
temperature of the elements they are linked to and rack-level cooling is usually impacted by the mean temperature of its rack.
Therefore, the correct assessment about the health of the CPU would come from the study of the ratio of compliance of the temperature of the CPU taking in account the thresholds declared by the manufacturer of the CPU. In a study signed by Haywood et al. [33], it was used the Dell’s OMSA (Open Manage System Administrator) software which indicated that processors can operate between 10ºC and 120ºC, and the maximum temperature possible is 125ºC.
Eq. 13 Eq. 14 Where,
TCPU is the temperature of the CPU.
TCPU,min-all is the CPU minimum allowable temperature according manufacturer specifications.
TCPU,max-all is the CPU maximum allowable temperature according manufacturer specifications.
An example is shown in Figure 4-2. In case of the temperature of the CPU is over the maximum threshold, NCIHI is above one. In case the temperature of the CPU
is under the minimum threshold, NCILO is less than one.
Figure 4-2 Example of use of NCI: Source IREC
NCIHI = 122/120 = 1,017
2) Maximum and average heat dissipation
Heat dissipation is not directly measurable but is directly linked with temperature, cooling system, air-flow volume, in- and out-bound temperature. Measure is in J/s or Watt and its expression depends on the exact physical architecture.
The heat dissipation can be calculated using the expression in Eq. 15. It must be
taken in account that the designing practices of infrastructures approximate the heat dissipated by the IT hardware with the electrical power drawn in a ratio of 1:1.
̇ Eq. 15
Where,
Qnode is the heat dissipated by the Node, [W].
̇ is the mass air flow rate through the Node, [kg/s].
Cp is the specific heat of the air used to cool the Node, [J/kg·K]
∆Tnode is the difference between the air inlet temperature and the air outlet temperature.
Pnode is the electrical power drawn by the Node, [W].
4.2 Node-Group Level
The Node-Group Level is the aggregation of several Nodes including potentially the PSU as well and it is also coincident with the Node-Group Level defined in DEBBs conception [29]. Therefore the components identified in this level are a fixed quantity of Nodes and the PSU.
With some exception, specific metrics at this level are not present in the literature, due to they are all defined at the data centre level. Therefore metrics at this level must come from the aggregation of the same kind of metrics defined in Node Level (Section 4.1) and calculating the averaged value.
Some deployments having a common platform are able to give averaged values for all servers they support. Examples are found in RECS developed by Christmann and explained in deliverable D3.1 [29] and Blade solution developed by almost all IT hardware manufacturers. This is shown in Figure 4-3 where hierarchy and interrelations between the different levels of granularity concerning the monitoring system TIMaCS are indicated.
Figure 4-3 DEBBs hierarchy according the monitoring system TIMaCS [29] Metrics, Heartbeat TIMaCS Node Computing Node Delegate Sensors Command Data, Heartbeat Computing Node Delegate Sensors Command
...
TIMaCS Node TIMaCS Node Command, Updates Event, Report, Heartbeat Event, Report, Heartbeat Event, Report, Heartbeat Command, Updates Command, Updates Nodes Layer 0 Node-Group Layer 1 Compute Box 1 Layer 2 Command, Updates Event, Report, Heartbeat Event, Report, Heartbeat Event, Report, Heartbeat Command, Updates Command, Updates Data, Heartbeat Computing Node Delegate Sensors Command...
...
...
TIMaCS Node TIMaCS Node TIMaCS Node
...
...
KB KB KB KB KB KB Compute Box 2 Layer 3 Command, Updates Event, Report, Heartbeat Event, Report, Heartbeat Admin-Node Event, Report, Heartbeat Command, Updates Command, Updates Knowledgebase with Policies, Rules ...TIMaCS Node TIMaCS Node TIMaCS Node
...
...
KB KB KB KB Legend KB 4.2.1 Resource Usage 1) Aggregation of metricsThe Resource Usage metrics defined in the Node level are suitable to be used in Node-Group by aggregation and averaging. Here two possible approaches are possible taking into account the homogeneity of the Nodes involved. Thus the metrics about Node-Groups with homogenous Nodes, thereby all with the same capacity, can be calculated using the general formulation in Eq. 16.
∑
Where,
γi is the performance of the studied component of the Node (e.g. Storage). ci is the capacity of the studied component of the Node (e.g. Storage). N is the quantity of Nodes in the Node-Group.
Resource Usagei is the Resource Usage metric calculated for each Node in the Node-Group (e.g. Storage Usage).
Contrary in case of heterogeneous Nodes it will be obtained from a weighted average as expressed in Eq. 17.
∑ Eq. 17
The weighting factor is obtained from Eq. 18.
∑
Eq. 18
It can be observed in the example of Figure 4-4 that both methods are equal when the study is about heterogeneous Nodes as it used to be. In this example it is calculated the Server Usage at the Node-Group.
Figure 4-4 Aggregation methods for Server Usage metrics from Node to Node-Group level: Source IREC
2) DH-UR: Deployed Hardware Utilisation Ratio
The DH-UR reflects in what degree hardware is used during “normal” period of time [26].
Eq. 19
Where,
Nnode-useful is the quantity of Nodes in the Node-Group that are running applications producing useful work.
N is the total quantity of Nodes deployed in the Node-Group.
Knowing the quantity of Nodes running live applications from the total number of deployed Nodes is an indicator for the energy consumption of the main computing equipment from the IT equipment in “normal” periods of time [26]. For instance if 50% of the Nodes are sufficient to handle average load and are running all the time, then the rest could be shut-down to save energy [26]. Efficient deployments would intend to have DH-UR as close to 1 as possible.
CASE 1 CASE 2
Node_i CPU Activity_i CPU Capacity_i Server Usage_i weight_i Server Usage_i*weight_i
#1 50 100 0,50 0,056 0,028 #2 75 110 0,68 0,061 0,042 #3 35 50 0,70 0,028 0,020 #4 45 85 0,53 0,047 0,025 #5 60 135 0,44 0,075 0,033 #6 75 100 0,75 0,056 0,042 #7 69 70 0,99 0,039 0,038 #8 73 80 0,91 0,045 0,041 #9 35 150 0,23 0,084 0,020 #10 53 95 0,56 0,053 0,030 #11 28 65 0,43 0,036 0,016 #12 38 100 0,38 0,056 0,021 #13 95 100 0,95 0,056 0,053 #14 48 83 0,58 0,046 0,027 #15 78 85 0,92 0,047 0,044 #16 86 100 0,86 0,056 0,048 #17 35 62 0,56 0,035 0,020 #18 66 82 0,80 0,046 0,037 #19 32 50 0,64 0,028 0,018 #20 72 91 0,79 0,051 0,040 SUM 1148,00 1793,00 0,640
3) DH-URCPU: Deployment Hardware Utilisation Ratio considering CPU
The DH-URCPU metric reflects the utilisation ratio of CPUs (comparing to
allocated CPUs) that are used within the allocated CPUs of the Node-Group.
Eq. 20
Where,
NCPU-used is the quantity of CPUs in use within the Node-Group. Nis the quantity of CPUs allocated in the Node-Group.
Efficient deployments would intend to have as close to 1 as possible.
4.2.2 Power-based metrics
Concepts used to define Power-based metrics in Node-Group level must be clarified after going through them. These are:
Power used by the component (Pcomp) is the electrical power drawn by a
particular type of component. The assessment in Node-Group level considers i.e. the summing of all the CPUs included in the Node-Group. Note this is completely different than the power used by the Node-Group (PNG). Consequently it is
calculated as in Eq. 21.
∑ Eq. 21
Where,
N is the quantity of Nodes in the Node-Group.
pi is the power drawn by the studied component of the Node-Group (e.g. Memory), but being really part of the Node, [W].
1) Aggregation of metrics
The Power-based metrics defined in Node level must be reformulated to be used in Node-Group level. These metrics are mainly referred to the performance of components in the Node-Group regarding power usage of that component. In consequence there is no a common point to measure all the same kind of components within the Node-Group and the metric can only be obtained as shown in Eq. 22.
∑
Where,
Poweri is the Power-based metric from each Node in the Node-Group (e.g. MHz/Watt).
2) SWaP: Space, Watts and Performance
In order to allow comparison of several IT server configurations, it is defined the SWaP indicator which takes space occupation, rated power usage and rated performance of a single server [26]. It is calculated as:
[
] Eq. 23
Where,
WNG,rated is the rated performance of the Node-Group, [units of useful work].
HNG is the occupation of the Node-Group in the Rack, [number of U]. Therefore, it is not defined as a “living” indicator due to it is fixed for each server, but once assigned it can help data centre operators for servers’ collocation or reorganization [26].
4.2.3 Energy-based metrics
Defining the following concepts is required for a full understating of Energy-based metrics in the Node-Group.
Energy consumed by the Node-Group (ENG) is the electrical energy
consumption of the Node-Group during a given period of time. Because of the inclusion of the PSU, to obtain it, it must be measured just at the input of the PSU. Otherwise it would not include the PSU consumption due to its inefficiencies converting AC to DC.
Useful work produced by the Node-Group (WNG) is the quantity of useful work
produced in the Node-Group according the services provided. In this way and as is defined in Section 3.2.2, CoolEmAll focuses on HPC environments [FLOP], Cloud [Number of service invocations] and General-purpose services [number of transactions]. Due to it is implicitly measured in the Node it must be calculated by summing the useful work produced by all Nodes in the Node-Group.
∑ Eq. 24
1) Node-Group Productivity
It is defined in the same way than the Node Productivity (Eq. 12) but applied to the
Node-Group. [ ] Eq. 25 4.2.4 Heat-aware metrics 1) Node-Group Cooling Index
It is defined in the same way than RCI (Eq. 42 and Eq. 43) but applied in the
Node-Group level. Therefore is reformulated as shown in Eq. 26 and Eq. 27.
[ ∑( ) ( ) ] Eq. 26 [ ∑( ) ( ) ] Eq. 27 Where,
TNG,x is the average temperature at Node-Group air intake in a given period of time.
n is the total number of air intakes.
Tmax-rec is the maximum recommended air temperature per some guideline or standard.
Tmax-all is the maximum allowed air temperature per some guideline or standard.
Tmin-rec is the minimum recommended air temperature per some guideline or standard.
Tmin-all is the minimum allowed air temperature per some guideline or standard.
The interpretation is the following:
CING,HI = 100% All intake temperatures ≤ max. recommended temperature.
CING,HI < 100% At least one intake temperatures > max. recommended
temperature.
CING,LO = 100% All intake temperatures ≥ min. recommended temperature.
CING,LO < 100% At least one intake temperatures < min. recommended
![Figure 2-1 Simple schematic with the key data centre subsystems [12]](https://thumb-eu.123doks.com/thumbv2/123doknet/14324720.497628/13.918.138.675.144.496/figure-simple-schematic-key-data-centre-subsystems.webp)
![Figure 2-7 Data Centre electricity breakdown, taking into account low utilisation [17]](https://thumb-eu.123doks.com/thumbv2/123doknet/14324720.497628/16.918.169.750.314.583/figure-data-centre-electricity-breakdown-taking-account-utilisation.webp)
![Table 3-1 Critical Environment Teams concerning data centres [19]](https://thumb-eu.123doks.com/thumbv2/123doknet/14324720.497628/18.918.142.779.620.898/table-critical-environment-teams-concerning-data-centres.webp)
![Figure 3-3. Data centre control volume. Source: IREC based on [25] [24]](https://thumb-eu.123doks.com/thumbv2/123doknet/14324720.497628/23.918.127.781.530.901/figure-data-centre-control-volume-source-irec-based.webp)
![Figure 3-4 Classification of metrics in GAMES project [26]](https://thumb-eu.123doks.com/thumbv2/123doknet/14324720.497628/25.918.158.752.143.1127/figure-classification-metrics-games-project.webp)