XVII. COGNITIVE INFORMATION PROCESSING
Academic and Research Staff
Prof. S. J. Mason Prof. B. Prasada Dr. P. A. Kolers Prof. W. L. Black Prof. O. J. Tretiak Dr. N. Sezaki Prof. M. Eden Prof. D. E. Troxel K. R. Ingham Prof. T. S. Huang Prof. D. Cohen G. L. Wickelgren
Dr. M. P. Beddoes Graduate Students
A. K. Bhushan P. H. Hartmann J. A. Newell J. D. Bigham, Jr. M. Kawanami L. C. Ng
D. Caldwell E. E. Landsman D. H. Pruslin
A. L. Citron M. B. Lazarus C. L. Seitz
R. W. Cornew F. F. Lee S. D. Shoap
A. Gabrielian J-H. Liu A. Spiridon
B. P. Golden J. A. Williams
A. COGNITIVE PROCESSES
1. CONFUSION ERRORS FOR SPATIALLY TRANSFORMED LETTERS
We have shown before that various geometric transformations of connected discourse impose different burdens on the reader who is trying to decode the text. One way of
ac-counting for these differences is in terms of the difficulty of recognizing individual let-ters that have been transformed, and so it becomes of interest to learn whether the order of difficulty of various transformations of individual letters is the same as the order of difficulty for decoding connected text.
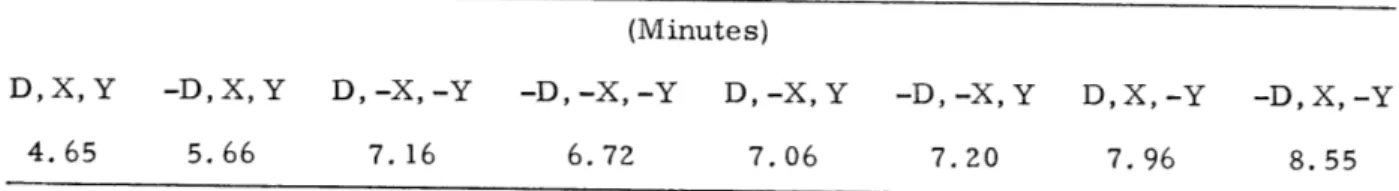
The first 800 letters of a page of connected discourse used previously were trans-formed by a computer into eight different random arrangements. Each arrangement was then prepared in one of eight possible geometrical transformations.1 Ten students at M. I. T. named all of the characters on a page in a counterbalanced order for the various transformations. The transformations may be described with respect to the plane of the paper as rotation in the plane, top-to-bottom inversion, and mirror reflection. Further-more, one half of the sample was named from left to right, the other half from right to left. Direction of scanning may be represented as D (left to right) or -D (right to left); the orientation of a character as X (normally faced) or -X (facing to the left); and whether it is upright or upside down as Y and -Y, respectively. The average time (in minutes) that the 10 subjects required to name the characters is shown in Table XVII-1.
This work was supported in part by the Joint Services Electronics Programs (U.S. Army, U.S. Navy, and U.S. Air Force) under Contract DA 36-039-AMC-03200(E), and in part by the National Science Foundation (Grant GP-2495), the National Institutes of Health (Grant MH-04737-05), and the National Aeronautics and Space Administration
(XVII. COGNITIVE INFORMATION PROCESSING)
Table XVII-1. Time taken to name characters in different geometric configurations.
(Minutes)
D, X, Y
-D, X, Y
D, -X, -Y
-D, -X, -Y
D, -X, Y
-D, -X, Y
D, X, -Y
-D, X, -Y
4.65
5.66
7.16
6.72
7.06
7.20
7.96
8.55
In comparing these results with those obtained from subjects reading continuous
1text,
we see that the order of difficulty of the transformations is not maintained,
although there are similarities in the two orders. Furthermore, it is clear that
charac-ters otherwise identical except for the direction in which they are scanned require
differ-ent amounts of time to be named correctly; the same is true for characters varying only
in X, only in Y or in combinations. Thus, character naming is clearly not the same task
as reading, and variations in the x, y coordinate values of characters affect human
detectors differentially.
One might also conclude that these results indicate that humans
do not detect characters by tracing their contours, since identical contours yield
dif-ferent results (Table XVII-1).
P. A. Kolers, Kathryn F. Rosenthal
References
1. P. A. Kolers, M. Eden, and Ann Boyer, "Reading as a Perceptual Skill," Quarterly
Progress Report No. 74, Research Laboratory of Electronics, M. I. T., July 15, 1964,
pp. 214-217.
B. PICTURE PROCESSING
1. REDUCTION OF THE OUTPUT NOISE POWER ON A VERY
NOISY PCM CHANNEL
When PCM is transmitted over a white Gaussian noise channel it is generally assumed
that the signal-to-noise ratio per pulse is at least 10 db. Bedrosian
1has shown that with
the same energy per pulse group it is possible to reduce the output noise power
approx-imately 8 db by using weighted PCM. He indicates an approximate formula for the pulse
energies which, however, does not give good results when the signal-to-noise ratio per
pulse falls below 10 db.
For such small signal-to-noise ratios a graphical solution can be obtained which will
be derived here.
We make the following assumptions: (i) the quantization steps are
uni-form and equal to unity, and (ii) the probability distribution of the input levels is flat.
(XVII, COGNITIVE INFORMATION PROCESSING)
n
N
=
P
4i-1
i= 1
where
1 Pi = No2ea/
i
Eda
e
.
=/2 I
=
Q
n is the number of pulses per code group,
the i
t hpulse.Z
Y10
-5 0 s2 3 -5 -10-and ZEi/No is the signal-to-noise ratio for
Fig. XVII-1. Family of curves y
1
S -In
1
2S + (i-1) . In 4.
We want to minimize N under the constrainte
n 2E
iN
Oi= 1
=n = n S No
Defining the quantities
S
ZE
i
N
'
oS
2E
N oN e
S
N
eNe
weigh.
Sdb
not w.
weigh.
Ne
not w.
db
7.3
13.65
2.2
-7.9
8.2
6.83
1.0
-8.3
9.8
1.37
0.19
-8.6
Fig. XVII-2.
Comparison between unweighted and weighted PCM systems.
UNWEIGHTED PCM
10 db
WEIGHTED PCM
Fig. XVII-3.
Comparison between unweighted and weighted
PCM systems.
UNWEIGHTED
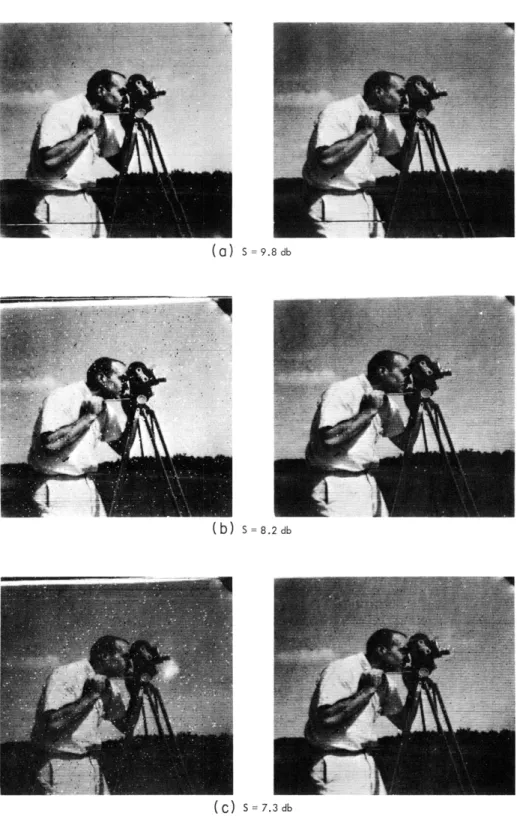
(a) S =9.8 db
(b)
S=8.2db(C) S=7.3db
Fig. XVII-4. Effect of using weighted PCM on the test picture.
WEIGHTED(XVII. COGNITIVE INFORMATION PROCESSING)
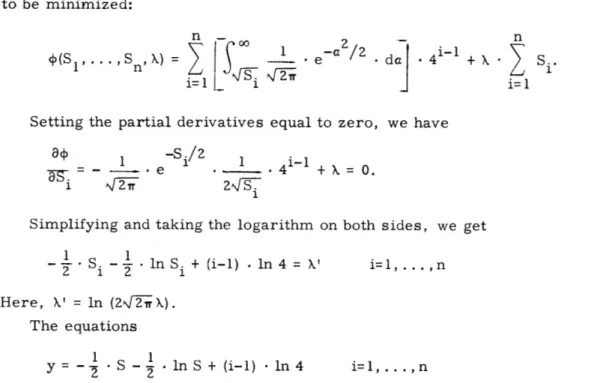
and introducing the Lagrange multiplier X, we arrive at the following function which is
to be minimized:
n 0 n
1
S /
1
-a
. 4i-1i=1
1=
Setting the partial derivatives equal to zero, we have
1
-Si/2
1
i-1
-. = -
e
4
+ k
=
0.
i
24
Simplifying and taking the logarithm on both sides, we get
1
1
- S i - In Si + (i-1) . In 4 = ' i=l, ... , n Here,k'
= In (2Nfk)X).The equations
1
1
y = -
S -2
In S + (i-l) • In 4
i=l, ...
, n
represent a family of congruent curves separated from each other by a vertical distance
of In 4. (cf. Fig. XVII-1).
Now the problem is to find a parallel to the S axis which
intersects the n curves in such a way that the abscissas S
iof the intersections add up to
n • S.
Once the curves are plotted this is not very difficult.
From the S. the
corre-sponding error probabilities pi can be determined by using a table or a plot.
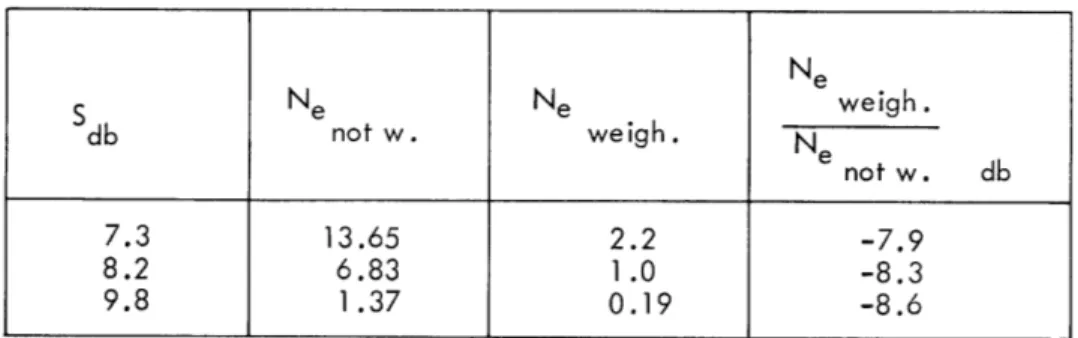
3By using this method, results were obtained for a 6-bit PCM system (Fig. XVII-2).
The last column represents the reduction of the error noise power in decibels.
Figure XVII-3 shows the same results in graphical form.
These results were obtained in the context of an investigation of how the quality of
television pictures could be improved when they are transmitted over a very noisy PCM
channel.
Both the unweighted and the weighted PCM system were simulated on
the IBM 7094 computer, and the improvement of the picture quality is
remark-able (cf. Fig. XVII-4).
We shall investigate the problem of whether a different weighting function will yield
still better pictures.
It is seen that the graphical method discussed here can be extended
to any weighting function: the curves preserve their shape, but the vertical distance
between them will be changed according to the weighting function.
H. P. Hartmann
References
(XVII. COGNITIVE INFORMATION PROCESSING)
2. J. M. Wozencraft and I. M. Jacobs, Principles of Communication Engineering (John Wiley and Sons, Inc., New York, 1965), p. 250.
3. For example, ibid., p. 252.
2. CONSIDERATIONS ON THE GENERATION AND PROCESSING OF HOLOGRAMS BY DIGITAL COMPUTERS
a. Introduction
Holography and other coherent optical processing schemes1 have aroused consider-able interest among those working in the field of television bandwidth compression and image processing. These new techniques have made possible relatively simple ways of obtaining the Fourier transforms of two-dimensional functions and operating on them in the frequency domain.
Holography provides an alternative description of pictures, which might be more amenable to bandwidth compression. To investigate this possibility, it is desirable to measure various statistics of the hologram, and to try various operations on it to see what their effects would be on the reconstructed pictures.
The types of processing that one can do by using coherent optics are rather limited. If one can get the hologram into a digital computer, however, or gen-erate the hologram in the computer in the first place, then the number of possible operations one can do on the hologram is almost unlimited. The reconstruction of the picture from the processed hologram can be done either on the computer or by coherent optics (after having first obtained a transparency of the hologram from the computer).
The advantages in using a digital computer for the generation and processing of holo-grams are the following.
(i) The computer is flexible. It can be used to do various linear and nonlinear opera-tions such as amplitude generalization which are either not easily done or impossible to do by coherent optics.
(ii) The problem of dirt and fingerprints on lenses is a very real one in an optical processing system. These produce rather prominent spurious patterns on the hologram which are irrelevant for the reproduction of the picture, and will distort the statistics of the hologram. This problem is completely eliminated by using computers.
(iii) The imperfection of lenses and the nonlinearities of films introduce limitations in an optical system. They can be avoided by using computers.
In this report we discuss the problems involved in the generation and processing of holograms on digital computers and, in particular, the limitations of such an approach.
(XVII. COGNITIVE INFORMATION PROCESSING)
b. Generation of Holograms
Theory of Fourier Transform Holograms
There are various types of holograms. We plan, as a first step, to consider the Fourier-transform holograms of two-dimensional images. Let the amplitude transmis-sion of the original two-dimentransmis-sional image (on a transparency) be f(x, y), where x and y are the spatial coordinates, and let F(u, v) be the Fourier transform of f(x, y), where u and v are the spatial (angular) frequencies. Then the amplitude transmission of the hologram transparency (except for some scale factors) is
H(u,v) = JF(u, v) +Aejau 2
= F(u,v) 2 + A2 + AF(u, v) e- jau + AF(u, v) ejau
= F(u,v) 2 + A2 + 2A F(u,v)I cos (au- (u,v)), (1) where p(u,v) is the phase angle of F(u,v), and A and a are real constants, and * denotes complex conjugation.
In reconstruction, the inverse Fourier transform of H(u, v) is obtained:
h(x, y) = Rf(x, y) + A2 (x, y)
+ Af(x-a, y)
+ Af (-x-a, -y), (2)
where Rf(x, y) is the autocorrelation function of f(x, y), and 6(x, y) is the unit impulse function. Let the size of f(x, y) be L X L (that is, assume f(x, y) = 0, for - < x
<
L L
and -2 2y ). Then the size of Rf(x, y) is 2L X 2L. Therefore, if we choose
3
a 2 L, (3)
the desired reconstruction (the third term of Eq. 3) will be shifted far enough away from Rf(x, y) so that there is no overlap between the two (Fig. XVII-5).
In practice, we have to truncate H(u, v) in reconstruction, and thereby introduce overlap between the first and third terms of Eq. 2. Assume that, instead of H(u, v), a
A
truncated hologram H(u, v) = H(u, v) Q(u, v) is used, where
W
W
W
W
, for --
<
u<
and<
v <-2
2
2
2
Q(u,v)
= 2 (4)0, elsewhere
(XVII. COGNITIVE INFORMATION PROCESSING)
h(x, y) = h(x, y) q(x,y)y
= Rf (x, y) q(x, y) + A2 q(x,y)
+ Af(x-a, y) N q(x, y) + Af(-x-a, y) 5 q(x, y), (5) where j denotes convolution, and q(x, y) is the inverse Fourier transform of Q(u, v).
q(xWy) 2 sin Wu) sin Wv (6)
q(x,y) - W (6)
In addition to introducing overlap between the terms of Eq. 5, the truncation also distorts the desired third term. To make the distortion negligible, we want
2r W >> .
L
To ensure that the desired third term is not obscured by the first term, we can either use a large value for a to reduce the amount of overlapping or a large value for A to make
Af(x-a, y) >> Rf(x, y)
in the overlapping region.
The hologram of Eq. 1 can be made by using coherent optics. It can also be made by using a digital computer: A picture f(x, y) is first recorded on magnetic tape by the CIPG digital scanner.2 This tape is read into the computer which generates the function H(u,v) and writes it on an output tape. The CIPG digital scanner plays back this output tape and
L -L L L -2 L 2 L
K
2 2A(xy) -a -L 0 -L a L Af(-x-,-y) Af(x-a, y) -L Rf(x,y)Fig. XVII-5. Reconstruction from hologram. The functions are nonzero only in their respective shaded regions.
(XVII. COGNITIVE INFORMATION PROCESSING)
displays the hologram on a cathode-ray tube, from which a photograph (transparency) can be taken. The reconstruction can again be done either by using coherent optics or the computer.
Resolution Requirements
To generate a hologram on the digital computer, the original image must be sampled. Assume that the original image can be adequately represented by N X N (complex)
3
samples. From Fig. XVII-5, it is clear that if we choose a = 2 L, then the hologram can be adequately represented by 4N X N samples. Notice that no matter how big a value we use for a, the number of samples required in the vertical direction of the hologram is always N.
Two-Dimensional Fourier Transform
To generate a hologram according to Eq. 1, one has first to calculate the two-dimensional Fourier transform F(u, v) of f(x, y). To do this on a digital computer using a straightforward method requires an amount of time proportional to M2
, where M = NX N is the number of samples in the input. For large M, this time could be considerable. Recently, however, Cooley and Tukey3 have developed an efficient algorithm for cal-culating Fourier transforms which only requires an amount of time proportional to M log2 M. For large M, the saving in time is great.
Different "Biasing" Schemes
The hologram of Eq. 1 is a way of representing the complex Fourier transform of some function in a positive real form so that it can be realized on a photographic trans-parency. The term of interest in Eq. 1 is
K(u, v) = 2AIF(u, v) cos (au-(u, v)) (9)
which is real but can be negative. The other two terms IF(u, v) 2 + A2 can be thought of as a bias which is added to K(u, v) to make the total sum always positive. This particular biasing scheme happens to be easily realizable by using coherent optics.
If a digital computer is used to generate the hologram, then other biasing schemes are feasible. For example, one can use 2A IF(u, v) I as a bias to get
H1(u, v) = 2AIF(u,v)I + 2AIF(u, v) I cos (au-c (u,v)) (10)
with inverse Fourier transform
hl (x, y) = 2Ag(x, y) + Af(x-a, y) + Af(-x-a, -y), (11)
(XVII. COGNITIVE INFORMATION PROCESSING)
J J J J
If g(x, y) is essentially zero outside 2 x and y ~< , then to avoid over-lapping of the terms in Eq. 11, we have to choose
a > J (12)
instead of the inequality (3). Notice that the dynamic range required of the film which records the hologram is the same for H(u, v) and H1(u, v).
Windows
As we have mentioned, in practice the hologram has to be truncated in reconstruc-tion. A square "window" Q(u, v) was used to truncate H(u, v), which resulted in a recon-structed desired image f(x, y) & q(x, y). Since q(x, y) has large positive and negative side lobes, ringing will occur at the edges in the picture f(x, y). To avoid ringing, we can use a different window Q1(u, v) whose inverse transform q1 (x, y) has small side lobes.
4
One such window is the so-called "hanning" window :F+
+ cos
)
+cos
),rvfor
IuI
W
Ql(u,v)
= and IV<
W (13)S0, elsewhere
For this window, the side lobes of q1(x, y) are smaller than 1 per cent of q1(0, 0).
Hologram of Complex Pictures
To make a hologram using coherent optics, one starts with a picture f(x, y) which is real and positive (at least one does not care about its phase). On a digital computer, one can easily compose a complex picture
f(x, y) = f1(x, y) + jf2(x, y), (14)
where fl and f2 are two positive-real pictures, and then generate a hologram of f(x, y). The reconstruction of fl and f2 from such a hologram is clearly feasible by using the computer, although optical reconstruction seems difficult.
Our discussions are valid whether f(x, y) is complex or real. In particular, if each 3
of fl and f2 consists of N X N samples, and if we use a = L, then the hologram of f requires 4N X N samples.
Limitations of the Digital Computer Approach
There are three limitations: (a) the speed of the computer; (b) the memory capacity of the computer; and (c) the resolution of the digital scanner raster.
(XVII. COGNITIVE INFORMATION PROCESSING)
Therefore, it is capable of displaying the hologram of a picture with 128 X 128 samples. The state of the art is such that a 3000 X 3000 point digital scanner seems feasible. Using such a scanner, one can display holograms of 750 X 750 sample pictures, which are better than broadcasting television pictures in resolution.
To calculate the Fourier transform of a 64 X 64 point picture, using the Cooley-Tukey algorithm, takes approximately 0. 1 minute3 on the IBM 7094 computer, which has a cycle time of 2
psec.
To do this for a picture with resolution comparable to that of broadcasting television pictures (500 X 500 points), would take approximately 10 minutes, which is long but still tolerable.Each point of the Fourier transform depends on all the input samples. Therefore, it is almost mandatory to store the entire input picture in the computer memory. The size of the computer memory, then, limits the size of the input pictures that one can handle.
For the IBM 7094 computer, which has a memory of 215 words, one can handle input pictures of up to 64 X 64 points.
None of the limitations mentioned here are fundamental. They will be removed with the progress of computer technology.
c. Discussion
The hologram can be considered as an alternative description of the picture and hence most of the picture-processing schemes that have been proposed for the picture can be tried on the hologram. Also with the use of computer, the requirement that the description be positive and real so that it can be recorded on film is no longer valid. Therefore, instead of the hologram, one can study the two-dimensional Fourier transform itself.
Specifically, sampling and quantization are two operations that are inherent in any processing on the digital computer. It will be interesting to observe the subjective effects of coarse quantization of the hologram and the Fourier transform.
We can study the amplitude probability distributions, as well as the adjacent sample difference distributions of the hologram and the Fourier transform. These will indicate whether the hologram is more amenable to some of the statistical encoding schemes than the picture itself.
It will be interesting to study the effect on the reconstructed picture of additive Gaussian noise, as well as digital noise added to the hologram or the Fourier transform. Another problem is to study the effect of slope-limiting coding schemes such as delta
modulation.
Our future plan is to carry out some of the computer processing suggested in this report and to consider the generation and processing of holograms of three-dimensional objects and of holograms other than the Fourier-transform type.
(XVII. COGNITIVE INFORMATION PROCESSING)
References
1. E. N. Leith and J. Upatnieks, "Wavefront Reconstruction with Continuous-tone Objects," J. Opt. Soc. Am. 63, 1377-1381 (April 1963).
2. T. S. Huang and O. J. Tretiak, "Research in Picture Processing," Chapter 3 in Optical and Electro-Optical Information Processing (The M. I. T. Press, Cambridge, Mass., 1965), pp. 45-49.
3. J. W. Cooley and J. W. Tukey, "An Algorithm for the Machine Calculation of Com-plex Fourier Series," Mathematics of Computation 19, 297 (April 1965).
4. D. Blackman and J. Tukey, The Measurement of Power Spectra (Dover Publications, New York, 1958).