Auteurs:
Authors
:
Vanessa C. Harvey, Patrice Farand, Robert Legros et Jason Robert
Tavares
Date: 2015
Type:
Article de revue / Journal articleRéférence:
Citation
:
Harvey, V. C., Farand, P., Legros, R. & Tavares, J. R. (2015). On the average perception of perceived averages. Education for Chemical Engineers, 12, p. 12-19. doi:10.1016/j.ece.2015.06.002
Document en libre accès dans PolyPublie
Open Access document in PolyPublie
URL de PolyPublie:
PolyPublie URL: http://publications.polymtl.ca/2782/
Version: Version finale avant publication / Accepted versionRévisé par les pairs / Refereed Conditions d’utilisation:
Terms of Use: CC BY-NC-ND
Document publié chez l’éditeur officiel
Document issued by the official publisherTitre de la revue:
Journal Title: Education for Chemical Engineers Maison d’édition:
Publisher: Elsevier URL officiel:
Official URL: https://doi.org/10.1016/j.ece.2015.06.002 Mention légale:
Legal notice: "In all cases accepted manuscripts should link to the formal publication via its DOI" Ce fichier a été téléchargé à partir de PolyPublie,
le dépôt institutionnel de Polytechnique Montréal This file has been downloaded from PolyPublie, the
institutional repository of Polytechnique Montréal http://publications.polymtl.ca
For submission to Education for Chemical Engineers - revision
On the Average Perception of Perceived Averages
1
Vanessa C. Harvey, Patrice Farand, Robert Legros and Jason R. Tavares*
2
Department of Chemical Engineering, Polytechnique Montreal
3
P.O. Box 6079, station Centre-Ville, Montreal, Quebec (Canada), H3C 3A7
4
5
E-mail: [email protected]6
Telephone: 1-514-340-4711 ext. 23267
Fax: 1-514-340-41598
*Corresponding author9
10
Abstract. The Chemical Engineering curriculum at Polytechnique Montreal is structured to gradually provide more
11
and more autonomy to the students. The third-year Unit Operations is taught using an outcomes-based approach and
12
represents a turning point in the undergraduate curriculum where rubrics-based assessments overtake normative
13
assessments. This begs the question: is it really necessary to divulge the average to students following assessments?
14
Those from a more industrial background see the average as an unnecessary crutch for students, while the more
15
academically inclined see it as a useful pedagogical tool to provide feedback and help students determine if they
16
have attained their learning objectives. To settle this debate, we set into motion a yearlong study during which the
17
average results to tests were withheld. Students were asked to predict their grade and the class average, and provide
18
feedback on the assessment process. Results show that students are able to predict the average, but have difficulty
19
predicting their individual performance (especially before a test, where more than 50% of students are off by a factor
20
of more than 10%). Students award more importance to their personal sense of learning satisfaction than their
21
position with respect to the average, and do not systematically use the average to plan study time (despite preferring
22
to know it). Thus, it may be possible to substitute alternate frames of reference to the class average in an
outcomes-23
based course, but this is not necessarily desirable and should at the very least be the subject of a more open
24
discussion.
25
26
Keywords: averages, outcomes-based approach, chemical engineering, unit operations, gender, perception
27
1. Introduction and context
29
1.1 Polytechnique Montreal’s undergraduate chemical engineering curriculum
30
The 120-credit Chemical Engineering undergraduate curriculum at Polytechnique Montreal is a 4-year program
31
constructed as a learning program-based approach (Prégent et al., 2009). This has allowed for a high level of synergy
32
between the various core classes in the curriculum. Ten years ago, this synergy allowed for the creation of several
33
outcomes-based classes. The undergraduate curriculum committee accomplished this by first outlining 12 criteria
34
that define the competence of a chemical engineering graduate, and then formulating a pedagogical design for course
35
sequencing. Therefore, it is possible to monitor the evolution of a future engineer’s competence over a series of
36
classes, specifically through the use of rubrics (Stevens and Levi, 2005; Huba and Freed, 2000). The curriculum is
37
structured to promote student autonomy and develop certain skills that are specific to chemical engineers. Overall,
38
the implemented strategy aims to change the type of support available to students throughout their academic career.
39
In the beginning considerable support is offered; this gradually changes from support to mentoring as the student
40
advances in his/her career. This evolution is linked not only to progression of the course content, but the assessment
41
frequency and structure used, transitioning from a normalized approach (comparing students to each other) toward a
42
criterion-based approach (comparison of students based on pre-established criteria).
43
44
1.1.1 First year
45
Most students registered in the first year of the Chemical Engineering bachelor program have completed college or a
46
similar level of schooling (K+13). The transition from college to university is an important step that requires students
47
to make many adjustments. To make this easier for new students, we conduct courses with a traditional framework
48
that is largely similar to what they already know. In the beginning of the program, many courses have several
49
assessments (graded tutorials) that account for a small percentage of the final course grade. This strategy forces the
50
students to work steadily, thus preparing for their exams more easily. Autonomy is therefore limited at first to
51
promote their integration into the academic world and contribute to the development of good working habits.
52
53
Evaluations are corrected using traditional normative methods, which means scaling the grades so they are well
54
distributed. In general, the grades are distributed along a normal curve. At the end of the assessment, the average, the
55
standard deviation and a histogram showing the distribution of grades are presented to the students. These statistics
56
help guide the professors when giving out final grades (A*, A, B+, B, C+, C, D+, D, F) for the course. In addition,
57
using these statistics, students can determine how well they did in the course based on the average. At the end of
58
their first year, the students complete an integrative project. This is the first course in which we begin assessing their
59
skills using set rubrics.
60
61
1.1.2 Second year
62
In the second year, the professors give the students more autonomy. The courses have fewer assessments of lesser
63
weight and more recommended sets of problems , pushing the students to study on their own. In addition, the nature
64
of the assessments helps incorporate the concepts learned in the first year. For certain assessments, set rubrics are
used to formulate their final grades. Since the grader makes use of rubrics, he/she is able to compare student
67
performance in terms of these set criteria, thus greatly diminishing correction bias and forming a clearer picture of
68
competence development over a course sequence (Tardif, 2006). Following the evaluation, each student receives his
69
or her completed assessment grid. The average can be calculated based on the various grades obtained, but it has no
70
direct impact on the students’ final grade. Situating their performance on the assessment grid scale (clearly defined
71
criteria) and not as a comparison to the group average is what is most important. However, the average can help the
72
students to see where they stand compared to the group and therefore to make more effort, if needed.
73
74
1.1.3 Third year
75
In the third year, professors push the students to further develop their autonomy, with very little formal support,
76
especially in situations they have already encountered. When students have questions about a course, they are
77
encouraged to find the answer themselves or with the help of their fellow classmates. As a last resort, they are invited
78
to consult their professors. The majority of assessments evaluate skills using set rubrics and some more traditional
79
exams are also employed. As in the 2nd year, the professors give out the class average for information purposes, but
80
do not use it to determine the various final grades for the course. The main course for third year students involves
81
designing unit operations in chemical engineering and is worth 13 credits out of 30 for the year. In this course,
82
students carry out a project worth 6 credits in which the assessment is based exclusively on a set rubric. Using this
83
format, it is possible to evaluate the students’ skills based on precise criteria and not by comparing students with one
84
another. The assessment grids for this particular class have been optimized over the past ten years and the clarity of
85
the criteria used makes it possible to unambiguously define our expectations from the beginning. The students are
86
therefore able to produce better quality work than with a more traditional method of assessment. When giving out the
87
final letter grades for the course, the professors never use an average. The student’s grade is compared to the
pre-88
determined expectations without taking into consideration the performance of the other students. Nonetheless, for the
89
few remaining normative evaluations (quizzes namely), averages are still disclosed to the students.
90
91
1.1.4 Fourth year
92
For fourth year students, we conduct courses where the students are very autonomous in the majority of decisions
93
they make. The support offered by the professors is minimal and focuses mainly on orienting the students to useful
94
resources because the required expertise may be outside of the competency of the professor involved in the different
95
industrial projects. The assessment criteria are clearly defined from the beginning and directly related to industrial
96
standards. Professors and the department’s industrial partners have jointly developed these criteria and the
97
assessment focuses only on the students’ skills. In the course-project (capstone design project), both the professors
98
and the industrial partners grade the students without taking into consideration the performance of other students. In
99
this case, there is no average calculated.
100
101
1.2 Debate on the necessity of divulging class averages
102
This evolution from mostly normative to essentially outcomes-based evaluation brings about a pertinent question: is
103
it still necessary to divulge the class average to students following a given evaluation in an outcomes-based class
environment, specifically in the third year of the above-described curriculum? Indeed, in a traditional, normative
105
(curve-based) class, the class average may be seen as a useful tool allowing the student to situate himself/herself with
106
respect to his/her colleagues. However, in an outcomes-based context, the average has no bearing on the student’s
107
final performance. In fact, since students are compared to pre-established criteria, it is possible that a large number of
108
students receive grades below or above expectations. Moreover, some faculty members have brought up the point
109
that, once on the job market, a young engineer’s performance (and remuneration) will typically not be based on a
110
comparison with colleagues, but rather on his/her ability to meet or exceed goals set forth by management. This
111
philosophy is reflected in the fourth-year teaching approach. On the other hand, companies may compare one
112
individual to another in a hiring context, though hiring may also be based on set criteria for teamwork,
113
communication or specific technical skills. As stated previously, a transition from normative to outcomes-based
114
evaluations takes place in the second year of the Polytechnique curriculum, though averages remained divulged for a
115
small set of evaluations in the third year (despite having no bearing on the final grade). The present work aims to
116
study the pertinence of divulging class averages in a competence-based approach, both through a literature survey
117
and an empirical investigation conducted in Polytechnique Chemical Engineering’s flagship class for
outcomes-118
based education in the third year: Unit Operations.
119
120
1.3 Unit Operations
121
The Unit Operations class (GCH3100) is an innovative course taken in the 3rd year of the undergraduate curriculum.
122
It is structured around four principal chemical engineering themes: applied fluid mechanics, applied heat transfer,
123
separation processes and process control. The class aims for development of discipline-specific competences in
124
parallel with professional, organisational, reflective, personal and human attributes, through authentic evaluation
125
mechanisms (Wiggins, 1998; Huba and Freed, 2000; Roegiers, 2000; Scallon, 2004; Tardif, 2006; Prégent et al.,
126
2009). The course is divided into two parts:
127
Theory (7 credits) – developing knowledge and know-how for unit operations;
128
Practice (6 credits) – competence development through project-based learning and practice.
129
130
This 13-credit workload represents almost the entire load for the semester in question (credit loads average 15 per
131
semester). Students spend approximately 20 hours per week in class (roughly 50% of the total workload) and are
132
taught by a team of 12 instructors. Class sizes range from 25 to 75 students. A specially designed classroom is
133
dedicated to this course, as it is adapted for both traditional lectures and team projects. The integrated approach to
134
teaching allows students to form stronger links between the various chemical engineering sub-disciplines and
135
promotes a more autonomous learning experience. The evaluation mechanisms used to evaluate the development of
136
knowledge and know-how are summarized in Table 1. The practice section of the course is entirely evaluated using
137
rubrics, while the theory section is evaluated through traditional grading (though the final grade relies on a set
138
rubric). It is pertinent to note that rubrics are used throughout the curriculum: students are therefore accustomed to
139
knowing the evaluation criteria beforehand to better understand the instructor’s requirements.
140
141
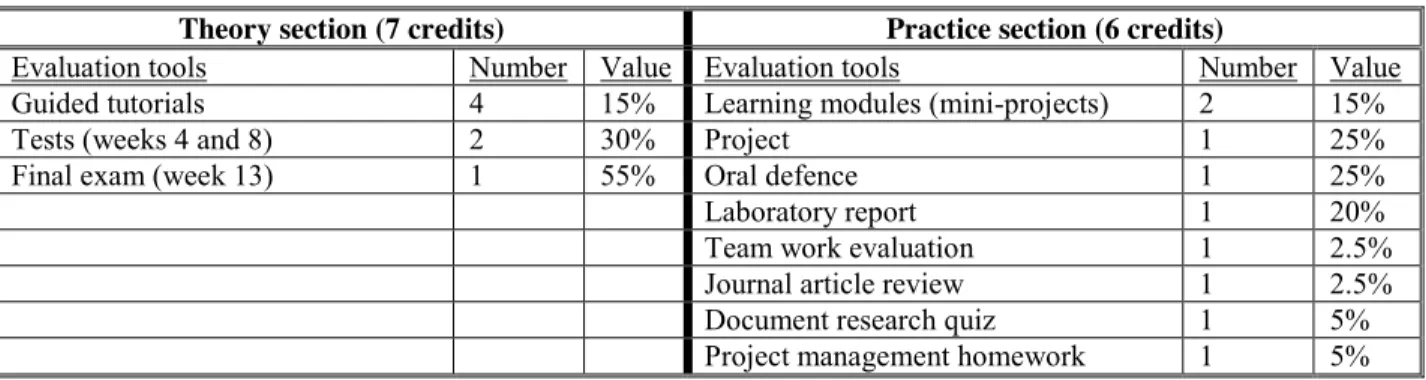
Table 1 – Evaluation mechanisms in Unit Operations
143
Theory section (7 credits) Practice section (6 credits)
Evaluation tools Number Value Evaluation tools Number Value Guided tutorials 4 15% Learning modules (mini-projects) 2 15%
Tests (weeks 4 and 8) 2 30% Project 1 25%
Final exam (week 13) 1 55% Oral defence 1 25%
Laboratory report 1 20%
Team work evaluation 1 2.5% Journal article review 1 2.5% Document research quiz 1 5% Project management homework 1 5%
144
1.4 Literature survey
145
1.4.1 Importance for students
146
For students, the class average for an exam or a quiz is generally regarded as a welcome piece of information. It is
147
used to compare one’s own performance to that of the group, and thus serve as a ranking tool. While it is
148
appreciated, students may not need it to form a reference framework. Skaalvik and Skaalvik (2002) put forth that
149
students are able to instinctively formulate both internal and external markers for comparison. External markers
150
include their school’s ranking or reputation, the class average (from previous years), or comments from instructors or
151
from particular students in or out of their class, such as students that often answer questions in lectures or those who
152
take the longest to complete a test. Internal markers will vary from student to student and may include their own
153
absolute performance in other classes or fields of study, their relative performance with respect to specific learning
154
objectives, their perception of a given field of study over time, and the amount of time and effort attributed to a given
155
course. The authors even speculate that divulging the average may be detrimental to certain students’ self esteem
156
(note: averages are not typically divulged in Scandinavian countries, where the Skaalvik and Skaalvik (2002) study
157
was conducted).158
159
1.4.2 Gender differences160
Students generally tend to overestimate their performance (Wesp et al., 1996). However, looking more closely,
161
several studies have determined that success is indeed perceived differently between males and females: whereas the
162
males tend to overestimate their degree of success, females underestimate their performance. While it is quite clear
163
that general intelligence is not a gender trait (Colom et al., 2000), the reason behind the perception bias remains
164
unclear. Some studies explain this through differences in personalities in a given population (Soh and Jacobs, 2013;
165
Oren, 2012): self-reported introvert students are generally better able to predict their performance on a given task,
166
whereas their more extrovert counterparts would overestimate performance for the same task. The personality traits
167
related to extrovert behavior tend to be more prevalent in males than females.
168
169
Others evoke the remnants of ancient stereotypes that may influence how men and women self-evaluate their
170
position in a group (Syzmanowicz and Furnham, 2011; Beloff, 1992). The Syzmanowicz and Furnham (2011)
171
analysis examined self-evaluation results on a wide range of topics, including general intelligence, mathematics and
logic, spatial reasoning and verbal intelligence. Aside from verbal intelligence, men tend to overestimate their
173
abilities in all other categories. However, this study did not account for the individuals’ age, which may play a part in
174
the prevalence of certain stereotypes. On the other hand, one recent study conducted in an engineering design course
175
demonstrated that there is no significant difference between the self-evaluation of male and female students (Van
176
Tyne, 2011). This is further corroborated by a more wide ranging study conducted by Tariq and Durrani (2011). Van
177
Tyne hypothesizes that this result is directly correlated to the fact that the students polled were in science,
178
technology, engineering and mathematics (STEM) fields; in other words, if a female student enrolls in a traditionally
179
male-oriented field, she is likely to have higher self-confidence and, thus, a better handle on her own abilities. It may
180
also be that engineering students tend to be more realistic or quantitative than the general population.
181
182
1.4.3 Optimism and evolving perceptions
183
Students that are optimistic with respect to their studies generally have a more positive outlook on evaluations and
184
their ability to control outcomes (Hall et al., 2006; Ruthig et al., 2009; Perry, 1991; Ackerman and Wolman, 2007).
185
This positive outlook is also related to their ability to predict academic success, and more generally, to attain actual
186
academic success (Chemers et al., 2001). Moreover, Ruthig et al. (2009) demonstrated that students’ optimism and
187
perception of control did not appear to evolve over the course of a semester, regardless of the feedback received after
188
evaluations. However, there does appear to be an evolution of this optimism before and after a given exam: students
189
overestimate their result before a quiz, but their predictions tend to be closer to reality immediately afterwards
190
(Shepperd et al., 1996). Wolf (2007) would argue that the aim of providing feedback through evaluations is to ensure
191
that students are able to gradually improve their performance over the course of a semester. As a result, if their
192
performance perception mechanisms remain constant, one would expect their predictions to evolve over time.
193
194
1.5 Study objectives
195
Through the present study, we will learn more about how undergraduate Chemical Engineering students at
196
Polytechnique Montreal perceive averages and performance. Specifically, we will determine if:
197
- Divulging the average in an outcomes-based course is a useful pedagogical feedback tool;
198
- Students are able to adequately evaluate and predict their performance in a core chemical engineering class.
199
200
2. Method
201
The study took place over the course of 2 semesters (Fall 2012 and Winter 2013) in the third-year unit operations
202
course and involved a total of 56 students (26 males, 30 females). Students received a detailed presentation about the
203
study, were informed that the class average would not be divulged by any instructor over the course of the semester,
204
and were required to sign an informed consent sheet to participate. The participants were then required to fill out
205
seven questionnaires over the course of the semester:
206
- A prediction sheet during the first week of class, in which they are asked to determine which grade they
207
expect to receive for the class, as well as their opinion on the importance of class averages as a learning
208
tool;
- Three pre-exam prediction forms handed to them in the week preceding a test (2 tests, 1 final exam), in
210
which they are asked to predict their grade and the class average, as well as their general feelings about the
211
test;
212
- Three post-exam prediction forms handed to them immediately after completing a test (2 tests, 1 final
213
exam), identical to the pre-exam forms (with one exception – the final questionnaire included one extra
214
question pertaining to their appreciation of the experience).
215
216
It is pertinent to note that, despite the total sample size of 56 students, students did not systematically answer all
217
questionnaires for a variety of reasons (absent from class, time restrictions after tests, partially filled forms, etc.). The
218
retained sample size is indicated accordingly in the results section.
219
220
3. Results and discussion
221
3.1 Average as a pedagogical tool
222
Third-year students were asked to provide their opinion with respect to several statements pertaining to evaluations
223
and, more specifically, how they feel about averages during the first week of classes (Table 2). While students tend
224
to award a fair level of importance to the average (#1, 88% agreement), there is a split concerning its use as a
225
pedagogical tool: 43% of students will not use this data to plan study time allotments for subsequent test (#2).
226
Students generally seem to feel that their grade is typically representative of their level of understanding (#3, 73% in
227
agreement) and that an above-average grade (#4), specifically a grade significantly exceeding the average (#5) is
228
indicative of their performance. Statement #6 indicates that another, more personal metric (“feeling that I’ve learned
229
something”) could provide an alternative to the average as a pedagogical tool, and it seems to be less rooted in
230
comparisons to others (though 64% still agree with statement #7).
231
232
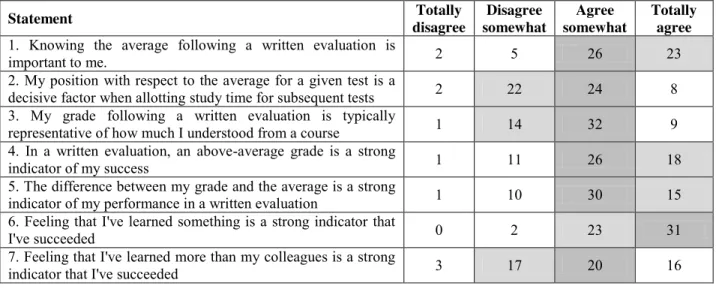
Table 2 – Number of students in agreement with statements pertaining to evaluations and averages (N = 56).
233
Top two answers are shaded, most popular answer is darkest.
234
Statement Totally disagree Disagree somewhat Agree somewhat Totally agree1. Knowing the average following a written evaluation is
important to me. 2 5 26 23
2. My position with respect to the average for a given test is a
decisive factor when allotting study time for subsequent tests 2 22 24 8 3. My grade following a written evaluation is typically
representative of how much I understood from a course 1 14 32 9 4. In a written evaluation, an above-average grade is a strong
indicator of my success 1 11 26 18
5. The difference between my grade and the average is a strong
indicator of my performance in a written evaluation 1 10 30 15 6. Feeling that I've learned something is a strong indicator that
I've succeeded 0 2 23 31
7. Feeling that I've learned more than my colleagues is a strong
indicator that I've succeeded 3 17 20 16
235
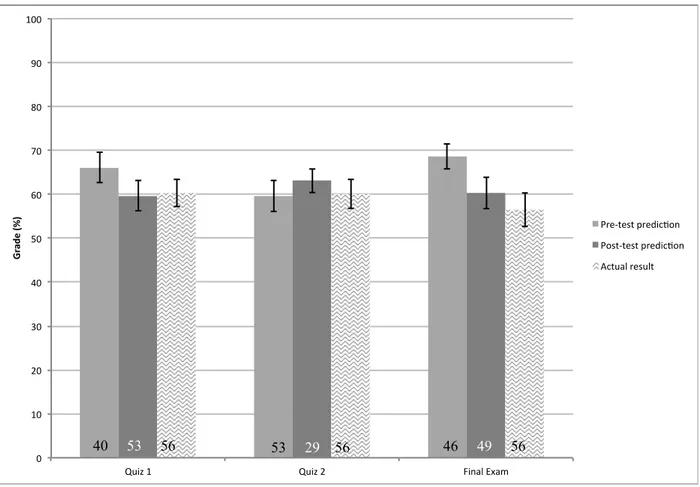
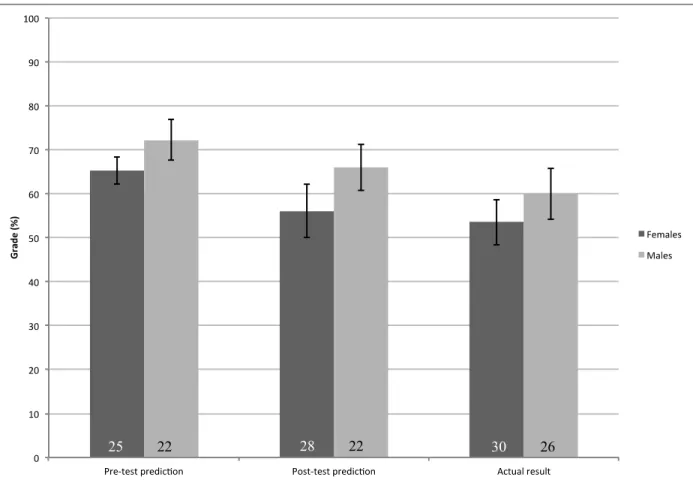
3.2 Student predictions
Figure 1 compares the average of students’ individual pre- and post-test predictions to their actual results, for all the
237
evaluations made during the semester. The error bars shown represent the 95% confidence interval, thus providing
238
information with respect to the spread of the data. Furthermore, although the data is not shown, the students’
239
predictions of the class average show no statistical difference with respect to the actual computed average for all
240
three evaluations (Student t-test with α = 0.05). In a sense, this is expected, given that the class averages for this
241
particular course has remained relatively unchanged over the past decade, and this cohort of students has studied
242
together for three years. The Figure 1 results could be interpreted as evidence that students are able to adequately
243
predict their performance in an evaluation, and remain consistent in that ability throughout the course of the semester
244
(except in the case of the pre-test prediction for the final exam, which appear overestimated). If this is indeed the
245
case, it implies that their alternative frames of reference, possibly formed through the first two years of the
246
undergraduate curriculum, are sufficient and do not degrade as a result of not receiving class averages.
247
248
[Figure 1 about here]
249
250
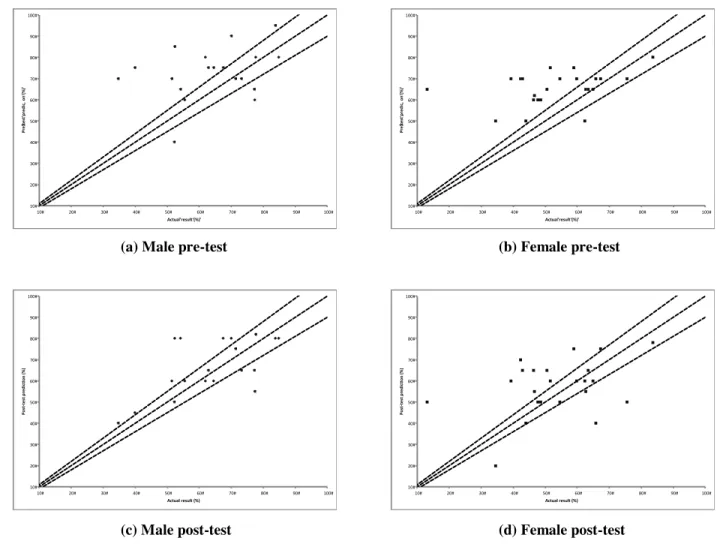
However, plotting individual actual results against predictions for the final exam (test with the largest amount of
251
complete prediction data) nuances this conclusion (Figure 2). Indeed, Figures 2a and 2b show that approximately two
252
thirds of both male and female students are well outside of the +/- 10% margin to have their pre-test predictions
253
considered as adequate (13 out of 19 males and 16 out of 23 females are incorrect – N=42). Moreover, both male and
254
female students seem to share a pre-test optimism: most over-predict their performance by a wide margin. This level
255
of over-prediction diminishes slightly when asked after the test (Figures 2c and 2d): 9 out of 19 males and 10 out of
256
23 females fall within the +/- 10% range. The data spread is also noticeably reduced (especially on the male side) and
257
more symmetrical for post-test results. These individual results re-orient the conclusion stemming from Figure 1:
258
students are capable of predicting the class average, but have greater difficulty predicting their own grade. In other
259
words, students do not appear to be able to correctly self-assess their performance. If they were, some of them could
260
use this information as a replacement for the average as a feedback tool and thus adjust their study patterns for the
261
next assessment (as noted in Table 2, statement #2, over 40% of students would not see this as a useful study tool).
262
263
[Figure 2 about here]
264
265
In order to assess any gender-based effects, average performances by gender are plotted in Figure 3. Although upon
266
first inspection, gender split results for the final exam seem to show a slight trend in agreement with the thesis
267
brought forward by Syzmanowicz and Furnham (2011) whereby men tend to overestimate their capabilities,
268
statistical analysis clearly demonstrates overlap in the confidence interval (Student t-test with α = 0.05). In other
269
words, the results are more in line with the observations made by Van Tyne et al. (2011): women enrolled in an
270
engineering degree show no significant difference in estimating their capabilities compared to men. This is
271
confirmed in part by the results from Figure 2 – there are not noticeable differences between male and female
272
students when inspecting individual prediction results.
[Figure 3 about here]
275
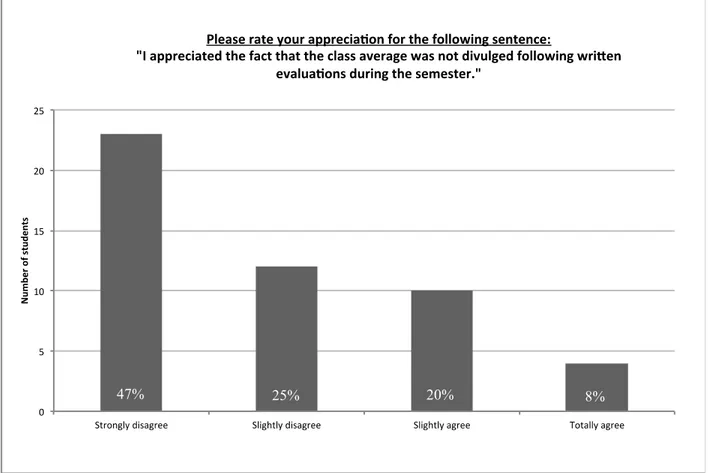
276
Finally, student appreciation is quantified in Figure 4: when asked to rate the experience of not receiving the class
277
average after a test over the course of a semester, the overwhelming majority indicated that they disliked the
278
experience. This serves to indicate that students are quite set in their ways: they are not comfortable with loosing a
279
quantitative frame of reference they have received throughout their studies (typically from high school onwards). It is
280
pertinent to observe that 28% of students surveyed did appreciate the experience – these students correlate almost
281
perfectly with those who indicated for statement #1 in Table 2 that knowing the class average was not particularly
282
important to them, and show fair agreement (approximately 2/3) with the students who disagreed that their grade
283
reflects their level of understanding (statement #3). In other words, students who normally rely on internal signals for
284
motivation are not affected by external signals. It should further be noted that no negative pedagogical bias was
285
observed: class averages and grade distributions were well in line with historical values for the course (data not
286
reported). Therefore, not receiving the average following evaluations does not appear to have negatively (or
287
positively) impacted learning.
288
289
[Figure 4 about here]
290
291
4. Conclusions
292
This study has explored the necessity of divulging class averages for evaluations conducted in an outcomes-based
293
class. The literature survey indicated that, for the most part, students form multiple frames of reference and should
294
not be affected by the loss of a single one, such as the class average. An experimental investigation conducted over a
295
full year has shown partial agreement with these results: students are able to adequately predict their peers’
296
performance (class average), though they have greater difficulty in predicting their individual performance. Further
297
questioning reveals that, while students do not necessarily use the class average as a pedagogical feedback to allot
298
study time and rather rely on their personal level of satisfaction with learning as a performance indicator, they are
299
significantly dissatisfied when this information is withheld.
300
301
Thus, based on this limited study, instructors teaching within a competence-based framework may likely safely
302
withhold class averages, as it does not appear to be a necessary pedagogical tool. However, this should be done in
303
accordance with a clear curriculum progression (gradually moving away from divulging class statistics, moving
304
towards individual indicators) and through open discussion with the students to clarify why the information is being
305
withheld (aligning with the industrial reality where salary and other employment considerations are based upon
306
individual performance, not a comparison to averages). This will help avoid overwhelming dissatisfaction and
307
contributing to additional stress to the students.
308
309
310
311
Acknowledgments312
The authors acknowledge the moral support of Polytechnique Montreal’s Department of Chemical Engineering and,
313
specifically, the professors involved in teaching the Unit Operations class (Profs. Charles Dubois, Danilo Klvana,
314
Michel Perrier, Abdellah Ajji and François Bertrand), as well as instructors and participating students. Further, we
315
acknowledge the support of the Polytechnique Montreal ethics in research committee for approval of this study
316
conducted on human subjects (certificate number CÉR-11/12-28).
317
318
References
319
Ackerman, P., Wolman, S., 2007. Determinants and validity of self-estimates of abilities and self-concept
320
measures. Journal of Experimental Psychology, 57-78.
321
Beloff, H., 1992. Mother, father, and me: Our IQ. The Psychologist, 309-311.
322
Chemers, M., Hu, L., Garcia, B., 2001. Academic self-efficacy and first-year college student performance and
323
adjustment. Journal of Educational Psychology, 55-64.
324
Colom, R., Juan-Espinosa, M., Abad, F., Garcia, L., 2000. Negligible sex differences in general intelligence.
325
Intelligence, 57-68.
326
Hall, N.C., Perry, R.P., Chipperfield, J.G., Clifton, R.A., Haynes, T.L., 2006. Enhancing primary and secondary
327
control in achievement settings through writing-based attributional retaining. Journal of Social and Clinical
328
Psychology, 361-391.
329
Huba, M.E., Freed, J.E., 2000. Learner-Centered Assessment on College Campuses: Shifting the Focus from
330
Teaching to Learning. Allen & Bacon, Boston.
331
Oren, F.S., 2012. The effects of gender and previous experience on the approach of self and peer assessment: a
332
case from Turkey. Innovations in Education and Teaching International, 123-133.
333
Perry, R., 1991. Perceived control in college students: Implications for instruction in higher education, in: Smart,
334
J. (Ed.) Higher Education: Handbook of theory and research, 7, 1-56.
335
Prégent, R., Bernard, H., Koznitis, A., 2009. Enseigner à l’université dans une approche-programme. Presses
336
Internationales Polytechnique, Montreal.
337
Roegiers, X. (2000). Une pédagogie de l’intégration. Compétences et intégration des acquis dans
338
l’enseignement. De Boeck Université, Bruxelles.
339
Ruthig, J., Hanson, B., Marino, J., 2009. A three-phase examination of academic comparative optimism and
340
perceived academic control. Learning and Individual Differences, 435-439.
341
Scallon, G., 2004. L’évaluation des apprentissages dans une approche par compétences. Montreal: ERPI.
342
Shepperd, J.A., Ouellette, J.A., Fernandez, J.K., 1996. Abandoning unrealistic optimism: Performance estimates
343
and the temporal proximity of self-relevant feedback. Journal of Personality and Social Psychology, 70(4),
844-344
855.
345
Skaalvik, E.M., Skaalvik, S., 2002. Internal and external frames of reference for academic self-concept.
346
Educational Psychologist, 37(4), 233-244.
347
Soh, L., Jacobs, K.E., 2013. The biasing effect of personality on self-estimates of cognitive abilities in males and
348
females. Personality and Individual Differences, 24, 141-146
349
Stevens, D.D., Levi, A.J., 2005. Introduction to Rubrics: An Assessment Tool to save grading time, convey
350
effective feedback and promote student learning. 2nd edition, 232 pp., Stylus Publishing LLC, Sterling, Virginia.
351
Syzmanowicz, A., Furnham, A., 2011. Gender differences in self-estimates of general, mathematical, spatial and
352
verbal intelligence: Four meta-analyses. Learning and Individual Differences, 21(5), 493-504.
353
Tardif, J. (2006). L’évaluation des compétences : Documenter le parcours de la formation. Chenelière
354
Éducation, Montreal.
Tariq, V.N., Durrani, N., 2012. Factors influencing undergraduates' self- evaluation of numerical competence.
356
International Journal of Mathematical Education in Science and Technology, 43(3), 337-356.
357
Van Tyne, N., 2011. Gender differences in individual and teammate performance evaluations by students on
358
engineering design teams. American Society for Engineering Education, AC 2011-220.
359
Wesp, R., Montgomery, K., Jacobson, C., 1996. Students tend to overestimate their course performance.
360
Psychological Reports, 79(3), 864-866.
361
Wiggins, G., 1998. Educative assessment: Designing assessments to inform and improve student performance.
362
Jossey-Bass Publishers, San Francisco.
363
Wolf, P.J., 2007. Academic improvement through regular assessment. Peabody Journal of Education, 82(4),
364
690-702.
365
366
367
Figure 1: Averaged individual student performance predictions compared to actual test results for each written
368
examination in the semester (errors bars represent the 95% confidence interval, numbers at the bottom of the bars
369
represent the sample size).
370
371
46 49 56 40 53 56 53 29 56
"
$(#"
!"# $"# %"# &"# '"# ("# )"# *"# +"# !""# !"# $"# %"# &"# '"# ("# )"# *"# +"# !""# !" #$ %# &% '( "# )* +, -. '/0 1' 2+%345'"#&35%'/01' !"# $"# %"# &"# '"# ("# )"# *"# +"# !""# !"# $"# %"# &"# '"# ("# )"# *"# +"# !""# !" #$ %# &% '( "# )* +, -. '/0 1' 2+%345'"#&35%'/01'$($"
(a) Male pre-test (b) Female pre-test
$(%"
$(&"
!"# $"# %"# &"# '"# ("# )"# *"# +"# !""# !"# $"# %"# &"# '"# ("# )"# *"# +"# !""#"
!"# $"# %"# &"# '"# ("# )"# *"# +"# !""# !"# $"# %"# &"# '"# ("# )"# *"# +"# !""#$('"
(c) Male post-test (d) Female post-test
$(("
$()"
Figure 2: Visual comparison of performance predictions vs actual results for the final exam - (a) pre-test predictions,
$(*"
males; (b) pre-test predictions, females; (c) post-test predictions, males; (d) post-test predictions, females. Dashed
$)+"
lines show slopes of 0.9, 1 and 1.1 respectively. (N = 42).
382
Figure 3: Average student performance predictions split by gender for the final exam (errors bars represent the 95%
383
confidence interval, numbers at the bottom of the bars represent the sample size).
384
385
Figure 4: Students’ appreciation concerning the non-disclosure of class averages over the course of the semester (N
386
= 49).