Dependence of Transuranic Content in Spent Fuel on Fuel Burnup by
Drew A. Reese
Submitted to the Department of Nuclear Engineering in partial fulfillment of the requirements for the degree of
Bachelor of Science in Nuclear Science and Engineering at the
Massachusetts Institute of Technology. June 2007
©2007 Drew Reese. All rights served.
The author hereby grants to MIT permission to reproduce and to distribute publicly paper and electronic copies of this thesis document in whole or in part in any medium now
known or hereafter created.
Signature of Author Certified by Accepted by 1MASACHUSmS #E8trUT OF TECHNOLOGY
OCT 1 2 2007
LIBRARIES
Department of Nuclear Engineering May 9, 2007
Mujid Kazimi
TEPCO Professor of Nucle lence and Engineering Thesis Supervisor
-TN-David G. Cory Chairman, NSE Committee for Undergraduate Students
Dependence of Transuranic Content in Spent Fuel on Fuel Burnup by
Drew Reese
Submitted to the Department of Nuclear Science and Engineering on May 9, 2007 In partial fulfillment of the Requirements for the Degree of
Bachelor of Science in Nuclear Science and Engineering
ABSTRACT
As the increasing demand for nuclear energy results in larger spent fuel volume, implementation of longer fuel cycles incorporating higher burnup are becoming common. Understanding the effect of higher burnup on the spent fuel composition and radioactive properties is essential to ensure that spent fuel receives proper cooling in storage before it is sent to a disposal site or proper treatment and reprocessing if its useful content is to be extracted prior to disposal. Using CASMO-4, a standard Westinghouse 4-loop pressurized water reactor model was created and simulated with a three batch fuel cycle.
U-235 enrichment was adjusted to achieve fuel burnups of 30, 50, 70 and 100 MWD per kg of initial uranium. These burnups demanded reload enrichments of 3.15%, 4.63%, 6.26% and 9.01% U-235 w/o respectively. The resultant spent fuel transuranic isotopic
compositions were then provided as input into ORIGEN to study the decay behavior of the spent fuel. It was found that when burnup increased from 30 MWD/kg to 100
MWD/kg, the activity more than doubled due to the decreased Pu-241 content and the
increased Np-239 presence. More importantly, the activity per MWD significantly decreased despite absolute increases in unit mass. The net result is that the half-life of high burnup fuels is greatly increased in comparison to low burnup fuels for the first decade of life. Beginning from day 14 after shutdown and until 10 years later, the 100
MWD/kg fuel has a half-life of 129 days while the 30 MWD/kg spent fuel has a half life
of 5 days. Previous work has suggested that different trends dominate decay behavior from years 10 to 100 years following discharge.
Thesis Supervisor: Mujid Kazimi
Acknowledgements
I'd like to acknowledge:
Professor Mujid Kazimi, for agreeing to supervise my research.
My CASMO go-to guy, Tyler Ellis, who showed me how to use it and understand it. Dr. Ed Pilat, who spent many hours with me reviewing CASMO output and instructing me on commercial reactor fuel cycles.
Nicephore Bonnet, who gave me great help in the 11 h hour in ORIGEN work.
Dr. Youssef Shatilla, who painstakingly proofread my drafts, forgave me when I forgot to save my changes, and also guided my analysis.
Table of Contents
INTRODUCTION ... 7
1.1 U-235... ... 8
1.2 BURNUP EFFECTS ON THE FUEL CYCLE... 9
1.3 ORGANIZATION OF W ORK ... .... ... 11 2 PW R M ODEL ... 12 2.1 W ESTINGHOUSE 4-LOOP PW R ... 12 2.2 CASM O-4 ... 15 2.2.1 M odeling Assumptions ... 15 3 RESULTS ... 16 3.1 FUEL ENRICHMENTS... 16
3.2 DISCHARGE FUEL COMPOSITION ... ... 16
3.3 SPENT FUEL DECAY ... 20
3.4 PROLIFERATION RESISTANCE AND BURNUP ... ... 30
4 SUM M ATION OF W O RK ... 32 5 REFERENCES ... 33 APPENDIX A ... 34 APPENDIX B ... ... 37 APPENDIX C ... ... 40 APPENDIX D ... ... 44 APPENDIX E... 48
List of Figures
FIGURE 1: OUTLOOK FOR WORLD ENERGY SUPPLY AND DEMAND BY FUEL [2] ... 7
FIGURE 2: PROJECTED GROWTH OF PRIMARY ENERGY DEMAND BY REGION FROM 2000-2030 IN "MILLION TONS OF OIL EQUIVALENT" (M TOE) [2]... ... 7
FIGURE 3: HISTORICAL TREND OF BURNUP BY COUNTRY [6. ... ... 9
FIGURE 4: A DEPICTION OF THE HISTORICAL MARKET TREND OF URANIUM PRICING AND ITS FUTURE PROJECTION [7]. THE RED ARROWS AT RIGHT INDICATE EXPECTING SKYROCKETING OF COSTS IN THE NEAR FUTURE... 9
FIGURE 5: CORE CROSS SECTION WITH CONTROL RODS (XU, 2003, FIGURE 2.2)... 13
FIGURE 6: AVERAGE CORE BURNUP VS. U-235 ENRICHMENT... 16
FIGURE 7: DECAY OF TRANSURANICS IN SPENT FUEL BY BURNUP AS FUNCTION OF TIME AFTER SHUTDOWN. 26 FIGURE 8: DECAY OF TRANSURANICS IN SPENT FUEL BY BURNUP FROM 10 TO 350 YEARS AFTER SHUTDOWN. ... ... ... ... ... 26
FIGURE 9: TOTAL RADIOACTIVITY BY BURNUP VERSUS TIME AFTER DISCHARGE [6]. ... 28
FIGURE 10: RADIOACTIVITY PER MWD AT 0 DAYS AFTER SHUTDOWN ... 29
FIGURE 11: RADIOACTIVITY PER MWD AT 14 DAYS AFTER SHUTDOWN ... 29
FIGURE 12: RADIOACTIVITY PER MWD AT 100 DAYS AFTER SHUTDOWN ... 30
FIGURE 13: U-235 V. BURNUP ... 44
FIGURE 14: FISSIL E PU v. BURNUP ... 44
FIGURE 15: U -236 V. BURNUP... ... 45
FIGURE 16: NP-237 v. BURNUP ... 45
FIGURE 17: AM-241 V. BURNUP ... 46
FIGURE 18: CM-242 v. BURNUP ... 46
FIGURE 19: CM-244 V. BURNUP ... 47
FIGURE 20: CS-137 v. BURNUP ... 47
List of Tables TABLE 1: OPERATING PARAMETERS OF THE WESTINGHOUSE STANDARD 4-LOOP LWR... 13
TABLE 2: BURNUP CURVES FOR TARGET DISCHARGE. ... ... 15
TABLE 3: CASMO-4 PARAMETERS FOR CALCULATIONS ... ... 15
TABLE 4: U-235 ENRICHMENTS TO ACHIEVE TARGET DISCHARGE BURNUP. ... 16
TABLE 5: CONTENT OF 30 MWD DISCHARGED FUEL (AVERAGED NUMBER DENSITIES). ... 17
TABLE 6: CONTENT OF 50 MWD DISCHARGED FUEL (AVERAGED NUMBER DENSITIES). ... 18
TABLE 7: CONTENT OF 70 MWD DISCHARGED FUEL (AVERAGED NUMBER DENSITIES). ... 19
TABLE 8: CONTENT OF 100 MWD DISCHARGED FUEL (AVERAGED NUMBER DENSITIES). ... 20
TABLE 9: TOTAL ACTIVITY OF TRANSURANICS BY BURNUP AND TIME AFTER SHUTDOWN ... 21
TABLE 10: CONTRIBUTION TO TOTAL ACTIVITY BY ISOTOPE FOR 30 MWD SPENT FUEL; SUM MAY NOT ADD UP TO 100% AS ONLY ACTINIDES ARE INCLUDED HERE. ISOTOPES THAT EXPERIENCE DRAMATIC CHANGE ARE BOLDED. ... 22
TABLE 11: CONTRIBUTION TO TOTAL ACTIVITY BY ISOTOPE FOR 50 MWD SPENT FUEL; SUM MAY NOT ADD UP TO 100% AS ONLY ACTINIDES ARE INCLUDED HERE. ISOTOPES THAT EXPERIENCE DRAMATIC CHANGE ARE BOLDED. ... 23
TABLE 12: CONTRIBUTION TO TOTAL ACTIVITY BY ISOTOPE FOR 70 MWD SPENT FUEL; SUM MAY NOT ADD UP TO 100% AS ONLY ACTINIDES ARE INCLUDED HERE. ISOTOPES THAT EXPERIENCE DRAMATIC CHANGE ARE BOLDED. ... 24
TABLE 13: CONTRIBUTION TO TOTAL ACTIVITY BY ISOTOPE FOR 100 MWD SPENT FUEL; SUM MAY NOT ADD UP TO 100% AS ONLY ACTINIDES ARE INCLUDED HERE. ISOTOPES THAT EXPERIENCE DRAMATIC CHANGE ARE BOLDED ... ... 25
TABLE 14: SPENT FUEL HALF LIVES BY BURNUP ... 27
TABLE 15: ACTIVITY PER MWD BY TIME AFTER SHUTDOWN AND BURNUP ... 29
TABLE 16: PERCENT INCREASE OF SELECT ISOTOPES FROM 30 TO 100 MWD. ... 31
TABLE 18: DETAILED ISOTOPIC COMPOSITION OF 50 MWD DISCHARGED FUEL ... 49 TABLE 19: DETAILED ISOTOPIC COMPOSITION OF 70 MWD DISCHARGED FUEL ... 51 TABLE 20: DETAILED ISOTOPIC COMPOSITION OF 100 MWD DISCHARGED FUEL ... 52
1
Introduction
Today, over 85% of the world energy supply is produced from fossil fuel sources (Figure 1). As development and modernization continue to take hold in the coming decades, the global energy demand is projected to increase by 6088 Mtoe by the year 2030 (Figure 2). Already, the use of fossil fuels in global industrialization has increased the atmospheric CO2 concentration from about 280 ppmv in the 1800s to over 367 ppmv in 1999 [1]. As
this increase in greenhouse gases and alarming trends such as global warming become increasingly linked, it becomes more and more imperative that cleaner sources of reliable energy be developed and implemented.
(Mtoe)
iS00 . I Renew ableEnerav etc. I. . . .. . . ..
-
Hyd 16000 . I Nuc SNab 14000 oil Coa 12000 ... 10000 8000 ... 6000 29t ' . * I E 2 4000 2 2000 - 0-H Ni* -dFigure 1: Outlook for world energy supply and demand by fuel [2].
Middle mist Af'rca Latin Amerl=c Asia (excluding China) China Former USSR fetc.
OECD
-
372434 '
549
Overall world increase
6,s088Mtoe
(increasing Main Bunker 41 Mtoe)
I
I
Total for
Ai 2,4020 200 400 600 $00 1000 1200 1400 1600 1800
Figure 2: Projected growth of primary energy demand by region from 2000-2030 in "million tons of oil equivalent" (Mtoe) [2].
One of these sources is nuclear energy. Already nuclear energy has played a significant role in global energy production since its inception in 1951 at the EBR-1 experimental
o
· 1 r · r t· .
station. As of January 2006, 441 online nuclear power reactors worldwide produced 17% of the world's electricity [3]. The 103 operational plants of the U.S. nuclear fleet alone generate 21% of the nation's electricity and provide the nation's second-largest energy source after coal [4]. Although interest in nuclear energy in the U.S. ebbed amidst public fears after the Three Mile Island accident, it has been revived both domestically and abroad as a potential source of safe, cheap energy. In 2000, the Generation IV International Forum was established to galvanize the further development of nuclear energy technology. The forum's primary objectives are to advance nuclear safety while generating competitively priced energy, minimizing waste and optimizing the utilization of resources. To this end, thirty-two new plants are currently in construction overseas and licenses for new construction have been obtained in the United States [5]. The
nuclear industry still faces many challenges to increasing its market share despite these advances. The cost of a nuclear power plant is prohibitive. Fissile U-235 for fuel is scarce. The potential for nuclear weapon creation using fissile uranium and plutonium isotopes in spent fuel is fearful. The processing and disposal of the resulting radioactive waste is a lengthy, underdeveloped process. Central to these concerns is U-235, both its cost and its role in the fuel cycle.
1.1
U-235
Uranium oxide, UO2, is the primary fuel for most operating LWRs. Natural uranium's composition makeup is characterized as a combination of fertile and fissile material
-99.2745% fertile U-238 and 0.72% fissile U-235. Enrichment of U-235 in UO2 fuel is the
primary determinant in the power generation capabilities of the fuel and of the fuel's total cost. Historically, uranium has been cheap enough that high energy recovery per unit mass of fuel, or burnup, has not been a design priority in reactors. The extra enrichment necessary to achieve higher burnups has typically been in excess of the economic
advantage of smaller fuel requirements. As a result, the average UO2 fuel enrichment has
increased only slowly from 2.5 w/o to the current average of 4 w/o over a period of more than 20 years. NRC regulations currently mandate a ceiling of 5 w/o enrichment. Fuel burnups have correspondingly increased from roughly 30 MWd to 50 MWd (Figure 3).
45600 40000 36000 36000 15000 100o 1980 1982 1984 196 198o 190 1983 194 1996 196B 2000
Figure 3: Historical trend of burnup by country [6].
Recent economic turbulence has spurred new interest in these increasing burnup trends. Uranium market prices have more than quadrupled over the past three years (Figure 4) to $132.28/kg as of October 2006 [7]. While uranium deposits of both low and high grade are still fairly plentiful, the time from exploration to production of a mine is close to 10 years. Considering the planned worldwide expansion of nuclear power, it is likely that increased fuel burnups will become a favorable economic factor in reactor performance as well as a factor in the sustainability of the nuclear industry as a whole.
uIS I Poumd Us See 'go $40 See$ $0 $30 $s 'U $0 mn J an Jn Jn mn m im Jm Jn Jan IM I M mI I so I Mi 4s1M I Ms I M I n aI
Figure 4: A depiction of the historical market trend of Uranium pricing and its future projection [7]. The red arrows at right indicate expecting skyrocketing of costs in the near future.
1.2
Burnup Effects on the Fuel Cycle
Fuel burnup is a measure of thermal energy output per unit mass of fuel. The primary motivation to increase burnup is an economical one. The three main costs of nuclear
energy generation are generally categorized as: non-fuel operation and maintenance 0 W-Eaebp.+France B S W-Eu1ape- Frlne A USA I I i I I I I I I I l i I I I M 0LI0I
costs; capital investment; fuel. Nuclear fuel cost is the least significant source of cost but the main strategy for its reduction is straightforward - increased burnup. Three common strategies for implementing high burnup are:
Reduction of the number of refueling operations and improving the availability of the reactor; typically this is achieved by increasing the cycle length. Optimization of fuel utilization over the cycle, thereby reducing the quantity of fuel needed and the cost of spent fuel processing. Increase in the plant power rating to generate more revenue per cycle.
Current fuel management practices employ up to three zonal enrichments to flatten the power peaking. At the end of a cycle, the batch with the lowest enrichment (for the first
cycle) or the batch with the longest in-reactor time/highest burnup is removed. The remaining assemblies are shuffled and new fuel placed at the peripherals of the core.
Depending on the length of the fuel cycle and fraction of assemblies replaced per reloading, assemblies can be expected to remain in the core for several years. Annual reloading with 1/3 core removal has been commonplace, but 18- or 24-month cycles have been gaining in popularity as average burnups have increased.
Primary factors in the achievement of high burnups include fuel element performance, time-dependent power capability, and licensing limits on fuel enrichment. In all three burnup strategies aforementioned, the assemblies are either subjected to radiation for increased periods of time or radiated at higher intensities. Accordingly, higher burnup cycles require increased fuel element performance as compared to lower burnup cycles. Fuel element failure likelihood increases as the clad experiences fatigue and becomes embrittled over time. Fission gas product accumulation with the fuel pins increases directly with increased burnup. The fission product content of a high burnup spent fuel assembly will be increased, bringing a new importance to the creation of a long-term national solution to radioactivity waste disposal.
Safe development and implementation of expanded burnup does have the potential to broaden the spectrum of development opportunities for nuclear energy. The Generation IV initiative requires new reactors to employ higher burnups as a matter of course; compliance could aid in successful construction of the first new reactor in decades in the United States. Extended burnups are also a common trait of a new planned fleet of small reactors -Westinghouse, among others, is currently developing the IRIS modular reactor for deployment in remote areas. IRIS features a core life of up to 8 years through extended burnup and enrichment levels on the order of 7 w/o [8]. It would generate between 100 to 300 MWe at a competitive cost of $1000 per kilowatt, providing a feasible energy alternative in less developed areas. Extended burnup can also reduce the volume of waste produced per cycle at a fixed power rating. This is a particularly significant benefit for reactors in the U.S. as it reduces on-site dry storage needs; for countries charging waste disposal on a kgU basis, backend fuel cycle costs are directly reduced by higher burnup implementation.
1.3
Organization of Work
Considering the advantages of burnup as well as the increasing trend of average burnup in reactors, the relationship between enrichment, burnup and transuranic content of spent fuel must be analyzed in depth in order to make informed policies concerning enrichment licensing limits, waste disposal and the economics of high burnup reactors. This purpose of this work is to create a database of the transuranic inventories of spent fuel assemblies that have experienced burnups of 30, 50, 70 and 100 MWd and analyze the activity properties of the spent fuel. The model will be taken from the Westinghouse 4-loop PWR, the properties of which are reviewed in Chapter 2. The CASMO-4 transport code package will be used for calculations; features of the code and development of the models are reviewed in Chapter 2. The transuranic inventories of the target burnups are detailed and analyzed in Chapter 3 along with a brief commentary on the implications and effects of high burnup. Complete code files for the work are included in the appendices.
2
PWR Model
As of January 2006, 103 nuclear reactors were online in the United States and providing 21% of the nation's electrical energy. The current Generation II and III fleet are licensed by the NRC to operate for 40 years with the possibility of renewing their licenses for an additional 20 years. Forty-eight plants have already received renewals, 8 have filed for renewal, and 26 more are expected to apply by 2015 [9]. The remaining plants are also expected to apply for license renewal in the near future. As these plants will continue to form the basis of the U.S. nuclear industry for the next decades, the most immediate
improvements in nuclear energy generation will be a result of upgrading and improving upon the technology and management practices of these plants. The most prevalent PWR design in use is the Westinghouse 4-loop 3411 MWth PWR; this will be taken as the reference for this work. Other reactor designs differ in detail but are neutronically similar. The important characteristics and parameters of the design are summarized in this section.
2.1
Westinghouse 4-loop PWR
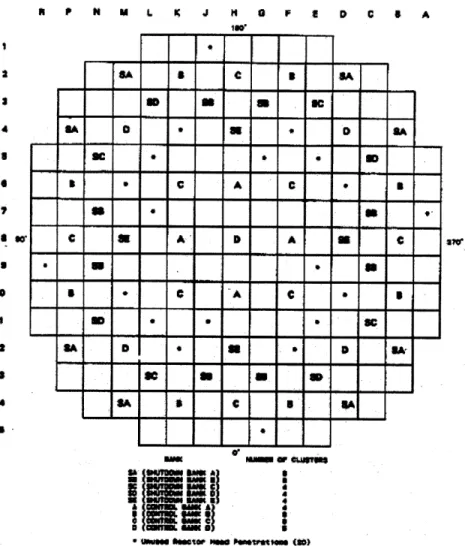
The Westinghouse 4-loop PWR utilizes a 17x17 fuel array. The core cross-section including control rods is shown in Figure 5. Operating parameters are given in Table 1.
f P N m B-·C IA SC U U11 S U-L K J H 0 F 1w" I D C s A OiD t r, 4 ID a U 4 U a C A ,O C- a-k ta (nsWr Usas
i
A Nol 9MUA S ma =-A D A ai A C: : : € -.. a a aFigure 5: Core cross section with control rods (Xu, 2003, figure 2.2).
I 4 U a 'I a .er U AC I € 9 VI 14
zr~
$A Table 1: Operating parameters of the Westinghouse standard 4- R
Operating Parameter Value
Plant
Number of primary loops 4
Total heat output of the core (MWth) 3411 Total plant thermal efficiency (%) 34 Electrical output of plant (MWe) 1150 Energy deposited in the fuel (%) 97.4 Energy deposited in the moderator (%) 2.6 Core
Core barrel inside/outside diameter (m) 3.76/3.87
Mass of fuel UO2 (MT) 101.0
Mass of fuel as U (MTU) 88.2
Mass of cladding material (MT) 23.1 Rated power density (kW/liter-core) 104.5
Specific power (kW/kgU) 38.7
4 - U a I U
---E 1:
9IC ID :1 -- ---nkC
~
...
w r --err I ... ... ... i III I I _IAverage linear heat generation rate (kW/ft) 5.6
Core volume (mi) 32.6
Primary Coolant
System pressure (MPa) 15.51
Total core flow rate (Mg/sec) 18.63
Effective core flow rate for heat removal (Mg/sec) 17.7
Rated coolant mass flux (kg/mz-sec) 2087.6
Core inlet temperature ("C) 292.7
Fuel Rods
Total number 50,952
Fuel density (% of theoretical) 94
Pellet diameter (mm) 8.19
Pellet height (mm) 13.4
Fuel-clad radial gap width (pm) 82
Cladding material Zircaloy-4
Cladding thickness (mm) 0.57
Clad outer diameter (mm) 9.5
Active fuel height (m) 3.66
Fuel assemblies (17x17 square lattice)
Number of assemblies 193
Number of fuel roads per assembly 264
Number of grids per assembly 7
Pin-to-pin pitch (mm) 12.6
Assembly pitch (mm) 214
Rod cluster control assemblies (RCCA)
Neutron absorbing material AG80-lnl5-Cd5
Cladding material SS 304
Cladding thickness (mm) 0.46
Number of RCAA clusters 53
Reactivity control is established through use of control rods, soluble poison and burnable poison. The control rods are classified as either control banks or shutdown banks. It should be noted that control rods are referred to as rod cluster control assemblies
"RCCA" in Table 1. The typical control rod composition is an Ag-In-Cd alloy. The default case for simulations performed in this work is the full withdrawal of all control
rods.
Soluble poison in the primary loop coolant moderates long-term fuel burnup effects. The poison is usually boric acid H2BO3, where boron refers to natural boron (18.3 wt% B-10,
81.7% B-11). Because of water chemistry and the positive effect of boron on the moderator temperature coefficient, the poison concentration should be limited. Previous
work has suggested a ceiling of 2000ppm [6]. To compensate for this limit, burnable poisons in the form of IFBA, Gd203 or Er20 3 can be added to the initial loading although
this has several negative effects, including residual poison penalties, displacement of fuel, and contributions to fission gas accumulation.
2.2
CASMO-4
For the analysis in this work, the Studsvik Core Management System (CMS) code CASMO-4 is utilized to numerically analyze the transuranic content in spent fuel of particular burnup levels. CASMO is a two-dimension, multigroup transport theory code. suitable for pin cell or assembly calculation in either BWR or PWR settings [10]. It is promoted as a licensing-level code suitable for commercial fuel management
calculations.
2.2.1
Modeling Assumptions
The CASMO model created to emulate the Westinghouse 17x17 PWR assumes a 3 batch cycle and 3% leakage. After leakage, criticality occurs when kfn•ty equals 1.03.
Following the burnup curves, for discharge burnups of 30, 50, 70 and 100 MWD simple linear reactivity requires the core to be just critical (k~m~ny equals 1.03) at 20, 33, 36 and
66 MWD respectively (see Table 2). Criticality at these burnups is achieved by
increasing the enrichment w/o of U-235 in the fuel composition. Once correct criticality and enrichment are achieved, the spent fuel isotopics of the discharged fuel are retrieved.
Table 2: Burnup curves for target discharge.
Fuel Batch Burnup in MWD
1 st 10 16 23 33
2nd 20 33 46 66
Discharge 30 50 70 100
The CASMO model has been highly simplified. No burnable poisons are included in the fuel composition. No histories are included for fuel temperature, moderator temperature, or boron concentration. Control rods are taken to be fully withdrawn. The base
parameters used in all CASMO inputs are included in Table 3. Table 3: CASMO-4 parameters for calculations.
Parameter Value
Fuel Temperature (K) 900
Moderator Temperature (K) 583.1
3
Results
3.1
Fuel Enrichments
The U-235 enrichment of the input fuel was modified to achieve the criticality condition
kinnnity = 1.030 ± 0.001 at the 2nd batch burnup level specified in Table 2. Discharge
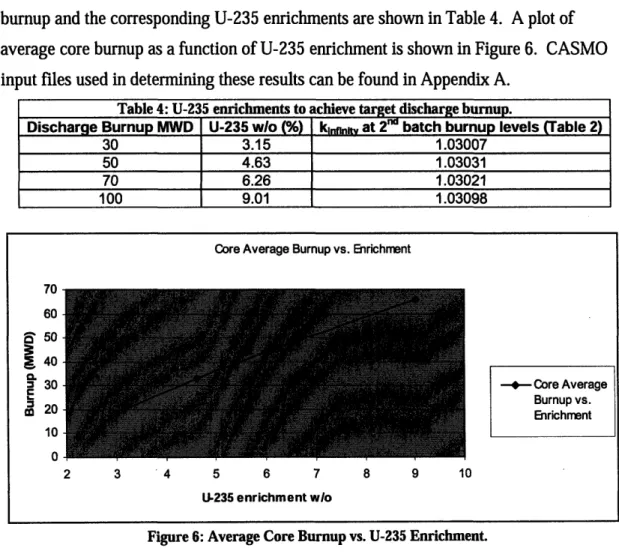
burnup and the corresponding U-235 enrichments are shown in Table 4. A plot of average core burnup as a function of U-235 enrichment is shown in Figure 6. CASMO input files used in determining these results can be found in Appendix A.
Table 4: U-235 enrichments to achieve target discharge burnup.
Discharge Burnup MWD U-235 wlo (%) klftH, at 2n" batch burnup levels (Table 2)
30 3.15 1.03007
50 4.63 1.03031
70 6.26 1.03021
100 9.01 1.03098
Core Average Burnup vs. Enrichment
70 60
&
5050
S40 3 30 m 20 10 0 2 3 4 5 6 7 8 9 10 LV235 enrichment wloFigure 6: Average Core Burnup vs. U-235 Enrichment.
- Core Average
Burnup vs. Enrichment
3.2
Discharge Fuel Composition
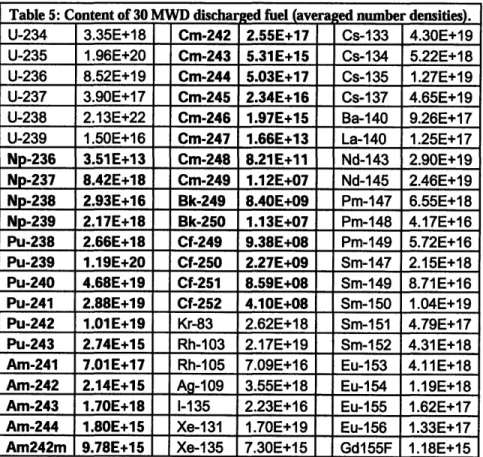
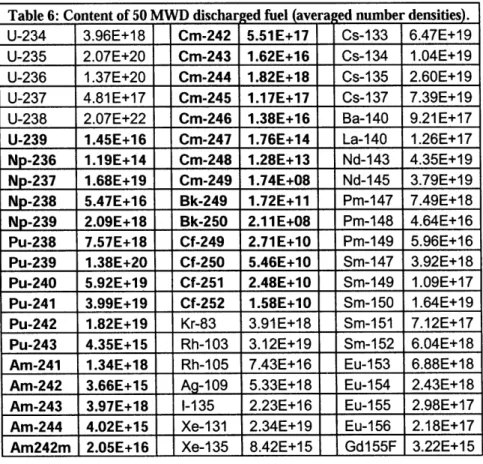
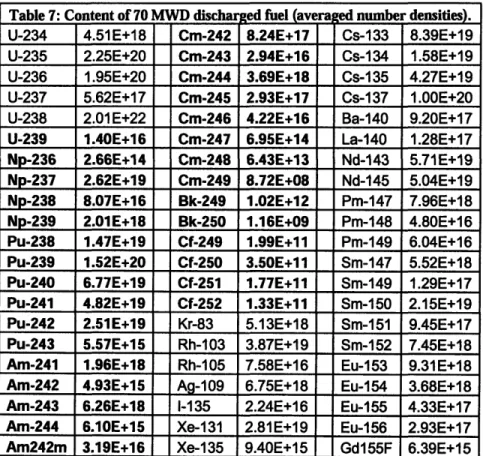
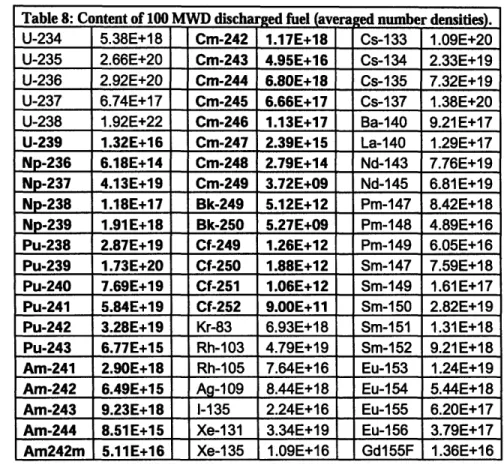
Extended runs to higher burnup values were then performed using the enrichments in Table 4. The isotope densities were extracted at the target discharge burnup level. The
results are shown in Table 5, Table 6, Table 7 and Table 8; the transuranic isotopes are bolded. The CASMO input files for these runs are given in Appendix B.
Table 5: Content of 30 MWD discharged fuel (avera ed number densities).
U-234 3.35E+18 Cm-242 2.55E+17 Cs-133 4.30E+19
U-235 1.96E+20 Cm-243 5.31E+15 Cs-134 5.22E+18
U-236 8.52E+19 Cm-244 5.03E+17 Cs-135 1.27E+19
U-237 3.90E+17 Cm-245 2.34E+16 Cs-137 4.65E+19
U-238 2.13E+22 Cm-246 1.97E+15 Ba-140 9.26E+17
U-239 1.50E+16 Cm-247 1.66E+13 La-140 1.25E+17
Np-236 3.51E+13 Cm-248 8.21E+11 Nd-143 2.90E+19
Np-237 8.42E+18 Cm-249 1.12E+07 Nd-145 2.46E+19
Np-238 2.93E+16 Bk-249 8.40E+09 Pm-147 6.55E+18
Np-239 2.17E+18 Bk-250 1.13E+07 Pm-148 4.17E+16
Pu-238 2.66E+18 Cf-249 9.38E+08 Pm-149 5.72E+16 Pu-239 1.19E+20 Cf-250 2.27E+09 Sm-147 2.15E+18
Pu-240 4.68E+19 Cf-251 8.59E+08 Sm-149 8.71E+16 Pu-241 2.88E+19 Cf-252 4.10E+08 Sm-150 1.04E+19 Pu-242 1.01E+19 Kr-83 2.62E+18 Sm-151 4.79E+17
Pu-243 2.74E+15 Rh-103 2.17E+19 Sm-152 4.31E+18 Am-241 7.01E+17 Rh-105 7.09E+16 Eu-153 4.11E+18 Am-242 2.14E+15 Ag-109 3.55E+18 Eu-154 1.19E+18
Am-243 1.70E+18 1-135 2.23E+16 Eu-155 1.62E+17
Am-244 1.80E+15 Xe-131 1.70E+19 Eu-156 1.33E+17
Table 6: Content of 50 MWD discha ged fuel (averaged number densities).
U-234 3.96E+18 Cm-242 5.51E+17 Cs-133 6.47E+19
U-235 2.07E+20 Cm-243 1.62E+16 Cs-134 1.04E+19
U-236 1.37E+20 Cm-244 1.82E+18 Cs-135 2.60E+19
U-237 4.81E+17 Cm-245 1.17E+17 Cs-137 7.39E+19
U-238 2.07E+22 Cm-246 1.38E+16 Ba-140 9.21E+17
U-239 1.45E+16 Cm-247 1.76E+14 La-140 1.26E+17
Np-236 1.19E+14 Cm-248 1.28E+13 Nd-143 4.35E+19
Np-237 1.68E+19 Cm-249 1.74E+08 Nd-145 3.79E+19
Np-238 5.47E+16 Bk-249 1.72E+11 Pm-147 7.49E+18
Np-239 2.09E+18 Bk-250 2.11E+08 Pm-148 4.64E+16 Pu-238 7.57E+18 Cf-249 2.71E+10 Pm-149 5.96E+16
Pu-239 1.38E+20 Cf-250 5.46E+10 Sm-147 3.92E+18
Pu-240 5.92E+19 Cf-251 2.48E+10 Sm-149 1.09E+17
Pu-241 3.99E+19 Cf-252 1.58E+10 Sm-150 1.64E+19
Pu-242 1.82E+19 Kr-83 3.91E+18 Sm-151 7.12E+17
Pu-243 4.35E+15 Rh-103 3.12E+19 Sm-152 6.04E+18
Am-241 1.34E+18 Rh-105 7.43E+16 Eu-153 6.88E+18
Am-242 3.66E+15 Ag-109 5.33E+18 Eu-154 2.43E+18
Am-243 3.97E+18 1-135 2.23E+16 Eu-155 2.98E+17
Am-244 4.02E+15 Xe-131 2.34E+19 Eu-156 2.18E+17
Table 7: Content of 70 MWD discha ed fuel (avera ed number densities).
U-234 4.51E+18 Cm-242 8.24E+17 Cs-133 8.39E+19
U-235 2.25E+20 Cm-243 2.94E+16 Cs-134 1.58E+19
U-236 1.95E+20 Cm-244 3.69E+18 Cs-135 4.27E+19
U-237 5.62E+17 Cm-245 2.93E+17 Cs-137 1.00E+20
U-238 2.01E+22 Cm-246 4.22E+16 Ba-140 9.20E+17
U-239 1.40E+16 Cm-247 6.95E+14 La-140 1.28E+17
Np-236 2.66E+14 Cm-248 6.43E+13 Nd-143 5.71E+19
Np-237 2.62E+19 Cm-249 8.72E+08 Nd-145 5.04E+19
Np-238 8.07E+16 Bk-249 1.02E+12 Pm-147 7.96E+18
Np-239 2.01E+18 Bk-250 1.16E+09 Pm-148 4.80E+16 Pu-238 1.47E+19 Cf-249 1.99E+11 Pm-149 6.04E+16
Pu-239 1.52E+20 Cf-250 3.50E+11 Sm-147 5.52E+18 Pu-240 6.77E+19 Cf-251 1.77E+11 Sm-149 1.29E+17
Pu-241 4.82E+19 Cf-252 1.33E+11 Sm-150 2.15E+19 Pu-242 2.51E+19 Kr-83 5.13E+18 Sm-151 9.45E+17
Pu-243 5.57E+15 Rh-103 3.87E+19 Sm-152 7.45E+18
Am-241 1.96E+18 Rh-105 7.58E+16 Eu-153 9.31E+18
Am-242 4.93E+15 Ag-109 6.75E+18 Eu-154 3.68E+18
Am-243 6.26E+18 1-135 2.24E+16 Eu-155 4.33E+17
Am-244 6.10E+15 Xe-131 2.81E+19 Eu-156 2.93E+17
Table 8: Content of 100 MWD discharged fuel (averaged number densities).
U-234 5.38E+18 Cm-242 1.17E+18 Cs-133 1.09E+20
U-235 2.66E+20 Cm-243 4.95E+16 Cs-134 2.33E+19
U-236 2.92E+20 Cm-244 6.80E+18 Cs-135 7.32E+19
U-237 6.74E+17 Cm-245 6.66E+17 Cs-137 1.38E+20
U-238 1.92E+22 Cm-246 1.13E+17 Ba-140 9.21 E+17
U-239 1.32E+16 Cm-247 2.39E+15 La-140 1.29E+17
Np-236 6.18E+14 Cm-248 2.79E+14 Nd-143 7.76E+19
Np-237 4.13E+19 Cm-249 3.72E+09 Nd-145 6.81E+19
Np-238 1.18E+17 Bk-249 5.12E+12 Pm-147 8.42E+18
Np-239 1.91E+18 Bk-250 5.27E+09 Pm-148 4.89E+16
Pu-238 2.87E+19 Cf-249 1.26E+12 Pm-149 6.05E+16
Pu-239 1.73E+20 Cf-250 1.88E+12 Sm-147 7.59E+18
Pu-240 7.69E+19 Cf-251 1.06E+12 Sm-149 1.61E+17
Pu-241 5.84E+19 Cf-252 9.00E+11 Sm-150 2.82E+19
Pu-242 3.28E+19 Kr-83 6.93E+18 Sm-151 1.31E+18
Pu-243 6.77E+15 Rh-103 4.79E+19 Sm-152 9.21E+18
Am-241 2.90E+18 Rh-105 7.64E+16 Eu-153 1.24E+19 Am-242 6.49E+15 Ag-109 8.44E+18 Eu-154 5.44E+18
Am-243 9.23E+18 1-135 2.24E+16 Eu-155 6.20E+17
Am-244 8.51E+15 Xe-131 3.34E+19 Eu-156 3.79E+17 Am242m 5.11E+16 Xe-135 1.09E+16 Gd155F 1.36E+16
Spent Fuel Decay
The focus of this work is on the transuranic content of the discharge fuel. Transuranics are generally defined as elements with atomic numbers beyond 92 (Uranium). For the output given by CASMO, the transuranics in the discharged fuels include: U-239, Neptunium, Plutonium, Americium, Curium, Berkelium, and Californium. To calculate the activity of these isotopes, the ORIGEN code package was implemented using the
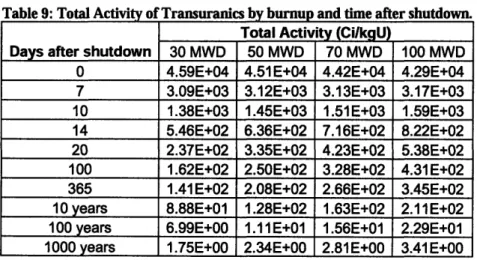
output from CASMO (Table 5 thru Table 8) [11]. Input files are given in Appendix C. Total activity in Ci/kgU is tabulated in Table 9 for up to the first 1000 years following
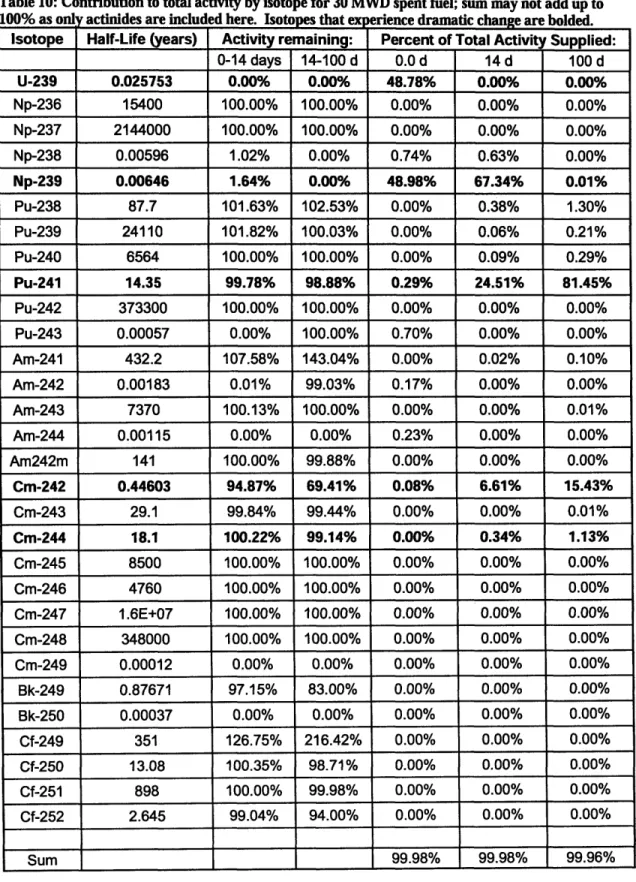
shutdown. Activity contributions by isotopes and change in isotope activities are listed in Table 10 through Table 13 (for absolute activity levels, see Appendix E). The initial decay for the first 100 days following shutdown is shown below in Figure 7. Decay for the first 350 years of life is shown in Figure 8.
Table 9: Total Activity of Transuranics by burnup and time after shutdown.
Total Activity (CilkgU)
Days after shutdown 30 MWD 50 MWD 70 MWD 100 MWD 0 4.59E+04 4.51E+04 4.42E+04 4.29E+04
7 3.09E+03 3.12E+03 3.13E+03 3.17E+03
10 1.38E+03 1.45E+03 1.51E+03 1.59E+03
14 5.46E+02 6.36E+02 7.16E+02 8.22E+02
20 2.37E+02 3.35E+02 4.23E+02 5.38E+02
100 1.62E+02 2.50E+02 3.28E+02 4.31E+02
365 1.41E+02 2.08E+02 2.66E+02 3.45E+02
10 years 8.88E+01 1.28E+02 1.63E+02 2.11E+02 100 years 6.99E+00 1.11E+01 1.56E+01 2.29E+01
Table 10: Contribution to total activity by isotope for 30 MWD spent fuel; sum may not add up to
100% as onl actinides are included here. Isotopes that ex erience dramatic change are bolded.
Isotope Half-Life (years) Activity remaining: Percent of Total Activity Supplied:
0-14 days 14-100 d 0.0 d 14 d 100 d U-239 0.025753 0.00% 0.00% 48.78% 0.00% 0.00% Np-236 15400 100.00% 100.00% 0.00% 0.00% 0.00% Np-237 2144000 100.00% 100.00% 0.00% 0.00% 0.00% Np-238 0.00596 1.02% 0.00% 0.74% 0.63% 0.00% Np-239 0.00646 1.64% 0.00% 48.98% 67.34% 0.01% Pu-238 87.7 101.63% 102.53% 0.00% 0.38% 1.30% Pu-239 24110 101.82% 100.03% 0.00% 0.06% 0.21% Pu-240 6564 100.00% 100.00% 0.00% 0.09% 0.29% Pu-241 14.35 99.78% 98.88% 0.29% 24.51% 81.45% Pu-242 373300 100.00% 100.00% 0.00% 0.00% 0.00% Pu-243 0.00057 0.00% 100.00% 0.70% 0.00% 0.00% Am-241 432.2 107.58% 143.04% 0.00% 0.02% 0.10% Am-242 0.00183 0.01% 99.03% 0.17% 0.00% 0.00% Am-243 7370 100.13% 100.00% 0.00% 0.00% 0.01% Am-244 0.00115 0.00% 0.00% 0.23% 0.00% 0.00% Am242m 141 100.00% 99.88% 0.00% 0.00% 0.00% Cm-242 0.44603 94.87% 69.41% 0.08% 6.61% 15.43% Cm-243 29.1 99.84% 99.44% 0.00% 0.00% 0.01% Cm-244 18.1 100.22% 99.14% 0.00% 0.34% 1.13% Cm-245 8500 100.00% 100.00% 0.00% 0.00% 0.00% Cm-246 4760 100.00% 100.00% 0.00% 0.00% 0.00% Cm-247 1.6E+07 100.00% 100.00% 0.00% 0.00% 0.00% Cm-248 348000 100.00% 100.00% 0.00% 0.00% 0.00% Cm-249 0.00012 0.00% 0.00% 0.00% 0.00% 0.00% Bk-249 0.87671 97.15% 83.00% 0.00% 0.00% 0.00% Bk-250 0.00037 0.00% 0.00% 0.00% 0.00% 0.00% Cf-249 351 126.75% 216.42% 0.00% 0.00% 0.00% Cf-250 13.08 100.35% 98.71% 0.00% 0.00% 0.00% Cf-251 898 100.00% 99.98% 0.00% 0.00% 0.00% Cf-252 2.645 99.04% 94.00% 0.00% 0.00% 0.00% Sum 99.98% 99.98% 99.96%
Table 11: Contribution to total activity by isotope for 50 MWD spent fuel; sum may not add up to
100% as only actinides are included here. Isotopes that experience dramatic change are bolded.
Isotope Half-Life (years) Activity remaining: Percent of Total Activi ty Supplied:
0-14 days 14-100 d 0.0 d 14 d 100 d U-239 0.025753 0.00% 0.00% 48.02% 0.00% 0.00% Np-236 15400 100.00% 100.00% 0.00% 0.00% 0.00% Np-237 2144000 100.00% 100.00% 0.00% 0.00% 0.00% Np-238 0.00596 1.02% 0.00% 1.40% 1.01% 0.00% Np-239 0.00646 1.64% 0.01% 48.00% 55.60% 0.01% Pu-238 87.7 101.11% 101.91% 0.01% 0.91% 2.37% Pu-239 24110 101.52% 100.03% 0.00% 0.06% 0.16% Pu-240 6564 100.00% 100.03% 0.00% 0.09% 0.24% Pu-241 14.35 99.78% 98.91% 0.41% 28.93% 72.78% Pu-242 373300 100.00% 100.00% 0.00% 0.00% 0.00% Pu-243 0.00057 0.00% 100.00% 1.14% 0.00% 0.00% Am-241 432.2 105.51% 131.59% 0.00% 0.03% 0.11% Am-242 0.00183 0.01% 99.18% 0.30% 0.00% 0.00% Am-243 7370 100.11% 100.00% 0.00% 0.01% 0.01% Am-244 0.00115 0.00% 0.00% 0.52% 0.00% 0.00% Am242m 141 99.98% 99.90% 0.00% 0.00% 0.00% Cm-242 0.44603 94.74% 69.41% 0.18% 12.26% 21.65% Cm-243 29.1 99.89% 99.42% 0.00% 0.01% 0.02% Cm-244 18.1 100.07% 99.09% 0.01% 1.06% 2.66% Cm-245 8500 100.00% 100.00% 0.00% 0.00% 0.00% Cm-246 4760 100.00% 100.00% 0.00% 0.00% 0.00% Cm-247 1.60E+07 100.00% 100.00% 0.00% 0.00% 0.00% Cm-248 348000 100.00% 100.00% 0.00% 0.00% 0.00% Cm-249 0.00012 0.00% 0.00% 0.00% 0.00% 0.00% Bk-249 0.87671 97.10% 83.02% 0.00% 0.00% 0.00% Bk-250 0.00037 0.00% 0.00% 0.00% 0.00% 0.00% Cf-249 351 118.94% 187.89% 0.00% 0.00% 0.00% Cf-250 13.08 100.18% 98.75% 0.00% 0.00% 0.00% Cf-251 898 99.95% 100.00% 0.00% 0.00% 0.00% Cf-252 2.645 99.00% 94.01% 0.00% 0.00% 0.00% Sum 100.00% 99.98% 100.02%
Table 12: Contribution to total activity by isotope for 70 MWD spent fuel; sum may not add up to
100% as only actinides are included here. Isotopes that experience dramatic change are bolded.
Isotope Half-Life (years) Activity remaining: Percent of Total Activity Supplied:
0-14 days 14-100 d 0.0 d 14 d 100 d U-239 0.025753 0.00% 0.00% 47.26% 0.00% 0.00% Np-236 15400 100.00% 100.00% 0.00% 0.00% 0.00% Np-237 2144000 100.00% 100.01% 0.00% 0.00% 0.00% Np-238 0.00596 1.02% 0.00% 2.10% 1.32% 0.00% Np-239 0.00646 1.64% 0.02% 47.08% 47.52% 0.02% Pu-238 87.7 100.89% 101.42% 0.03% 1.58% 3.49% Pu-239 24110 101.30% 100.02% 0.00% 0.06% 0.13% Pu-240 6564 100.01% 100.04% 0.00% 0.10% 0.21% Pu-241 14.35 99.82% 98.88% 0.51% 31.18% 67.25% Pu-242 373300 100.00% 100.00% 0.00% 0.00% 0.00% Pu-243 0.00057 0.00% 100.00% 1.49% 0.00% 0.00% Am-241 432.2 104.53% 126.47% 0.00% 0.04% 0.12% Am-242 0.00183 0.01% 99.22% 0.41% 0.00% 0.00% Am-243 7370 100.09% 100.00% 0.00% 0.01% 0.02% Am-244 0.00115 0.00% 0.00% 0.80% 0.00% 0.00% Am242m 141 100.00% 99.86% 0.00% 0.00% 0.00% Cm-242 0.44603 94.72% 69.42% 0.28% 16.27% 24.64% Cm-243 29.1 99.91% 99.43% 0.00% 0.01% 0.02% Cm-244 18.1 100.00% 99.12% 0.03% 1.90% 4.11% Cm-245 8500 100.00% 100.00% 0.00% 0.00% 0.00% Cm-246 4760 100.00% 99.98% 0.00% 0.00% 0.00% Cm-247 1.60E+07 100.00% 100.00% 0.00% 0.00% 0.00% Cm-248 348000 100.08% 100.00% 0.00% 0.00% 0.00% Cm-249 0.00012 0.00% 0.00% 0.00% 0.00% 0.00% Bk-249 0.87671 97.10% 83.01% 0.00% 0.00% 0.00% Bk-250 0.00037 0.00% 0.00% 0.00% 0.00% 0.00% Cf-249 351 115.30% 173.28% 0.00% 0.00% 0.00% Cf-250 13.08 100.11% 98.77% 0.00% 0.00% 0.00% Cf-251 898 100.00% 100.00% 0.00% 0.00% 0.00% Cf-252 2.645 99.02% 93.99% 0.00% 0.00% 0.00% Sum 99.99% 99.99% 100.01%
Table 13: Contribution to total activity by isotope for 100 MWD spent fuel; sum may not add up to
100% as only actinides are included here. Isotopes that experience dramatic change are bolded.
Isotope Half-Life (years) Percentage Increase from: Percentage of Activity Supplied
0-14 days 14-100 d 0.0 d 14 d 100 d U-239 0.025753 0.00% 0.00% 45.97% 0.00% 0.00% Np-236 15400 100.00% 100.00% 0.00% 0.00% 0.00% Np-237 2144000 100.00% 100.00% 0.00% 0.00% 0.00% Np-238 0.00596 1.02% 0.00% 3.17% 1.69% 0.00% Np-239 0.00646 1.64% 0.03% 46.14% 39.35% 0.02% Pu-238 87.7 100.60% 101.01% 0.05% 2.66% 5.12% Pu-239 24110 101.08% 100.02% 0.00% 0.06% 0.11% Pu-240 6564 100.01% 100.08% 0.00% 0.10% 0.18% Pu-241 14.35 99.82% 98.85% 0.63% 32.91% 62.01% Pu-242 373300 100.00% 100.00% 0.00% 0.00% 0.00% Pu-243 0.00057 0.00% 100.00% 1.87% 0.00% 0.00% Am-241 432.2 103.74% 121.90% 0.00% 0.06% 0.13% Am-242 0.00183 0.01% 99.38% 0.55% 0.00% 0.01% Am-243 7370 100.07% 100.00% 0.00% 0.01% 0.02% Am-244 0.00115 0.00% 0.00% 1.15% 0.00% 0.00% Am242m 141 99.96% 99.91% 0.00% 0.00% 0.01% Cm-242 0.44603 94.67% 69.39% 0.41% 20.10% 26.59% Cm-243 29.1 99.91% 99.39% 0.00% 0.01% 0.03% Cm-244 18.1 100.00% 99.08% 0.06% 3.05% 5.76% Cm-245 8500 100.00% 100.00% 0.00% 0.00% 0.00% Cm-246 4760 100.00% 100.00% 0.00% 0.00% 0.00% Cm-247 1.6E+07 100.00% 100.00% 0.00% 0.00% 0.00% Cm-248 348000 100.00% 100.02% 0.00% 0.00% 0.00% Cm-249 0.00012 0.00% 0.00% 0.00% 0.00% 0.00% Bk-249 0.87671 97.08% 83.00% 0.00% 0.00% 0.00% Bk-250 0.00037 0.00% 0.00% 0.00% 0.00% 0.00% Cf-249 351 112.14% 159.80% 0.00% 0.00% 0.00% Cf-250 13.08 100.08% 98.76% 0.00% 0.00% 0.00% Cf-251 898 100.00% 99.97% 0.00% 0.00% 0.00% Cf-252 2.645 98.99% 94.01% 0.00% 0.00% 0.00% Sum 100.00% 100.00% 99.99%
Total Activity Decay of Transuranics
3.00E+03 -2.50E+03 2.00E+03 -1.50E+03 1.00E+03 -5.00E+02 n nnF+nn-
30 MWD
-
50 MWD
70 mwd ... 100 m w d 17 27 37 47 57 67Time (days)
77 87 97
Time after shutdown (Years)
Figure 8: Decay of transuranics in spent fuel by burnup from 10 to 350 years after shutdown. Figure 7: Decay of transuranics in spent fuel by burnup as function of time after shutdown.
Total Activity Decay over Years
2.00E+02 1.50E+02 1.00E+02 5.00E+01 0.00E+00 -- nnI=+nl -.- 30 MWD -U- 50 MWD 70 MWD -x- 100 MWD V.VV I - V - "- '-.~ v
Table 14: Spent fuel half lives by burnup
Discharge fuel burnup (MWD) Half Life from day 7 (days) Half Life from day 14 (days)
30 2.6 5
50 2.7 8
70 2.8 19
100 3.1 129
In looking at the long term behavior of the fuel, the first two weeks of life are misleading. Considering that there is at least a week's delay until removal, then calculating from day 7 following shutdown, the aggregate spent fuels decay with half-lives on the order of 2-3 days. This initial rapid decay is dominated by the U-239 decay, an isotope with a half-life of 23.5 minutes. For the 30 MWD, U-239 provides 48.78% of the initial activity; by day 14, U-239 has decayed completely away (Table 10). The U-239 contribution to initial activity decreases slightly as burnup increases; for 100 MWD, U-239 contributes
45.97% but still decays completely away by day 14.
Fourteen days after shutdown, the spent fuel's decay dramatically slows, particularly for higher burnup fuel. Calculating half-lives from day 14, for 30 MWD spent fuel, it is 5 days, almost 200% of the half live starting from day 7. For 100 MWD, the half life at day 7 was 3.1 days; starting from day 14, it is 129 days. The complete table of half lives is below in Table 14. Np-239 contributes heavily to this slowed decay, as it provides large amounts of activity at day 14 and decays with a half life of 0.00646 years. In 30 MWD discharge fuel, Np-239 contributes for 67.35% of total activity; by day 100, it decays to 0.03% of its original activity. For 100 MWD, Np-239 contributes 46.14% at day fourteen but similarly decays to 0.03% of its original activity by day 100.
After Np-239 decays, the remaining large contributors to activity are Pu-241 (half life 14.35 years), Cm-242 (half life 0.44603 years), and Cm-244 (18.1 years). Pu-241 contributes the largest at days 14 and beyond and its percentage contribution increases with burnup, from 24.51% at 30 MWD at day 14 to 32.91% in 100 MWD burnup. It is the increased presence of Np-239 and lower presence of Pu-241 in lower burnup fuels that shortens the fuel's decay time so dramatically when compared to 100 MWD discharge fuel. The difference in total activity from 30 MWD to 100 MWD at day 7 is
only 0.08 Ci/kgU, but the half life is considerably lengthened in higher burnup fuel. For longer periods of time, the trend in half-life becomes unclear. Zhiwen Wu looked more in depth at fuel behavior between 1 and 100 years by discharge burnup; his figure 7.3(a) ([6], page 198) illustrates the buildup of activity that occurs between 10 and 100 years (Figure 9). F i I.UK-- " i I I I I I I 1.OE+08 1_ OE+07 1.0E+06 1.0E+05 1.0E+04 1.0E+03 1.OE+02 4 nr-4ni I I I- -33 MWdi kg I I I I I II7
---
----
I--- T---
I -.-x--700Mdk
MWdfkg qI• I .. . . . ---100 MWdKo -e--120 MWdkg -+--150 MWd1kg I I I I I ,---,---J- -- i--4- --- L ---I I I I --- -i- -- -- -- - 4--- --- +---4--- --- -- --I I I I I I I I I I I I I I I I I I I I I I I I I I I I I I I I I I I I I I I I I I . ... I . ...I , ... . ... . ...I . ...I . ... 0.1 1 10 100 1000 10000 10000I 1OO000Decay time after discharge (year)
(a) Absolute magnitude
Figure 9: Total Radioactivity by burnup versus time after discharge [6].
Between 10 and 100 years it appears that the rate of decay decreases, probably due to the decay of Cm-242 and Pu-241, the largest sources of activity and the fastest decaying at
100 days after discharge. For more analysis concerning this trend, see Xu's "Design
Strategies for Optimizing High Burnup Fuel in Pressurized Water Reactor."
In the short-term and long-term, the activity from 100 MWD spent fuel ultimately maintains absolute levels over twice that of 30 MWD discharge (Table 9); however, the activity per MWD decreases (below in Table 15 and Figure 10, Figure 11 and Figure 12).
Table 15: Activity per MWD by time after shutdown and burnup
Activity Per MWD by time after Per MWD Radioactivity shutdown [Ci/(kgU-MWD)] relative to 30 MWD level (%)
0 1.53E+03 9.02E+02 6.31E+02 4.29E+02 14 1.82E+01 1.27E+01 1.02E+01 8.22E+00 100 5.41 E+00 5.00E+00 4.69E+00 4.31 E+00 0 58.95% 41.27% 28.04% 14 100 69.94% 56.24% 45.20% 92.42% 86.61% 79.67%
Figure 10: Radioactivity per MWD at 0 days after shutdown
30 40 50 60 70 80 90 100
MWD of Discharge Fuel
Figure 11: Radioactivity per MWD at 14 days after shutdown
Burnup (MWD) 30 50 70 100
Radioactivity per MWD at 14 Days after shutdown
2.00E+01
S1.50E+01 .• 1.00E+01 o G 5.00E+00
Figure 12: Radioactivity per MWD at 100 days after shutdown
The trend of decreasing MWD is not linear; the most substantial decreases in activity per MWD are seen between 30 MWD and 50 MWD. It is also seen that the relative
decreases are initially large before beginning to converge; for 100 MWD, the
activity/(kgU.MWD) is 28% of 30 MWD's at initial time of shutdown. At 100 MWD, the value is 80% of 30 MWD's value at 100 MWD. For nuclear programs concerned with cutting the radioactivity of spent fuel, high burnups present a distinct advantage by improving the "radioactivity economy" per MWD, particularly in the short term.
3.4
Proliferation Resistance and Burnup
The sum actinide behavior of the spent fuel is one important factor in considering the impact of driving fuels to higher burnup. It is also important to consider trends in specific isotopes that affect the spent fuel's resistance to proliferation. Isotopes of interest include U-235, U-236, Pu-239 and Pu-241 together (fissile Pu), Np-237, Am-241, Cm-242, Cm-244, and Cs-137. The weapon-ready fissile content of the spent fuel comes
from U-235, fissile Pu, Np-237, and Am-241. U-236, Cm-244 and Cm-242 here have been classified as proliferation resistant. Cm-244 provides an extra layer of radiation protection through fast decay (half life 18 years). Cm-242 alpha decays to Pu-238 which can act as a contaminant. U-236 is also considered a neutron poison [12]. Cs-137 is also credited as providing a measure of "protection" to the fuel by providing an intense gamma radiation barrier, although some also argue that the isotope could be used for
Radioactivity per MWD at 100 Days after
shutdown o 6.00E+00 2 5.00E+00 . 4.00E+00 . ~* 3.00E+00 " 2.00E+00 . . 1.00E+00 r 0.OOE+00 30 40 50 60 70 80 90 100 MWD of Discharge Fuel
weaponry. The trends are summarized in Table 16, where number densities at 30 and 100 MWD are tabulated and the percent increase between the two calculated. Graphs of the density trends of each isotope are shown in Figure 13 through Figure 20 in Appendix D.
Table 16: Percent Increase of Select Isotopes from 30 to 100 MWD.
Density (cm"3) at
30 MWD 100 MWD % Increase
Proliferation material
U-235 1.96E+20 2.66E+20 135.71 Np-237 8.42E+18 4.13E+19 490.50
Am-241 7.01E+17 2.90E+18 413.69
Fissile Pu 1.48E+20 2.31E+20 156.56 Proliferation resistant material
U-236
8.52E+19
2.92E+20
342.72
Cm-242 2.55E+17 1.17E+18 458.82
Cm-244 5.03E+17 6.80E+18 1351.89
Cs-137 4.65E+19 1.38E+20 296.77
What is important to note is that U-235 and fissile Pu both experience only moderate increases, 135% and 156% respectively. At the same time, the proliferation resistant content has at least tripled. Cm-244 experiences a 1351% increase. One more trend seen in the figures in Appendix D is that when graphed, the number densities increase in a mostly linear fashion. At the very least, it could be inferred that proliferation risk does not increase with burnup, if the risk does not directly decrease.
4
Summation of
Work
As higher burnups increasingly become politically and economically desirable, the changing characteristics of the discharged fuel content, particularly its transuranic inventory, must be monitored. Using CASMO-4 to simulate a typical Westinghouse PWR, it was seen that discharged fuel driven to 100 MWD maintained activity levels over twice that of 30 MWD and decayed significantly slower than discharge fuels with
lower burnups. This was primarily due to an increased contribution from the long-lived Pu-241 and decreased contribution of faster-decaying Np-239. The radioactivity per MWD did decreases despite absolute increases. The trend of longer half-lives may not hold valid past 10 years as previous work suggest that the activity rate of decay decreases from 10 to 100 years after discharge. More determinate analysis to analyze the most efficient ways to take advantage of the increased "radioactivity economy" in high burnup fuels and the slowdown of decay in middle-life should be conducted. Simulations that include the burnable poisons, multiple batches, and boron and temperature histories might also allow for more precise insights into these new transuranic behaviors.
5
References
1. GRID-Arendal / U.N.E.P. (2000). Global atmospheric concentration of C02.
Retrieved January 28, 2007 from http://www.grida.no/climate/lvital/07.htm. 2. Government of Japan Association for Nuclear Research and Energy
(2002). Outlook for World Energy Demand. Retrieved January 28, 2007 from
http://www.enecho.meti.go.jplenglishlenergylworldloutlook.html.
3. U.S. DOE Nuclear Energy Research Advisory Committee and the Generation IV
International Forum (December 2002), A Technology Roadmap of Generation IV
Nuclear Energy Systems. Retrieved January 28, 2007 from
http://nuclear.energy.gov/genlV/neGenlV7.html.
4. U.S. Department of Energy Office of Energy, Science and Technology (2003).
Nuclear Energy Plant Optimization. Retrieved February 28, 2007 from
http://nepo.ne.doe.gov/.
5. Office of Nuclear Energy (2007). What is Generation IV? Retrieved January 28, 2007 from http://nuclear.energy.gov/genlV/neGenlVl .html.
6. Xu, Zhiwen, Design Strategies for Optimizing High Burnup Fuel in Pressurized
Water Reactors. Ph.D. diss., Massachusetts Institute of Technology, 2003.
7. Finch, J. (2006). Weekly Spot Uranium Prices Set New Record: Tops
US$60/Pound, Stocklnterview.com. Retrieved 2006.
8. Paramonov, D.V., et al., IRIS Reactor Development. 2001, Westinghouse Electric Company: Pittsburgh, PA. p. 11.
9. The Nuclear Energy Institute (2007), License Renewal. Retrieved on February 15, 2007 from http://www.nei.org/index.asp?catnum=2&catid=343.
10. Edenius, M. and e. al, CASMO-4 User's Manual, Studsvick. 1995.
11. Ludwig, S. (1999). ORIGEN2, Version 2.1 Release Notes. Oak Ridge: Oak
Ridge National Laboratory.
12. Pansters, Danny (2005). What happens in the reactor? Retrieved March 30, 2007 from http:llwww.ricin.comlnuke/bg/reactor.html.
Appendix A
CASMO Input Files: Enrichment
30 MWD: k-inf = 1.03007, 3.15% w/o
*CASMO-4 fuel assembly input
* HIGH BURNUP PWR-CORE MODEL
* 17X17 Westinghouse PWR Assembly
TTL * HIGH BURNUP PWR-CORE MODEL - ENR. 3.15 PDE 104.5 'KWL' * Power density
PRE 155.1296 * Pressure (bars)
TFU 900.0 * Average fuel temperature (K) TMO 583.1 * Average moderator temperature (K) BOR 450.0 * Average soluble boron concent.(ppm) VOI 0.0 * zero void fraction
***** Material compositions ***** FUE 1 10.3/3.15
***** Geometry specification *****
PWR 17 1.26 21.5 * 17X17, pin pitch 1.26cm, assm.pitch 21.5cm PIN 1 .4096 .4178 .4750/'1' 'AIR' 'CAN' * FUEL
PIN 2 .5690 .6147/'COO' 'BOX' * GUIDET PIN 3 .5690 .6147/'COO' 'BOX'
* Define the control rod with the name RCC without inserting it: PIN 3 .4331 .4369 .4839 .5690 .6147/
'AIC' 'AIR' 'CRS' 'COO' 'BOX'//1 'RCC' 'ROD' LPI 2 1 1 111 11111 3 1 1 3 111113 3113111 11111111 111111111 DEP -80 NLI STA END 50 MWD: k-inf = 1.03031, 4.63% w/o
*CASMO-4 fuel assembly input (./C4/c4.u500.inp)
* HIGH BURNUP PWR-CORE MODEL
* 17X17 Westinghouse PWR Assembly
TTL * HIGH BURNUP PWR-CORE MODEL - ENR. 4.63 PDE 104.5 'KWL' * Power density
PRE 155.1296 * Pressure (bars)
TFU 900.0 * Average fuel temperature (K) TMO 583.1 * Average moderator temperature (K) BOR 450.0 * Average soluble boron concent.(ppm) VOI 0.0 * zero void fraction
***** Material compositions ***** FUE 1 10.3/4.63
***** Geometry specification *****
PWR 17 1.26 21.5 * 17X17, pin pitch 1.26cm, assm.pitch 21.5cm PIN 1 .4096 .4178 .4750/'1' 'AIR' 'CAN' * FUEL
PIN 2 .5690 .6147/'COO' 'BOX' * GUIDET PIN 3 .5690 .6147/'COO' 'BOX'
* Define the control rod with the name RCC without inserting it: PIN 3 .4331 .4369 .4839 .5690 .6147/
'AIC' 'AIR' 'CRS' 'COO' 'BOX'//1 'RCC' 'ROD' LPI 2 1 1 111 3113 11111 111113 3113111 11111111 111111111 DEP -33 NLI STA END 70 MWD: k-inf = 1.03021, 6.26% w/o
*CASMO-4 fuel assembly input
* HIGH BURNUP PWR-CORE MODEL
* 17X17 Westinghouse PWR Assembly
TTL * HIGH BURNUP PWR-CORE MODEL - ENR. 6.26 PDE 104.5 'KWL' * Power density
PRE 155.1296 * Pressure (bars)
TFU 900.0 * Average fuel temperature (K) TMO 583.1 * Average moderator temperature (K) BOR 450.0 * Average soluble boron concent.(ppm) VOI 0.0 * zero void fraction
***** Material compositions ***** FUE 1 10.3/6.26
***** Geometry specification *****
PWR 17 1.26 21.5 * 17X17, pin pitch 1.26cm, assm.pitch 21.5cm PIN 1 .4096 .4178 .4750/'1' 'AIR' 'CAN' * FUEL
PIN 2 .5690 .6147/'COO' 'BOX' * GUIDET PIN 3 .5690 .6147/'COO' 'BOX'
* Define the control rod with the name RCC without inserting it: PIN 3 .4331 .4369 .4839 .5690 .6147/
'AIC' 'AIR' 'CRS' 'COO' 'BOX'//1 'RCC' 'ROD' LPI 2 1 1 3113 1 1 1 1 1 111113 3113111
3 1 1
3 1
1 1
11111111 111111111 DEP -46 NLI STA END 100 MWD: k-inf = 1.03098, 9.01% w/o
*CASMO-4 fuel assembly input (./C4/c4.u500.inp)
* HIGH BURNUP PWR-CORE MODEL
* 17X17 Westinghouse PWR Assembly
TTL * HIGH BURNUP PWR-CORE MODEL - ENR. 9.01 PDE 104.5 'KWL' * Power density
PRE 155.1296 * Pressure (bars)
TFU 900.0 * Average fuel temperature (K) TMO 583.1 * Average moderator temperature (K) BOR 450.0 * Average soluble boron concent.(ppm) VOI 0.0 * zero void fraction
***** Material compositions ***** FUE 1 10.3/9.01
***** Geometry specification *****
PWR 17 1.26 21.5 * 17X17, pin pitch 1.26cm, assm.pitch 21.5cm PIN 1 .4096 .4178 .4750/'1' 'AIR' 'CAN' * FUEL
PIN 2 .5690 .6147/'COO' 'BOX' * GUIDET PIN 3 .5690 .6147/'COO' 'BOX'
* Define the control rod with the name RCC without inserting it: PIN 3 .4331 .4369 .4839 .5690 .6147/
'AIC' 'AIR' 'CRS' 'COO' 'BOX'//1 'RCC' 'ROD' LPI 2 1 1 111 11111 3 1 1 3 111113 3113111 DEP -66 NLI STA END
Appendix
B
CASMO Input Files: Discharge Transuranics
30 MWD
*CASMO-4 fuel assembly input
* HIGH BURNUP PWR-CORE MODEL
* 17X17 Westinghouse PWR Assembly
TTL * HIGH BURNUP PWR-CORE MODEL - ENR. 3.15 PDE 104.5 'KWL' * Power density
PRE 155.1296 * Pressure (bars)
TFU 900.0 * Average fuel temperature (K) TMO 583.1 * Average moderator temperature (K) BOR 450.0 * Average soluble boron concent.(ppm) VOI 0.0 * zero void fraction
***** Material compositions ***** FUE 1 10.3/3.15
***** Geometry specification *****
PWR 17 1.26 21.5 * 17X17, pin pitch 1.26cm, assm.pitch 21.5cm PIN 1 .4096 .4178 .4750/'1' 'AIR' 'CAN' * FUEL
PIN 2 .5690 .6147/'COO' 'BOX' * GUIDET PIN 3 .5690 .6147/'COO' 'BOX'
* Define the control rod with the name RCC without inserting it: PIN 3 .4331 .4369 .4839 .5690 .6147/
'AIC' 'AIR' 'CRS' 'COO' 'BOX'//1 'RCC' 'ROD' LPI 2 1 1 111 3113 11111 111113 3113111 11111111 111111111 DEP -80 NLI STA END 50 MWD
*CASMO-4 fuel assembly input
* HIGH BURNUP PWR-CORE MODEL
* 17X17 Westinghouse PWR Assembly
TTL * HIGH BURNUP PWR-CORE MODEL - ENR. 4.63 PDE 104.5 'KWL' * Power density
PRE 155.1296 * Pressure (bars)
TFU 900.0 * Average fuel temperature (K) TMO 583.1 * Average moderator temperature (K) BOR 450.0 * Average soluble boron concent.(ppm)
VOI 0.0 * zero void fraction ***** Material compositions ***** FUE 1 10.3/4.63
***** Geometry specification *****
PWR 17 1.26 21.5 * 17X17, pin pitch 1.26cm, assm.pitch 21.5cm PIN 1 .4096 .4178 .4750/'1' 'AIR' 'CAN' * FUEL
PIN 2 .5690 .6147/'COO' 'BOX' * GUIDET PIN 3 .5690 .6147/'COO' 'BOX'
* Define the control rod with the name RCC without inserting it: PIN 3 .4331 .4369 .4839 .5690 .6147/
'AIC' 'AIR' 'CRS' 'COO' 'BOX'//1 'RCC' 'ROD' LPI 2 1 1 111 3113 11111 111113 3113111 11111111 111111111 DEP -80 NLI STA END 70 MWD
*CASMO-4 fuel assembly input
* HIGH BURNUP PWR-CORE MODEL
* 17X17 Westinghouse PWR Assembly
TTL * HIGH BURNUP PWR-CORE MODEL - ENR. 6.26 PDE 104.5 'KWL' * Power density
PRE 155.1296 * Pressure (bars)
TFU 900.0 * Average fuel temperature (K) TMO 583.1 * Average moderator temperature (K) BOR 450.0 * Average soluble boron concent.(ppm) VOI 0.0 * zero void fraction
***** Material compositions ***** FUE 1 10.3/6.26
***** Geometry specification *****
PWR 17 1.26 21.5 * 17X17, pin pitch 1.26cm, assm.pitch 21.5cm PIN 1 .4096 .4178 .4750/'1' 'AIR' 'CAN' * FUEL
PIN 2 .5690 .6147/'COO' 'BOX' * GUIDET PIN 3 .5690 .6147/'COO' 'BOX'
* Define the control rod with the name RCC without inserting it: PIN 3 .4331 .4369 .4839 .5690 .6147/
'AIC' 'AIR' 'CRS' 'COO' 'BOX'//1 'RCC' 'ROD' LPI 2 1 1 3113 1 1 1 1 1 1 1 1 1 1 3
3113111 11111111S1 1 1 1 1111 DEP -80 NLI STA END 100 MWD
*CASMO-4 fuel assembly input
* HIGH BURNUP PWR-CORE MODEL
* 17X17 Westinghouse PWR Assembly
TTL * HIGH BURNUP PWR-CORE MODEL - ENR. 9.01 PDE 104.5 'KWL' * Power density
PRE 155.1296 * Pressure (bars)
TFU 900.0 * Average fuel temperature (K) TMO 583.1 * Average moderator temperature (K) BOR 450.0 * Average soluble boron concent.(ppm) VOI 0.0 * zero void fraction
***** Material compositions ***** FUE 1 10.3/9.01
***** Geometry specification *****
PWR 17 1.26 21.5 * 17X17, pin pitch 1.26cm, assm.pitch 21.5cm PIN 1 .4096 .4178 .4750/'1' 'AIR' 'CAN' * FUEL
PIN 2 .5690 .6147/'COO' 'BOX' * GUIDET PIN 3 .5690 .6147/'COO' 'BOX'
* Define the control rod with the name RCC without inserting it: PIN 3 .4331 .4369 .4839 .5690 .6147/
'AIC' 'AIR' 'CRS' 'COO' 'BOX'//1 'RCC' 'ROD' LPI 2 1 1 111 3113 11111 111113 3113111 11111111 111111111 DEP -102.5 NLI STA END
Appendix C
ORIGEN Input Files for Decay of Transuranics
30 MWD
-1 -1 -1
RDA DECAY
RDA Cutoff fractions for output tables
CUT 5 1.OE-10 7 1.OE-10 9 1.OE-10 15 1.OE-10
RDA Library print control
LIP 0 0 0 Decay lib. PWRUE.LIB 0 123 Cross lib. 604 605 606 Actinide 9 50 0 Initial vector -1 1 -1 -1 1 1
Initial vector New vector
-1 1 RDA Decay RDA Time DEC 7 RDA Light PCH 0 OPTA 8 8 8 8 8 OUT 2 1 END 932360 932370 932380 932390 942380 942390 942400 942410 942420 942430 1. 55E-06 3.72E-01 1.30E-03 9.68E-02 1.18E-01 5.31E+00 2 .10E+00 1.30E+00 4 .56E-01 1.24E-04 Time unit 1 2 4 Actinide Fi 2 0 Starting time ssion product 81888 88888 88888 888888 -1 0 962430 962440 962450 962460 962470 962480 962490 972490 972500 982490 2.41E-04 2 .29E-02 1.07E-03 9. 04E-05 7. 65E-07 3.80E-08 5. 20E-13 3.90E-10 5.27E-13 4.36E-11 952440 952421 962420 982500 982510 982520 952410 952420 952430 922390 8.20E-05 4 .42E-04 1.15E-02 1.06E-10 4.02E-11 1.93E-11 3. 15E-02 9. 66E-05 7. 71E-02 6. 69E-04 0.0 0.0 0.0 0.0 0.0 0.0 0.0 0.0 0.0 0.0 RDA set LIB RDA INP RDA MOV 0 1.0
![Figure 1: Outlook for world energy supply and demand by fuel [2].](https://thumb-eu.123doks.com/thumbv2/123doknet/14675934.557946/7.918.155.749.323.1061/figure-outlook-world-energy-supply-demand-fuel.webp)
![Figure 4: A depiction of the historical market trend of Uranium pricing and its future projection [7].](https://thumb-eu.123doks.com/thumbv2/123doknet/14675934.557946/9.918.145.762.121.995/figure-depiction-historical-market-uranium-pricing-future-projection.webp)