HAL Id: hal-00297795
https://hal.archives-ouvertes.fr/hal-00297795
Submitted on 10 Apr 2006HAL is a multi-disciplinary open access
archive for the deposit and dissemination of sci-entific research documents, whether they are pub-lished or not. The documents may come from teaching and research institutions in France or abroad, or from public or private research centers.
L’archive ouverte pluridisciplinaire HAL, est destinée au dépôt et à la diffusion de documents scientifiques de niveau recherche, publiés ou non, émanant des établissements d’enseignement et de recherche français ou étrangers, des laboratoires publics ou privés.
Water use strategies and ecosystem-atmosphere
exchange of CO2 in two highly seasonal environments
A. Arneth, E. M. Veenendaal, C. Best, W. Timmermans, O. Kolle, L.
Montagnani, O. Shibistova
To cite this version:
A. Arneth, E. M. Veenendaal, C. Best, W. Timmermans, O. Kolle, et al.. Water use strategies and ecosystem-atmosphere exchange of CO2 in two highly seasonal environments. Biogeosciences Discussions, European Geosciences Union, 2006, 3 (2), pp.345-382. �hal-00297795�
BGD
3, 345–382, 2006
Water use and NEE in boreal and semi-arid
ecosystems A. Arneth et al. Title Page Abstract Introduction Conclusions References Tables Figures J I J I Back Close
Full Screen / Esc
Printer-friendly Version Interactive Discussion
EGU
Biogeosciences Discuss., 3, 345–382, 2006 www.biogeosciences-discuss.net/3/345/2006/ © Author(s) 2006. This work is licensed under a Creative Commons License.
Biogeosciences Discussions
Biogeosciences Discussions is the access reviewed discussion forum of Biogeosciences
Water use strategies and
ecosystem-atmosphere exchange of CO
2
in two highly seasonal environments
A. Arneth1, E. M. Veenendaal2, C. Best3, W. Timmermans4, O. Kolle3, L. Montagnani5, and O. Shibistova6
1
Department of Physical Geography and Ecosystems Analysis, Lund University, 22 363 Lund, Sweden
2
Nature Conservation and Plant Ecology Group, Wageningen University and Research Centre, Germany
3
Max Planck Institute for Biogeochemistry, P.O. Box 100164, 07 701 Jena, Germany 4
The International Institute for Geo-Information Science and Earth Observation (ITC), Enschede, The Netherlands
5
University of Tuscia, Viterbo, Italy 6
V. N. Sukachev Forest Institute, Akademgorodok, 660 036 Krasnoyarsk, Russia Received: 11 January 2006 – Accepted: 20 January 2006 – Published: 10 April 2006 Correspondence to: A. Arneth (almut.arneth@nateko.lu.se)
BGD
3, 345–382, 2006
Water use and NEE in boreal and semi-arid
ecosystems A. Arneth et al. Title Page Abstract Introduction Conclusions References Tables Figures J I J I Back Close
Full Screen / Esc
Printer-friendly Version Interactive Discussion
Abstract
We compare assimilation and respiration rates, and water use strategies in four diver-gent ecosystems located in cold-continental central Siberia and in semi-arid southern Africa. These seemingly unrelated systems have in common a harsh and highly sea-sonal environment with a very sharp transition between the dormant and the active
5
season, and with vegetation facing dry air and soil conditions for at least part of the year. Moreover, the northern high latitudes and the semi-arid tropics will likely expe-rience changes in key environmental parameters (e.g., air temperature and precipita-tion) in the future; indeed, in some regions marked climate trends have already been observed over the last decade or so.
10
The magnitude of instantaneous or daily assimilation and respiration rates, derived from one to two years of eddy covariance measurements in each of the four ecosys-tems, was not related to the growth environment. For instance, respiration rates were clearly highest in the two deciduous systems included in the analysis (a Mopane wood-land in northern Botswana and a Downy birch forest in Siberia; >300 mmol m−2d−1),
15
while assimilation rates in the Mopane woodland were relatively similar to a Siberian Scots pine canopy for a large part of the active season (ca. 420 mmol m−2d−1). Ac-knowledging the limited number of ecosystems compared here, these data neverthe-less suggest that factors like vegetation type, canopy phenology or ecosystem age can override larger-scale climate differences in terms of their effects on carbon assimilation
20
and respiration rates.
By far the highest rates of assimilation were observed in Downy birch, an early suc-cessional species. These were achieved at a rather conservative water use, as indi-cated by relatively low levels of λ, the marginal water cost of plant carbon gain. Sur-prisingly, the Mopane woodland growing in the semi-arid environment had significantly
25
higher values of λ. However, its water use strategy included a very plastic response to intermittently dry periods, and values of λ were much more conservative overall during a rainy season with low precipitation and high air saturation deficits. Our comparison
BGD
3, 345–382, 2006
Water use and NEE in boreal and semi-arid
ecosystems A. Arneth et al. Title Page Abstract Introduction Conclusions References Tables Figures J I J I Back Close
Full Screen / Esc
Printer-friendly Version Interactive Discussion
EGU
demonstrates that forest ecosystems can respond very dynamically in terms of wa-ter use strategy, both on inwa-terannual and much shorwa-ter time scales. It remains to be evaluated whether and in which ecosystems this plasticity is mainly due to a short-term stomatal response, or goes hand in hand with changes in canopy photosynthetic capacity.
5
1 Introduction
In highly seasonal environments, plants are adapted to grow, and to reproduce, within a well-defined and often extremely short period. Effects of climate change will likely be particularly prominent under such conditions. And indeed, in some regions they can already be observed: for instance, as a lengthening of the “green” season in the
10
northern high latitudes over the last decade, the principal cause being warmer tem-peratures that stimulate the spring recovery of the photosynthetic apparatus and the growth of new leaves (Myneni et al., 1997; Zhou et al., 2001; Lucht et al., 2002; Sitch et al., 2006). Recent vegetation greening has also been shown for the Sahel, based on nearly 20 years of satellite records (Eklundh and Olsson, 2003), a trend that has been
15
attributed to changes in the amount of precipitation (Hickler et al., 2005).
A prolonged “green” period increases carbon assimilation. Its effect on the system’s overall carbon balance is, however, not straightforward to assess. An earlier onset of assimilation due to warmer temperatures or a change in precipitation patterns may be counterbalanced by ecosystem respiration, which also increases with temperature or,
20
in dry environments, soil moisture. Over longer time periods, a stimulation of assim-ilation will only lead to an increased net CO2 uptake as long as decomposition lags increased productivity. What is more, at the climatic limits of discrete vegetation types marked changes in species composition – with associated effects on the carbon bal-ance – can be proposed in response to changes in climate, although such a response
25
cannot be explained solely in terms of annual precipitation and temperature (Whit-taker, 1975). A suite of additional factors determines the distribution of plant
commu-BGD
3, 345–382, 2006
Water use and NEE in boreal and semi-arid
ecosystems A. Arneth et al. Title Page Abstract Introduction Conclusions References Tables Figures J I J I Back Close
Full Screen / Esc
Printer-friendly Version Interactive Discussion
nities, their productivity and reproductive success: carbon-water-nutrient interactions, daylength and the frequency of extreme or episodic events to name but a few (e.g., Schulze, 1982; Skre et al., 2002; Woodward and Lomas, 2004; Bond et al., 2005).
Still, using a complex ecosystem model that combines carbon cycle- and vegeta-tion responses to changing climate (Smith et al., 2001; Sitch et al., 2003), a recent
5
study concluded that not only the vegetation’s greenness but also the actual vegetation type that dominates in a certain African region may be highly susceptible to modifica-tions in the precipitation regime (H ´ely et al., 2006). Effects of climate change likely override effects of atmospheric CO2 levels on the dynamics of (sub)arctic vegetation (Kaplan et al., 2003). But field observations demonstrate that not only on local but
10
also on regional scale the picture is more complex (Jonsdottir et al., 1999; Jarvis and Linder, 2000; Gamache and Payette, 2004; Bowman and Prior, 2005; Holtmeier and Broll, 2005; Scheffer et al., 2005; Williams and Albertson, 2005) and sometimes dif-ficult to reproduce with state-of-the art models. Discrepancies between model results and field observations are to a certain degree due to the unavoidable absence of detail
15
in ecosystem models. They also place a finger on our lack of understanding the pro-cesses that underlie many of the above interactions, and how these are represented in the models. Yet, as feedbacks between the terrestrial carbon cycle and climate are anticipated to be significant (Cox et al., 2000; Friedlingstein et al., 2001; Foley et al., 2003) the detailed analyses of key controls on ecosystem functioning can help to
20
identify the causes of model-observation inconsistencies.
Today’s biogeographical spread of sites where the surface-atmosphere exchange of CO2 and water vapour is being measured allows assimilation and respiration to be studied in seemingly unrelated ecosystems that may, however, face analogous con-straints on their productivity. Here we compare data derived from eddy covariance
25
measurements in ecosystems located in the cold-continental vs. semi-arid environ-ment. Located thousands of kilometres apart, these have in common an extremely sharp transition between the dormant and the active period, as well as dry (air and soil) conditions during at least parts of the year. In the cold-continental regions the
BGD
3, 345–382, 2006
Water use and NEE in boreal and semi-arid
ecosystems A. Arneth et al. Title Page Abstract Introduction Conclusions References Tables Figures J I J I Back Close
Full Screen / Esc
Printer-friendly Version Interactive Discussion
EGU
active period is characterised by rapidly increasing temperatures in spring and short, warm, and often relatively dry summers, whereas in the semi-arid tropics the onset of the rainy season ends a several-months period of drought. Both regions are likely to experience changes in these critical environmental parameters, temperature and precipitation, in the future – or are in places already undergoing such changes, as
indi-5
cated above. We include four different ecosystems: A Mopane woodland in Botswana, a deciduous ecosystem representing the typical vegetation in the semi-arid regions of Southern Africa, and three different ecosystems in Siberia, an evergreen Scots pine forest; a deciduous Downy birch forest; and a mire. Despite extensive data sets that have become available over the last decade or so (e.g., Falge et al., 2002), process
10
studies on ecosystem scale are still relatively scarce for these regions, particularly in case of African savannas and woodlands, and deciduous boreal forests (Falge et al., 2002; Veenendaal et al., 2004). One important aspect therefore, specifically of the first part of this paper, is to present carbon assimilation and respiration observations for ecosystems, for which such data has not been discussed in detail before, and to
15
synthesize these in light of previously published data. The goal is to identify similarities and differences in these ecosystems’ strategies to assimilate and respire carbon, and to utilise water, which may be interpreted in terms of either their geographic location and climate (boreal vs. tropical) or growth form (deciduous vs. evergreen).
2 Study sites 20
2.1 Mopane woodland, northern Botswana
The study site was located in northern Botswana, few km east of the town Maun (23.5◦E, 19.9◦S). Colophospermum mopane forms the typical woodlands of south-ern Africa, found growing on slightly heavy soils and in areas with annual precipitation between 300–800 mm (Timberlake, 1995). Average annual rainfall in Maun is 460 mm,
25
BGD
3, 345–382, 2006
Water use and NEE in boreal and semi-arid
ecosystems A. Arneth et al. Title Page Abstract Introduction Conclusions References Tables Figures J I J I Back Close
Full Screen / Esc
Printer-friendly Version Interactive Discussion
The pattern is highly irregular, however, with scattered, small rain events (<20 mm over one to two days) occurring into May or as early as September, whereas week-long dry spells are being observed even during the height of the rainy season (Veenendaal et al., 2004). Soils are hard setting sands with a maximum volumetric water holding capacity of just below 20% in the top 50 cm. A layer of calcrete is found at a depth of
5
2–6 m.
In the area around Maun, Mopane forms a near single-species canopy of approxi-mately 8 m tall trees with a maximum leaf area index of around 1.2 in February and March. Few Acacia erioloba are present. Mopane is a drought deciduous species but has a relatively irregular pattern of leaf fall. Leaves cease to assimilate by August
10
(B. Mantlana, personal communication; Veenendaal et al., 2004), turning brown, but may remain on the trees until October. New leaves emerge rapidly after the first few rain events of the season. In many years, leaf fall may be instigated earlier by night frosts, which can happen in the coldest month, July. A sparse understorey of grasses and herbs is present during the rainy season but dies back nearly completely between
15
June and the onset of the rains (Veenendaal et al., 2004). 2.2 Boreal forests and wetlands, central Siberia
The study sites were located approximately 30 km inland to the west and 15 km to the east of the Yenisej river, with the closest settlements being the villages of Zotino and Vorogovo. The region is cold continental, has an average annual air temperature
20
below minus 1◦C and low precipitation of just under 600 mm (Kurbatova et al., 2002) which is somewhat higher along the hills that are covered by dark taiga. There is a distinct seasonality in air temperatures, which approach nearly 20◦C on average in the warmest month (July) when daily maxima can exceed 30◦C. The period of snow cover lasts approximately seven months, typically from mid to late September until snow-melt
25
begins by around mid-April or early May.
From a range of study sites (Heimann, 2002) we chose as representative ecosys-tems for this region a 200 year old Pinus sylvestris forest and a mire, located in close
BGD
3, 345–382, 2006
Water use and NEE in boreal and semi-arid
ecosystems A. Arneth et al. Title Page Abstract Introduction Conclusions References Tables Figures J I J I Back Close
Full Screen / Esc
Printer-friendly Version Interactive Discussion
EGU
proximity of each other (60.8◦N, 89.4◦E), and – for comparison with the deciduous Mopane – a 50-year-old Betula pubescens stand (61.0◦N, 89.8◦E). The monospecific pine forest represents the typical vegetation re-growing after fire on the sandy soils to the west of the Yenisej. It has a LAI of 1.5, with a ground cover dominated by various lichen species. The mires that are interspersed with the Scots pine stands are typical
5
for the central Siberian lowlands between the rivers Ob and Yenisej. The Betula stands grow on sandy silts that dominate to the east of the river what is the initial rise of the Central Siberian mountain range; it is an early succession species of the “dark taiga”. Maximum leaf area of this nearly monospecific forest was 2.6 by late August. A more detailed description of the three ecosystems can be found elsewhere (Arneth et al.,
10
2002a; Lloyd et al., 2002; R ¨oser et al., 2002; Shibistova et al., 2002; Tchebakova et al., 2002).
3 Methods
All sites had been equipped with nearly identical eddy covariance and climate sensors and software to measure and interpret the ecosystem-atmosphere exchange of CO2,
15
water vapour and sensible heat. Briefly, the eddy covariance flux systems consisted of a three dimensional sonic anemometer (Solent R3, Gill Instruments, Lymington, UK), located atop a tower few metres above the respective vegetation type. At each site an infra-red gas analyser (LI-COR 6262, Lincoln, USA) was located at ground level to measure fluctuations in CO2 and H2O concentration in air that was drawn
20
from anemometer height. Flux measurements were accompanied by measurements of weather parameters (e.g., quantum flux density, precipitation, air relative humidity, air and soil temperatures, soil moisture content). Eddy flux calculations were per-formed online but were later corrected to account for flux losses associated with the gas-analysers’ imperfect performance in the high-frequency domain, or dampening of
25
the signal while air was travelling along the tube (O. Kolle, unpublished; Eugster and Senn, 1995; Arneth et al., 2002a; Lloyd et al., 2002; R ¨oser et al., 2002; Tchebakova et
BGD
3, 345–382, 2006
Water use and NEE in boreal and semi-arid
ecosystems A. Arneth et al. Title Page Abstract Introduction Conclusions References Tables Figures J I J I Back Close
Full Screen / Esc
Printer-friendly Version Interactive Discussion
al., 2002; Veenendaal et al., 2004). The half-hourly fluxes thus derived were screened, and corrected for possibly dubious values encountered during stable conditions at night by applying a u*-threshold. To calculate daily sums, gaps were filled using a respiration-temperature function for night-time values (see below) and a hyperbolic relationship with quantum flux density (Q) during daytime hours. The shape of the correction
func-5
tions was plastic and parameter values varied throughout the year in response to sea-sonal changes observed in assimilation and respiration (Arneth et al., 2002a; Lloyd et al., 2002; Tchebakova et al., 2002; Veenendaal et al., 2004).
The instrumentation was in place from June 1998–November 2000 at the Zotino mire, June 1998–present at the Zotino pine forest, May 2000–October 2000 at the
10
Zotino birch forest, and February 1999–November 2001 at the Mopane woodland. In what follows we concentrate on data from the two consecutive years 1999 and 2000. Our interest lies with the underlying controls on canopy physiology, rather than re-porting annual totals (for these cf. above referenced publications), and we therefore divide the measured ecosystem-atmosphere exchange of CO2 (NEE) into its
compo-15
nent fluxes assimilation (A) and respiration (R). In case of the Siberian ecosystems, Arrhenius-type relationships of measured night-time NEE (=R) with soil temperature were established, and by using these, R were extrapolated to daylight hours (Lloyd and Taylor, 1994; Arneth et al., 2002a; Shibistova et al., 2002). In the Mopane wood-land, ecosystem respiration rates were frequently confined by soil moisture rather than
20
by temperature. During these dry parts of the year, half-hourly night-time rates under unstable conditions did not vary much and averages were calculated for a number of nights (typically one to two weeks) to be extrapolated to the daytime hours. During the summer months, respiration rates responded in a pulse-like manner to the episodic rain events and calculations were performed for each one to two days separately. Due
25
to logistical constraints at the remotes sites, estimates of night-time canopy storage of CO2 from concentration profiles could only be calculated for the Scots pine forest (Lloyd et al., 2002). Since over a day time-integrated storage is normally zero this will not influence the respiration totals for any of the three forests. Inclusion of storage
BGD
3, 345–382, 2006
Water use and NEE in boreal and semi-arid
ecosystems A. Arneth et al. Title Page Abstract Introduction Conclusions References Tables Figures J I J I Back Close
Full Screen / Esc
Printer-friendly Version Interactive Discussion
EGU
would also have little impact on the observed seasonal variation and climate response. However, the absolute half-hourly eddy flux respiration data from the Mopane wood-land and the Downy birch forest are likely to be somewhat too low due to the absence of CO2 storage estimates. But because of the rather open structure of the canopies and the u*-threshold imposed for data screening the effects are expected to be small
5
(Veendendaal et al., 2004).
The surface conductance for water vapour exchange with the atmosphere was calcu-lated from ecosystem latent heat fluxes using the Penman Monteith equation (Kelliher et al., 1993). Changes in leaf area index in the deciduous ecosystems were estimated from the ratio of radiation measured below and above the canopy (Betula) and from
re-10
mote sensing information (Mopane). For the Betula stand, sporadic LAI measurements were also performed using a LiCor LAI 2000 canopy analyser (R ¨oser et al., 2002). For the Mopane site, remote sensing-based LAI were derived from MODIS channels 1 and 2, which are specifically designed for vegetation monitoring, and are available at 250 m resolution (Justice et al., 1998). Atmospherically corrected reflectances
(Ver-15
mote and Vermeulen, 1999) were used to obtain LAI on a daily basis. These are based on calculating Normalized Difference Vegetation Index (NDVI) values from visible and near-infrared surface reflectances after a visual cloud cover check. The NDVI were, in turn, applied to semi-empirical relationships (Choudhury, 1987; Choudhury et al., 1994) to arrive at fractional vegetation cover and LAI estimates. This procedure differs
20
from the one used to produce the global MODIS LAI-products (Myneni et al., 2002) but comparison revealed similar trends. Furthermore, spatial as well as temporal res-olution is considerably higher than the standard products, and within season-variation was higher, potentially leading to improved monitoring of pulse-like responses.
4 Results and discussion
25
The period of plant assimilation in seasonal environments is frequently denoted as “green” or “growing” season. Using this terminology to describe physiological activity
BGD
3, 345–382, 2006
Water use and NEE in boreal and semi-arid
ecosystems A. Arneth et al. Title Page Abstract Introduction Conclusions References Tables Figures J I J I Back Close
Full Screen / Esc
Printer-friendly Version Interactive Discussion
at the ecosystem level is difficult though, as autotrophic and heterotrophic respiration contribute substantially to the total amount of carbon exchanged with the atmosphere. What is more, the seasonal courses of ecosystem assimilation and respiration rate are frequently out of phase (Falge et al., 2002). For instance, in deciduous forests a dis-tinct respiration peak has been observed just after leaf fall. This peak occurs when
5
assimilation rates are zero, but it nonetheless represents an active period in the sys-tem that corresponds to the rapid decay of readily available carbon in the freshly fallen leaves (Granier et al., 2002). Hence we adopt here the terms “active” vs. “dormant” season, and refer with “active” to the period characterised by relatively high rates of either assimilation or respiration that are observed during the more balmy parts of the
10
year. This period thus exceeds the green or growing season, as it can commence before new leaf-growth and continue beyond senescence. We also explicitly acknowl-edge continuation of some ecosystem activity during the dormant period, particularly heterotrophic respiration, since the low rates of CO2efflux observed in the cold or dry season can sum up to a sizeable portion of the annual budget and must not be ignored
15
(Hanan et al., 1998; Lafleur et al., 2001; Arneth et al., 2002a; Shibistova et al., 2002; Aurela et al., 2004; Veenendaal et al., 2004).
To alleviate comparison of the seasonality in the observed carbon exchange rates in ecosystems that represent diverse biomes from both hemispheres we define the onset of the active period as the first day following the month of August when rain
ex-20
ceeds 10 mm (Botswana), and the first day after January with average air temperature exceeding 0◦C (Siberia), respectively. These thresholds may appear somewhat arbi-trary at first; but for the rapidly changing climatic conditions that are found in extremely seasonal environments it has been shown that the associate physiological responses indeed resemble such a threshold-type behaviour (Suni et al., 2003; Arneth et al.,
25
2006). And consequently, as the onset of the active period may vary by several weeks from year to year, this approach allows us to focus on the rate, nature and magnitude of the response, rather than the calendar date per se.
BGD
3, 345–382, 2006
Water use and NEE in boreal and semi-arid
ecosystems A. Arneth et al. Title Page Abstract Introduction Conclusions References Tables Figures J I J I Back Close
Full Screen / Esc
Printer-friendly Version Interactive Discussion
EGU
4.1 Seasonal patterns of ecosystem assimilation and respiration
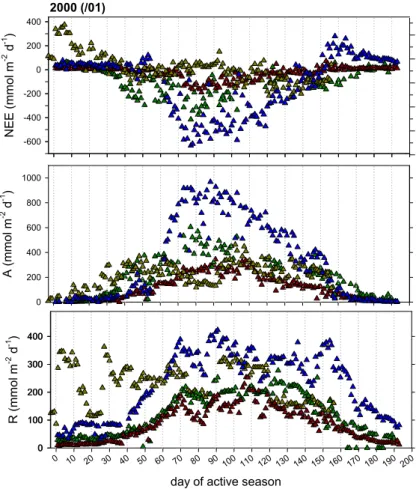
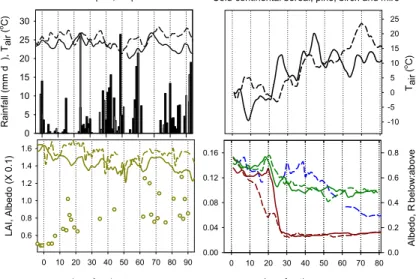
In Figs. 1 and 2 daily NEE, ecosystem assimilation (A) and respiration (R) are sum-marised for two consecutive active seasons, 1999/2000 and 2000/2001 in case of the Mopane woodland, and 1999 and 2000 in case of the Siberian ecosystems. The com-plementary daily climate conditions are plotted in Fig. 3, but concentrating here on the
5
first two to three months of the active season.
In the semi-arid tropics, a profound interannual variation is typical for both, the onset and the continuation of the rainy season, and the two study years provide illustrative examples. In 1999, the first rain event of the summer exceeding 10 mm was observed on 26 November – in the following year this occurred more than twenty days earlier (2
10
November 2000). Rainfall measurements taken since 1922 at Maun airfield approxi-mately 20 km from the study site indicate that rain exceeding 10 mm day−1falls typically not before mid to late October. While commencing later, the continuation of the rainy season 1999/2000 was relatively regular, dry spells between December and February rarely exceeded 5 days (Fig. 3, black bars). By contrast, the rainy season 2000/2001
15
proceeded in a rather irregular pattern that included several dry periods of close to two weeks (white bars). During these dry periods air temperatures were naturally also warmer by several degrees (dashed line).
In both years little rain had fallen already during October (<10 mm in total) and these few and short events would have brought the Mopane buds close to burst (E.
Vee-20
nendaal, personal observation). Leaf area index measurements were not available for the site. The Modis 250 m-resolution data for 2000/2001 indicate a nearly immediate leaf-out following the onset of the rains, with a rapidly increasing leaf area index to 0.8 within the first 10 days of the active season (Fig. 3, circles). Subsequently, LAI con-tinued to increase to ca. 1.0–1.2 at fully developed canopy (Veenendaal et al., 2004).
25
Corresponding with leaf emergence was an initial drop in the above canopy short wave albedo below daily averages of 0.16 (Fig. 3) declining to ca. 0.12 at the height of the rainy season (not shown).
BGD
3, 345–382, 2006
Water use and NEE in boreal and semi-arid
ecosystems A. Arneth et al. Title Page Abstract Introduction Conclusions References Tables Figures J I J I Back Close
Full Screen / Esc
Printer-friendly Version Interactive Discussion
In the cold continental climate of Siberia, average air temperatures exceeded zero
◦
C for the first time at around the same day in the two study years (9 and 11 April, respectively) but considerable differences in terms of the subsequent speed of warming and snow melt were observed (Fig. 3; Arneth et al., 2006). Average daily temperatures can be above zero degrees at least as early as 1 April in the region, but the frequency
5
of days >0◦C increases considerably after mid-April (http://www.ncdc.noaa.gov). Yet even until mid-May may average air temperature fall below −10◦C in the occasional year. With warming temperatures and the disintegration of the snow cover the surface’s radiation balance changed considerably. Albedo of the mire dropped from pre-melt 0.7– 0.8 to active season values below 0.2, with distinct differences in the rate of the decline
10
reflecting the slower melt in 2000. In the pine forest, where the snow-free canopy in spring masked the still snow-covered soil surface, albedo decreased from 0.15 to 0.10 during that period (Arneth et al., 2006). There were no albedo measurements available from the deciduous birch forest but the rapidly decreasing ratio of below:above canopy radiation after 38 days into the active season indicates leaf emergence, which was
15
nearly completed about two weeks later when only 30% of the radiation entering the system reached the understorey and soil surface. By July, LAI was 2.2, with a maximum (2.6) in August.
In the evergreen forests and mires of the cold boreal environment, CO2assimilation can “switch on” with extraordinary alacrity as soon as snow begins to melt (Fig. 4).
20
This fast physiological response ensures uptake and use of available resources over the very short summer and hence the plant’s – and thus ecosystem’s – survival over the entire year. In case of the pine forest, low carbon assimilation rates may already be attained in spring when snow still covers the ground as long as air temperatures are positive (Suni et al., 2003; Arneth et al., 2006; Fig. 4/year 2000).
25
In deciduous forests, a lag between the onset of the active season and commence-ment of ecosystem assimilation is naturally to be expected. But in both, Mopane and Downy birch an immediate onset of ecosystem activity was observed nonetheless: in terms of respiration rather than assimilation (Fig. 1, 2). In the Mopane woodland, the
BGD
3, 345–382, 2006
Water use and NEE in boreal and semi-arid
ecosystems A. Arneth et al. Title Page Abstract Introduction Conclusions References Tables Figures J I J I Back Close
Full Screen / Esc
Printer-friendly Version Interactive Discussion
EGU
first rainfalls of the season caused an instantaneous increase of respiration by a factor of four to eight. Carbon assimilation was discernible about 10 days later (Figs. 1, 2 and 4). In years with a regular rainy season (1999/2000) the canopy reached its up-take capacity of around 15 µmol m−2s−1 (or 400–450 mmol m−2d−1) within about two months. Assimilation and respiration rates remained balanced for a large part of the
5
early active season, and days with positive NEE were observed throughout; it was only after the rains had started to cease that A exceeded R and NEE became negative for a prolonged period (Figs. 1, 2; Veenendaal et al., 2004).
In the Siberian birch forest, daily R doubled from 50 to 100 mmol m−2d−1 within 5 days of average positive air temperatures. Leaf-emergence was accompanied by a
fur-10
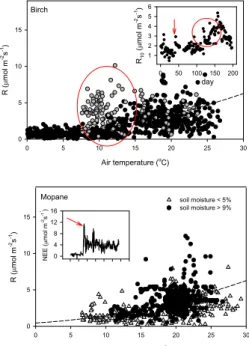
ther, distinct increase in R (Figs. 2, 3). Simultaneously, respiration rates expressed at 10 degrees (R10; Lloyd and Taylor, 1994) increased rapidly from 1.3 to 1.8 µmol m−2s−1 (Fig. 5 inset, arrow), paying evidence to this fundamental rise in R being caused by physiological activity rather than by warming temperatures alone: the growth respira-tion of the new leaves as well as enhanced tree root and fungal or microbial activity.
15
Assimilation accelerated another 10 days later, when rates increased rapidly to val-ues up to 1000 mmol m−2d−1; for the major part of the active season daily birch forest assimilation exceeded rates in the other three ecosystems by a factor of up to three.
The observed step-increase in respiration rates early in the active season may be a general feature of deciduous forests irrespective of their growth environment or
leaf-20
type. It has been observed in a deciduous coniferous larch forest of Eastern Siberia (where rates quite suddenly increased from less than 1 µmol m−2s−1to maxima around 5 µmol m−2s−1, Dolman et al., 2004), as well as in the temperate biome (Granier et al., 2002), yet it was notably absent from the Scots pine forest and from mixed evergreen dark taiga forests growing nearby the Betula stand (R ¨oser et al., 2002). It may well
25
represent an important evolutionary trait of the entire system. Warming spring tem-peratures accelerate fungal and/or microbial activity (Clein and Schimel, 1995) and hence nutrient mineralization, which occurs simultaneously with enhanced root activity by the trees as leaves emerge. The sharp respiration increase thus likely is not limited
BGD
3, 345–382, 2006
Water use and NEE in boreal and semi-arid
ecosystems A. Arneth et al. Title Page Abstract Introduction Conclusions References Tables Figures J I J I Back Close
Full Screen / Esc
Printer-friendly Version Interactive Discussion
to autotrophic growth respiration but it includes a significant heterotrophic component, pointing towards a finely tuned system-level interaction between tree-root nutrient de-mand and supply via decomposers.
Throughout the year, an ecosystems’ “capacity” for respiration varies since plant growth and maintenance respiration, and heterotrophic activity respond rather
plasti-5
cally to varying environmental conditions (e.g., Law et al., 1999; Arneth et al., 2002a; Shibistova et al., 2002; Atkin and Tjoelker, 2003; Pendall et al., 2004). Over a period of weeks to months, the exponential respiration-temperature response which typically dominates the short-term variation in respiration rates is thus mediated by additional factors, like available soil moisture or phenology. Hence for instance the clear increase
10
in R10 associated with leaf growth in the birch forest indicated above. Later in the year, a further steep increase in respiration rates (day 130 to 160; Fig. 5, circled and grey data) was equally unrelated to changes in air temperature. During this period, R10rose rapidly from values around 1.8 µmol m−2s−1to close to 5 µmol m−2s−1, such that at air temperatures of 8–12◦C respiration rates were similar to those measured during the
15
warmest parts of the year. It is unlikely that sudden changes in soil moisture played a major role, these data were collected at the end of August 2000 which saw sufficient rain (Arneth et al., 2002a). Leaf fall in the birch forest began around day 150, identified from the rapidly increasing ratio of radiation measured below and above the canopy (not shown). A prompt decomposition of relatively labile carbon readily available in the
20
fresh litter might have explained the rapid increases in R10 and respiration rates – ex-cept that the observed increase in R10preceded litter fall. It is unclear whether the spot radiation measurements that serve as indicator for changes in canopy LAI were su ffi-ciently precise to represent the entire forest; there may well have been some shedding of leaves that was not picked up by the radiation sensors. However, autumnal leaves
25
when still attached contain proteases and proteins that are associated with respiration and the breakdown of molecules (Bhalerao et al., 2003), and broad-leaf trees generally appear to either maintain or increase leaf respiration during senescence (Collier and Thibodeau, 1995). The remobilisation of leaf nutrients therefore is likely the cause for
BGD
3, 345–382, 2006
Water use and NEE in boreal and semi-arid
ecosystems A. Arneth et al. Title Page Abstract Introduction Conclusions References Tables Figures J I J I Back Close
Full Screen / Esc
Printer-friendly Version Interactive Discussion
EGU
the observed autumnal increase in Betula respiration before the onset of leaf fall. In the Botswana Mopane woodland, respiration rates accelerated immediately after the first rains (Figs. 1, 2, 5 inset). Afterwards, mean rates increased with continuation of the rainy period as the soil moisture storage became replenished – which fosters microbial as well as root activity –, but with additional pulse-responses observed after
5
rain events. A combined physical and biological response of CO2efflux in response to environmental factors is typical for seasonally dry environments. As a consequence, there was a clear separation of respiration rates being higher at a given temperature when soil moisture measured over 10 cm depth exceeded 9%, compared to rates when soil moisture was below 5% (Fig. 5). In the moisture range between 5 and 9% the
10
separation was less obvious. Short rain events, wetting only the surface, would not necessarily have been clearly visible in the soil moisture signal. But they could still lead to immediate CO2efflux, partially due to a response of microbes and roots growing very close to the soil surface, but also due to physical effects of wind-related pressure fluctuations on CO2 efflux from porous soils (Kimball and Lemon, 1971). Such
pulse-15
respiration responses, smaller in magnitude, have also be found for the Siberian pine and larch forests (e.g., Kelliher et al., 1999; Dolman et al., 2004) and they obliterate the respiration-temperature relationship (Arneth et al., 1998).
Maximum instantaneous A in birch and Mopane were more or less identical after about two months into the active season (12–14 µmol m−2s−1, Fig. 4). It is not possible
20
across biomes to extrapolate from maximum uptake to daily integrals because of, in this case, the dissimilar number of daylight hours (Q>20 µmol m−2s−1 for 17 h in Siberia, vs. 12 h in Botswana), as well as a pronounced hysteresis, such that Mopane carbon assimilation rates were distinctly lower in the afternoon when stomata closed during periods of high air saturation deficits (Fig. 4, arrows). This hysteresis nearly
com-25
pletely eliminated the typical hyperbolic assimilation – light response at the Botswana site for some days. While A of the Mopane peaked around 15 µmol m−2s−1, canopy assimilation of the birch canopy continued to increase to summer maxima close to 30 µmol m−2s−1, resulting in maximum daily active season A of about twice the one
BGD
3, 345–382, 2006
Water use and NEE in boreal and semi-arid
ecosystems A. Arneth et al. Title Page Abstract Introduction Conclusions References Tables Figures J I J I Back Close
Full Screen / Esc
Printer-friendly Version Interactive Discussion
in Botswana (R ¨oser et al., 2002; Veenendaal et al., 2004). Therefore, when all four systems are summarised side by side (Table 1), it is the Betula stand that during the active period had the highest average daily rates of A, R and highest instantaneous (half-hourly) assimilation (but not respiration, cf. Fig. 5), whereas the mire had lowest rates. These convert into highest and lowest mean and peak NEE during the period of
5
carbon assimilation for the Betula stand and the mire, respectively. It is problematical to assess these results in terms of more a comprehensive ranking of ecosystem NEE based on the FLUXNET data set (Falge et al., 2002), since this has been performed for maxima, minima and averages of instantaneous (hourly or half-hourly) net exchange – whereas our focus lies with daily rates, and the physiologically defined components A
10
and R. But our results emphasise the fact that if a grouping of ecosystems in terms of their carbon-atmosphere exchange is to be possible at all, a large number of studies is required from both hemispheres representing all ecosystem types in a region, to sep-arate effects of climate from those of phenology, vegetation type, ecosystem age and history (Falge et al., 2002).
15
In the Scots pine forest, assimilation rates were of the same order of magnitude compared to the Mopane woodland, whereas respiration rates were more similar to the mire. Annual NEE of the Scots pine forest exceeded net uptake in the mire by a factor of five to six (ca. −13 vs. −2 to −3 mol m−2; (Arneth et al., 2002a; Lloyd et al., 2002) while the Mopane woodland was nearly carbon neutral (Veenendaal et al., 2004); uptake
20
during the “green” period in the Betula stand was −25 mol m−2. Assuming an average daily winter loss of 45 mmol m−2d−1, based on the pre-melt CO2efflux measured in the Betula stand (R ¨oser et al., 2002), would result in an annual total of ca. −13 mol m−2, similar to the best-guess for the pine forest growing just across the river. But likely, these speculated winter losses are too high, as the measurements in spring had begun
25
when soil temperatures would have already warmed to a certain degree. Therefore, it is very likely that NEE in the Betula forest was highest (most negative) of the four systems compared here.
BGD
3, 345–382, 2006
Water use and NEE in boreal and semi-arid
ecosystems A. Arneth et al. Title Page Abstract Introduction Conclusions References Tables Figures J I J I Back Close
Full Screen / Esc
Printer-friendly Version Interactive Discussion
EGU
4.2 Canopy carbon-water relations in seasonal environments
A well established hypothesis that seeks to combine the conundrum of plant water loss and carbon uptake argues that stomata serve to optimise the two by minimising water loss per carbon gain (Cowan, 1977, 1982). This concept has been applied successfully on the leaf level, and can be mathematically expressed in a linearised way as
5
Gs = Aλ0.5/[D(Ca−Γ)/1.6]0.5,
where Gs is stomata (canopy-, or surface-, see below) conductance, D is air saturation deficit at the leaf or canopy level, Ca is ambient carbon dioxide concentration, and Γ is the CO2 compensation point (Lloyd, 1991; Lloyd et al., 1995). Hence, plotting Gs
vs. A/[D(Ca–Γ)/1.6]0.5yields a slope equivalent to λ0.5, where λ is a Lagrange multiplier
10
denoting the leaf’s marginal water use per carbon gain, which should remain constant over a period of one to few days at least. Large values of lambda are typically found for plants with a non-conservative water use.
The above expression has been successfully applied in a big-leaf approach to anal-yse the Scots pine canopy photosynthesis and conductance (Lloyd et al., 2002). It
15
also provided the basis to interpret a tree-ring stable carbon isotope record in stems of Scots pine trees growing few hundred metres from the pine forest flux tower (Arneth et al., 2002b). Extending this analysis from the tree canopy to the entire ecosystem would be problematic in a multilayer-canopy with distinct understorey vegetation, due to the contribution of below canopy carbon and water fluxes to the measured total. But
20
the three forests compared here have little ground vegetation and for that reason the day-to-day variation in assimilation and evapotranspiration during the active season will be dominated by processes taking place at the canopy level. Thus, as our main focus lies with the relative ecosystem response to seasonal changes in weather and phenology, the analysis can be adopted on that scale. Gs in the equation above is
25
consequently surface conductance, calculated from measured latent heat fluxes using the Penman-Monteith equation (e.g., Kelliher et al., 1993), and A is ecosystem assim-ilation. A similar analysis is not useful for the mire. There, stomata of vascular plant
BGD
3, 345–382, 2006
Water use and NEE in boreal and semi-arid
ecosystems A. Arneth et al. Title Page Abstract Introduction Conclusions References Tables Figures J I J I Back Close
Full Screen / Esc
Printer-friendly Version Interactive Discussion
control an unknown, seasonally strongly varying and often small proportion of the total water vapour flux, or of the carbon assimilated; a sizeable percentage of carbon and/or water fluxes would have been via Sphagnum and other mosses, or free water surfaces. Figure 6 shows the above relationship for the two deciduous ecosystems, the data being grouped into 30-day intervals from early on in the active season. The lines are
lin-5
ear regressions, and for reasons of clarity are shown for a select number of periods only (but cf., Fig. 7). Offsets of the regressions were typically less than ±0.03 mol m−2s−1. Considering the inherent scatter in eddy flux data, and the uncertainties and poten-tial sources of error associate with deriving assimilation and surface conductance from flux measurements, these are unlikely to be significantly different from zero and
sub-10
sequently the regressions were all plotted through the origin, which facilitates the com-parison.
There are two important observations to be made. Firstly, the slopes of the linear regressions in the Siberian birch (33 to 43, suggesting λ around 1100–1800 mol mol−1) were generally about half to two thirds of the ones found for the Mopane woodland
15
throughout the 1999/2000 and 2000/2001 rainy season. Or in other words, the high assimilation rates of the birch canopy were achieved at a relatively more conservative water use compared to the generally lower assimilation rates at considerably more aggressive water use in the Mopane woodland – despite the latter growing in a hot climate, with dry spells even during the rainy season. Still, the maximum regression
20
slope of the birch forest was 1.5 times the one calculated for the Scots pine canopy, where slopes were 20 and 29 in the two consecutive years 1999 and 2000 (Lloyd et al., 2002).
The second observation to be made is the presence or absence of a month-to-month or year-to-year variation in the respective canopy’s water use strategy, which
25
is reflected in this slope. For instance, for the data from the Mopane woodland dur-ing and after the rainy season 1999 (Fig. 6, top panel) slopes durdur-ing consecutive 30-day periods were similar or only little higher than those calculated for the birch forest, and in both ecosystems variation between the periods shown was rather small
when-BGD
3, 345–382, 2006
Water use and NEE in boreal and semi-arid
ecosystems A. Arneth et al. Title Page Abstract Introduction Conclusions References Tables Figures J I J I Back Close
Full Screen / Esc
Printer-friendly Version Interactive Discussion
EGU
compared to the 1999/2000 and 2000/2001 Mopane data. In the Siberian Scots pine canopy, a noteworthy monthly variation of the canopy’s water use within a season was equally absent, but a significant difference in slope was observed between the two years 1999 and 2000, which was apparent already from very early on in the growing season on canopy and whole ecosystem level (Lloyd et al., 2002; Arneth et al., 2006).
5
In other years, however, in the Mopane woodland variation of the ecosystem’s water use strategy could well be large, the slopes varying by 50% and more within one active season, sometimes even from one period to the next (cf. in 2000/2001). This variation was not progressive in the sense, that it did not reflect a gradual change in the wood-land’s water use as the active season progressed. This could well have been plausible
10
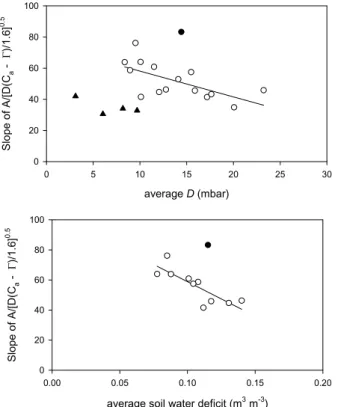
due to, e.g., ageing leaves or the refill of the soil profile with water. Nevertheless the slope of the relationship, and thus ecosystem λ, should be related to some degree to variation in air saturation deficit and/or soil water supply as both significantly constrain Gs. Soil moisture content and air saturation deficit naturally vary in concert, hence D was higher on average during periods with little or no rain (not shown). In a simple
15
analysis, the observed variation in the ecosystems water use strategy was therefore plotted against variation in average D (Fig. 7, top panel) and average daily soil mois-ture deficit in the top 10 cm (bottom panel). One outlier was observed during the very early stages of the active season 1999/2000, when the leaves were just emerging, but for the remainder up to 70% of the variation could be explained that way. The overall
20
lower slopes observed in the second half of the rainy period 1998/1999 for the Mopane canopy (Fig. 6, top panel) thus may well reflect the low total amount of precipitation received, as the summer 1998/1999 was relatively dry (total precipitation <400 mm). This analysis indicates a strong constraint by dry and hot conditions on variations in Mopane λ – but also a surprisingly non-conservative water use overall when put into a
25
larger biogeographical context. For the Siberian birch forest, soil moisture data were not available, but no obvious relationship existed with average D (Fig. 7). Yet, D varied much less in the continental climate over an active season compared to the semi-arid tropics, and in any case, four months of data limit the interpretation.
BGD
3, 345–382, 2006
Water use and NEE in boreal and semi-arid
ecosystems A. Arneth et al. Title Page Abstract Introduction Conclusions References Tables Figures J I J I Back Close
Full Screen / Esc
Printer-friendly Version Interactive Discussion
It is well established in the ecophysiological literature that leaf level λ, or water use ef-ficiency, do not necessarily remain constant over periods longer than few days (Schulze and Hall, 1982). But on ecosystem level, the plasticity in the “aggressiveness” with which the vegetation can use the available water has only been recognised recently. Lloyd et al. (2002) did not find obvious monthly variation in λ for the Siberian Scots pine
5
canopy, even though precipitation during some summer months was as low as 30 mm during the two study years (Arneth et al., 2002a). However, the significant difference in λ between years was obvious right from the onset of the active period. In Scots pine trees growing nearby the Siberian eddy flux tower variation in stem cellulose car-bon isotope ratios could be explained using a coupled assimilation-conductance model
10
that accounted for a reduction of stomatal conductance, and λ, as soils dried (Arneth et al., 2002b). Since it is the combination of water and nutrient availability that influ-ences stomatal and canopy conductance, photosynthetic capacity and hence water use strategies, the history in environmental conditions (e.g., soil water table level, soil temperatures) may be an important factor to explain variation in λ on interannual time
15
steps. For instance, the availability and partitioning of carbohydrates for fine root growth can affect both present but also subsequent water and nutrient uptake – even in the following season, which may explain the observations made in the Siberian pine forest (Lloyd et al., 2002). A similar possibility was brought up to interpret results from soil warming experiments of Scots pine stands in Sweden, where effects of the previous
20
years’ warming were detected in the subsequent years’ transpiration (Mellander, 2003). For the Mopane woodland, the data indicate a rather more rapid response of canopy conductance to current environmental constraints, whereas it is unfortunately unknown whether λ in the Downy birch forest would vary between years.
In the context of these observations it is also of interest to investigate how much a
25
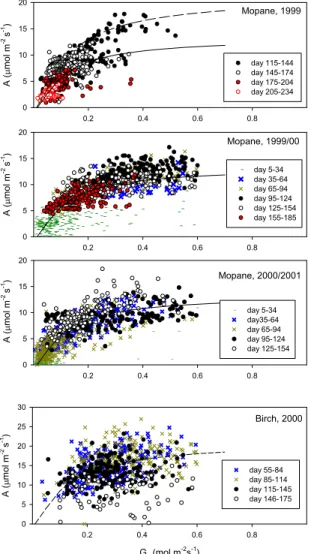
variation in ecosystem photosynthetic capacity would contribute to the variation in λ, due to the close coupling of assimilation and transpiration via the stomata. Figure 8 illustrates the relationship between ecosystem assimilation and surface conductance for the periods shown in Fig. 6, displaying the typical saturation of A at high values of
BGD
3, 345–382, 2006
Water use and NEE in boreal and semi-arid
ecosystems A. Arneth et al. Title Page Abstract Introduction Conclusions References Tables Figures J I J I Back Close
Full Screen / Esc
Printer-friendly Version Interactive Discussion
EGU
G with a very small offset being due to the use of surface values. This relationship can be examined in terms of the carboxylation efficiency, k (e.g., Lloyd et al., 2002), since a higher k results in higher rates of carbon assimilation at a given Gs. When the data was plotted that way some intriguing monthly and interannual differences in k were dis-cernible – the second half of the rainy season 1998/99 standing out in particular for the
5
Mopane woodland, when ecosystem carboxylation efficiency for some time exceeded the values calculated for the following rainy seasons notably, with a proportion of the data defined by k=0.085 mol m−2s−1bar−1. This value was more or less identical to the average carboxylation efficiency of the Siberian Downy birch forest, where the scat-ter in the data was, however, much higher. During 1999/2000 and 2000/2001, and also
10
for parts of the 1998/1999 rainy season, k in the Mopane woodland were considerably lower. In the figure, identical lines with k=0.061 are drawn for all three Mopane rainy season data sets. With the exception of 1999, most of the data suggest relatively mi-nor variation in k, some periods having little higher (e.g., days 95–124 in 1999/2000, and 125–154 in 2001/2002), or lower values on average (data from days 95–124 in
15
2000/2001). This variation was not related to variation in the water use strategy shown in Fig. 6. For instance, λ was 3025 and 4900 in the two example periods with k>0.061, compared to 3360 for the example period with k slightly below 0.061. These observa-tions contrast the pattern observed for the Siberian Scots pine canopy, where k were 0.056 and 0.062 for the two consecutive years, respectively, but in this case higher k
20
did coincide with higher λ (Lloyd et al., 2002). 4.3 Summary
Not surprisingly, in highly seasonal environments ecosystem activity accelerates im-mediately as soon as suitable climate conditions set in. The character of this initial response varies, however. In the four examples presented here, it was dominated by
25
assimilation in the evergreen conifer forest and by respiration in deciduous canopies, whereas in the mire A and R increased more or less simultaneously. Where new leaves need to be grown at the onset of the active period, the initial respiration response may
BGD
3, 345–382, 2006
Water use and NEE in boreal and semi-arid
ecosystems A. Arneth et al. Title Page Abstract Introduction Conclusions References Tables Figures J I J I Back Close
Full Screen / Esc
Printer-friendly Version Interactive Discussion
be an important adaptation on the system level, reflecting not only autotrophic growth respiration but also stimulation of mineralization, which makes nutrients available for uptake by the tree roots. Overall, the two deciduous systems had the highest rates of respiration throughout most of the active season, despite the very different growth environments compared here. In terms of instantaneous and integrated R, A, or NEE,
5
there was no obvious general difference between Siberian ecosystems on the one hand, and the woodland from the semi-arid tropics on the other; this result is, however, limited by the fact that ecosystem flux studies from tropical savannas and woodlands are extremely scarce.
Our observations made under a broad range of climate conditions speak for the
10
capability of forests to respond rather plastic in terms of their water use strategy. The latter may vary significantly between years and even between months, as a result of either short-term weather fluctuations or longer term effects of carbon allocation and growth. Of the three forests compared here, it was the Mopane stand in the semi-arid environment that had the least conservative water use strategy during periods when
15
soil water was available; however, the response of the canopy could change rapidly to low values of λ (implying a more moderate water use) during sporadic dry periods, or in rainy seasons with low precipitation overall. Considering the fickle nature of rainfall in the semi-arid tropics the non-conservative water use during times when water is available as a resource, combined with a rapid response to periods with no or little
20
rain may help to optimise carbon gain over the entire active period. In these latter periods, values of λ approached those observed in the deciduous Siberian birch, but were still higher than those calculated for the Scots pine canopy. While some variation in photosynthetic capacity was evident, it appears that in Mopane most of the observed variation in system water use strategy was related to changes in canopy conductance.
25
Acknowledgements. The flux measurements in Siberia were supported by the European
Com-mission in the project EuroSiberian Carbonflux. A. Arneth acknowledges support from New Zealand Foundation for Research, Science and Technology for the research in Siberia and from the Deutsche Forschungsgemeinschaft for the research in Botswana. A multitude of
peo-BGD
3, 345–382, 2006
Water use and NEE in boreal and semi-arid
ecosystems A. Arneth et al. Title Page Abstract Introduction Conclusions References Tables Figures J I J I Back Close
Full Screen / Esc
Printer-friendly Version Interactive Discussion
EGU
ple from the MPI Biogeochemistry in Jena and from the Krasnoyarsk Forest Institute contributed with skill and patience to the maintenance of the eddy flux sites in Siberia.
References
Arneth, A., Kelliher, F. M., Gower, S. T., Scott, N. A., Byers, J. N., and McSeveny, T. M.: En-vironmental variables regulating soil carbon dioxide efflux following clear-cutting of a Pinus
5
radiata D. Don plantation, J. Geophys. Res., 103, 5695–5705, 1998.
Arneth, A., Kurbatova, J., Kolle, O., Shibistova, O., Lloyd, J., Vygodskaya, N. N., and Schulze, E.-D.: Comparative ecosystem – atmosphere exchange of energy and mass in a European Russian and a central Siberian bog II. Interseasonal and interannual variability of CO2fluxes, Tellus, 54B, 514–530, 2002a.
10
Arneth, A., Lloyd, J., ˇSantrukov ´a, H., Bird, M., Grigoriev, S., Gleixner, G., and Schulze, E.-D.: Response of central Siberian Scots pine in to soil water deficit and long-term trends in atmospheric CO2concentration, Global Biogeochem. Cycles, 16, 5/1–5/13, 2002b.
Arneth, A., Lloyd, J., Shibistova, O., and Kolle, O.: Snow melt in the boreal environment: explor-ing sprexplor-ing energy and CO2fluxes in two typical central Siberian ecosystems, Boreal Environ.
15
Res., in press, 2006.
Atkin, O. K. and Tjoelker, M. G.: Thermal acclimation and the dynamic response of plant respi-ration to temperature, Trends in Plant Science, 8, 343, 2003.
Aurela, M., Laurila, T., and Tuovinen, J. P.: The timing of snow melt controls the annual CO2 balance in a subarctic fen, Geophys. Res. Lett., 31, L16119, doi:10.1029/2004GL020315,
20
2004.
Bhalerao, R., Keskitalo, J., Sterky, F., Erlandsson, R., Bjorkbacka, H., Birve, S. J., Karlsson, J., Gardestrom, P., Gustafsson, P., Lundeberg, J., and Jansson, S.: Gene expression in autumn leaves, Plant Physiology, 131, 430–442, 2003.
Bond, W. J., Woodward, F. I., and Midgley, G. F.: The global distribution of ecosystems in a
25
world without fire, New Phytologist, 165, 525–538, 2005.
Bowman, D. and Prior, L. D.: Why do evergreen trees dominate the Australian seasonal trop-ics?, Australian J. Botany, 53, 379–399, 2005.
Choudhury, B. J.: Relationships between vegetation indices, radiation absorption, and net pho-tosynthesis evaluated by a sensitivity analysis, Remote Sens. Environ., 22, 209–233, 1987.
BGD
3, 345–382, 2006
Water use and NEE in boreal and semi-arid
ecosystems A. Arneth et al. Title Page Abstract Introduction Conclusions References Tables Figures J I J I Back Close
Full Screen / Esc
Printer-friendly Version Interactive Discussion
Choudhury, B. J., Ahmed, N. U., Idso, S. B., Reginato, R. J., and Daughtry, C. S. T.: Rela-tions between evaporation coefficients and vegetation indices studied by model simulaRela-tions, Remote Sens. Environ., 50, 1–17, 1994.
Clein, J. S. and Schimel, J. P.: Microbial activity of tundra and taiga soils at sub-zero tempera-tures, Soil Biology and Biochemistry, 27, 1231–1234, 1995.
5
Collier, D. E. and Thibodeau, B. A.: Changes in respiration and chemical content during au-tumnal senescence of Populus tremuloides and Quercus rubra leaves, Tree Physiology, 15, 759–764, 1995.
Cowan, I. R.: Stomatal behaviour and environment, Adv. Botan. Res., 4, 117–128, 1977. Cowan, I. R.: Regulation of water use in relation to carbon gain in higher plants, in:
Physiolog-10
ical Plant Ecology II, p. 589–613, edited by: Lange, O. L., Nobel, P. S., Osmond, C. B., and Ziegler, H., Water Relations and Carbon Assimilation, Springer, Berlin, 1982.
Cox, P. M., Betts, R. A., Jones, C. D., Spall, S. A., and Totterdell, I. J.: Acceleration of global warming due to carbon-cycle feedbacks in a coupled climate model, Nature, 408, 184–186, 2000.
15
Dolman, A. J., Maximov, T. C., Moors, E. J., Maximov, A. P., Elbers, J. A., Kononov, V., Waterloo, M. J., and v. d. Molen, M. K.: Net ecosystem exchange of carbon dioxide and water of far eastern Siberian Larch (Larix cajanderii) on permafrost, Biogeosciences, 1, 133–146, 2004. Eklundh, L. and Olsson, L.: Vegetation index trends for the African Sahel 1982–1999, J.
Geo-phys. Res., 30, 13-1–13-4, doi:10.1029/2002GL016772, 2003.
20
Eugster, W. and Senn, W.: A cospectral correction model for measurement of turbulent NO2 flux, Boundary-Layer Meteorol., 74, 321–340, 1995.
Falge, E., Tenhunen, J., Baldocchi, D., Aubinet, M., Bakwin, P., Berbigier, P., Bernhofer, C., Bonnefond, J. M., Burba, G., Clement, R., Davis, K. J., Elbers, J. A., Falk, M., Goldstein, A. H., Grelle, A., Granier, A., Grunwald, T., Gudmundsson, J., Hollinger, D., Janssens, I. A.,
25
Keronen, P., Kowalski, A. S., Katul, G., Law, B. E., Malhi, Y., Meyers, T., Monson, R. K., Moors, E., Munger, J. W., Oechel, W., Paw, U. K. T., Pilegaard, K., Rannik, U., Rebmann, C., Suyker, A., Thorgeirsson, H., Tirone, G., Turnipseed, A., Wilson, K., and Wofsy, S.: Phase and amplitude of ecosystem carbon release and uptake potentials as derived from FLUXNET measurements, Agric. For. Meteorol., 113, 75–95, 2002.
30
Foley, J. A., Costa, M. H., Delire, C., Ramankutty, N., and Snyder, P.: Green surprise? How terrestrial ecosystems could affect earth’s climate, Frontiers Ecol. Environ., 1, 38–44, 2003. Friedlingstein, P., Bopp, L., Ciais, P., Dufresne, J.-L., Fairhead, L., LeTreut, H., Monfray, P., and
BGD
3, 345–382, 2006
Water use and NEE in boreal and semi-arid
ecosystems A. Arneth et al. Title Page Abstract Introduction Conclusions References Tables Figures J I J I Back Close
Full Screen / Esc
Printer-friendly Version Interactive Discussion
EGU
Orr, J.: Positive feedback between future climate change and the carbon cycle, Geophys. Res. Lett., 28, 1543–1546, 2001.
Gamache, I. and Payette, S.: Height growth response of tree line black spruce to recent climate warming across the forest-tundra of eastern Canada, J. Ecology, 92, 835–845, 2004. Granier, A., Pilegaard, K., and Jensen, N. O.: Similar net ecosystem exchange of beech stands
5
located in France and Denmark, Agric. For. Meteorol., 114, 75, 2002.
Hanan, N., Kabat, P., Dolman, A. J., and Elbers, J. A.: Photosynthesis and carbon balance of a Sahelian fallow savanna, Global Change Biology, 4, 523–538, 1998.
Heimann, M.: The Eurosiberian Carbonflux project, Tellus, 54B, 417–419, 2002.
H ´ely, C., Bremond, L., Alleaume, S., Smith, B., Sykes, M. T., and Guiot, J.: Sensitivity of
10
African biomes to changes in precipitation regime, Global Ecology and Biogeography, in press, 2006.
Hickler, T., Eklundh, L., Seaquist, J., Smith, B., Ard ¨o, J., Olsson, L., and Sj ¨ostr ¨om, M.: Precipitation controls Sahel greening trend, Geophys. Res. Lett., 32, L21415, doi:10.1029/2005GL024370, 2005.
15
Holtmeier, F. K. and Broll, G.: Sensitivity and response of northern hemisphere altitudinal and polar treelines to environmental change at landscape and local scales, Global Ecology and Biogeography, 14, 395–410, 2005.
Jarvis, P. J. and Linder, S.: Constraints to growth of boreal forests, Nature, 405, 904–905, 2000.
20
Jonsdottir, I. S., Virtanen, R., and Karnefelt, I.: Large-scale differentiation and dynamics in tundra plant populations and vegetation, Ambio, 28, 230–238, 1999.
Justice, C. O., Vermote, E., Townshend, J. R. G., Defries, R., Roy, D. P., Hall, D. K., Salomon-son, V. V., Privette, J. L., Riggs, G., Strahler, A., Lucht, W., Myeni, R. B., Knyazikhin, Y., Running, S. W., Nemani, R. R., Wan, Z., Huete, A. R., Leeuwen, W. V., Wolfe, R. E., Giglio,
25
L., Muller, J.-P., Lewis, P., and Barnsley, M. J.: The Moderate Resolution Imaging Spectro-radiometer (MODIS): Land remote sensing for global change research, IEEE Trans. Geosci. Remote Sens., 36, 1228–1249, 1998.
Kaplan, J., Bigelow, N. H., Prentice, I. C., Harrison, S., Bartlein, P. J., Christensen, T. R., Cramer, W., Matveyeva, N. V., McGuire, A. D., Murray, D. F., Razzhivin, V. Y., Smith, B.,
30
Walker, D., Anderson, P. M., Andreev, A. A., Brubaker, L. B., Edwards, M. E., and Lozhkin, A. V.: Climate change and Arctic ecosystems: 2. Modelling, paleodata-model comparisons, and future projections, J. Geophys. Res., 108, 8171, 2003.
BGD
3, 345–382, 2006
Water use and NEE in boreal and semi-arid
ecosystems A. Arneth et al. Title Page Abstract Introduction Conclusions References Tables Figures J I J I Back Close
Full Screen / Esc
Printer-friendly Version Interactive Discussion
Kelliher, F. M., Leuning, R., and Schulze, E.-D.: Evaporation and canopy characteristics of coniferous forests and grasslands, Oecologia, 95, 153–163, 1993.
Kelliher, F. M., Lloyd, J., Arneth, A., Luhker, B., Byers, J. N., McSeveny, T. M., Milukova, I., Grigoriev, S., Panfyorov, M., Sogatchev, A., Varlargin, A., Ziegler, W., Bauer, G., Wong, S. C., and Schulze, E. D.: Carbon dioxide efflux density from the floor of a central Siberian pine
5
forest, Agric. For. Meteorol., 94, 217–232, 1999.
Kimball, B. A. and Lemon, E. R.: Air turbulence effects upon soil gas exchange, Soil Sci. Soc. Amer. J., 35, 16–21, 1971.
Kurbatova, J., Arneth, A., Vygodskaya, N. N., Kolle, O., Varlargin, A. B., Milyukova, I. M., Tchebakova, N. M., Schulze, E.-D., and Lloyd, J.: Comparative ecosystem – atmosphere
10
exchange of energy and mass in a European Russian and a central Siberian bog I. Intersea-sonal and interannual variability of energy and latent heat fluxes during the snowfree period, Tellus, 54B, 497–513, 2002.
Lafleur, P. M., Roulet, N. T., and Admiral, S. W.: Annual cycle of CO2 exchange at a bog peatland, J. Geophys. Res., 106, 3071–3081, 2001.
15
Law, B. E., Ryan, M. G., and Anthoni, P. M.: Seasonal and annual respiration of a ponderosa pine ecosystem, Global Change Biol., 5, 169–182, 1999.
Lloyd, J.: Modelling stomatal responses to environment in Macadamia integrifolia, Australian J. Plant Physiol., 18, 649–660, 1991.
Lloyd, J., Grace, J., Miranda, A. C., Meir, P., Wong, S. C., Miranda, B. S., Wright, I. R., Gash, J.
20
H. C., and McIntyre, J.: A simple calibrated model of Amazon rainforest productivity based on leaf biochemical properties, Plant Cell Environ., 18, 1129–1145, 1995.
Lloyd, J., Shibistova, O., Zolotoukhine, D., Kolle, O., Arneth, A., Wirth, C., Styles, J. M., Tchebakova, N., and Schulze, E. D.: Seasonal and annual variations in the photosynthetic productivity and carbon balance of a central Siberian pine forest, Tellus, 54B, 590–610,
25
2002.
Lloyd, J. and Taylor, J. A.: On the temperature dependence of soil respiration, Functional Ecol-ogy, 8, 315–323, 1994.
Lucht, W., Prentice, I. C., Myneni, R. B., Sitch, S., Friedlingstein, P., Cramer, W., Bousquet, P., Buermann, W., and Smith, B.: Climatic control of the high-latitude vegetation greening trend
30
and Pinatubo effect, Science, 296, 1687–1689, 2002.
Mellander, P.-E.: Spring water stress in Scots pine: Interaction of snow and temperature, Swedish University of Agricultural Sciences, Stockholm, 2003.

![Fig. 6. Surface conductance for water vapour vs. A/[D(C a – Γ)/1.6] 0.5 in the two decidu-ous forests, Mopane and Downy birch](https://thumb-eu.123doks.com/thumbv2/123doknet/14795089.603405/37.918.47.426.74.564/surface-conductance-water-vapour-decidu-forests-mopane-downy.webp)