HAL Id: hal-00296166
https://hal.archives-ouvertes.fr/hal-00296166
Submitted on 27 Feb 2007
HAL is a multi-disciplinary open access
archive for the deposit and dissemination of
sci-entific research documents, whether they are
pub-lished or not. The documents may come from
teaching and research institutions in France or
abroad, or from public or private research centers.
L’archive ouverte pluridisciplinaire HAL, est
destinée au dépôt et à la diffusion de documents
scientifiques de niveau recherche, publiés ou non,
émanant des établissements d’enseignement et de
recherche français ou étrangers, des laboratoires
publics ou privés.
Metropolitan Area: a case study using a chemical
transport model
W. Lei, B. de Foy, M. Zavala, R. Volkamer, L. T. Molina
To cite this version:
W. Lei, B. de Foy, M. Zavala, R. Volkamer, L. T. Molina. Characterizing ozone production in the
Mex-ico City Metropolitan Area: a case study using a chemical transport model. Atmospheric Chemistry
and Physics, European Geosciences Union, 2007, 7 (5), pp.1347-1366. �hal-00296166�
© Author(s) 2007. This work is licensed under a Creative Commons License.
Chemistry
and Physics
Characterizing ozone production in the Mexico City Metropolitan
Area: a case study using a chemical transport model
W. Lei1,2, B. de Foy2,3, M. Zavala1,2, R. Volkamer1,4, and L. T. Molina1,2
1Department of Earth, Atmospheric and Planetary Sciences, Massachusetts Institute of Technology, MA, USA 2Molina Center for Energy and the Environment, CA, USA
3Saint Louis University, MO, USA
4Department of Chemistry and Biochemistry, University of California, San Diego, CA, USA
Received: 6 July 2006 – Published in Atmos. Chem. Phys. Discuss.: 17 August 2006 Revised: 17 January 2007 – Accepted: 20 February 2007 – Published: 27 February 2007
Abstract. An episodic simulation is conducted to
charac-terize midday (12:00–17:00 CDT) ozone (O3)
photochemi-cal production and to investigate its sensitivity to emission changes of ozone precursors in the Mexico City Metropoli-tan Area (MCMA) during an “O3-South” meteorological
episode using the Comprehensive Air Quality Model with extensions (CAMx). High Ox(O3+NO2) photochemical
pro-duction rates of 10–80 ppb/h are predicted due to the high reactivity of volatile organic compounds (VOCs) in which alkanes, alkenes, and aromatics exert comparable contri-butions. The predicted ozone production efficiency is be-tween 4–10 O3molecules per NOx molecule oxidized, and
increases with VOC-to-NO2 reactivity ratio. Process
ap-portionment analyses indicate significant outflow of pollu-tants such as O3 and peroxyacetyl nitrate (PAN) from the
urban area to the surrounding regional environment. PAN is not in chemical-thermal equilibrium during the photochem-ically active periods. Sensitivity studies of O3 production
suggest that O3formation in the MCMA urban region with
less chemical aging (NOz/NOy<0.3) is VOC-limited. Both
the simulated behavior of O3production and its sensitivities
to precursors suggest that midday O3formation during this
episode is VOC-sensitive in the urban region on the basis of the current emissions inventory estimates, and current NOx
levels depress the O3production.
1 Introduction
In recent decades, air pollution has become one of the most important and challenging problems for megacities in the world (Molina and Molina, 2004; Molina et al., 2004). Air pollution, such as high tropospheric ozone (O3) and
par-ticulate matter (PM), has detrimental impacts on human
Correspondence to: W. Lei (wflei@mit.edu)
health and ecosystems, and can contribute significantly to climate change. In the lower troposphere, ozone is pro-duced from photochemical reactions involving volatile or-ganic compounds (VOCs, broadly including CO) and nitro-gen oxides (NOx=NO+NO2) in the presence of sunlight. O3
concentrations can exceed health standards in polluted ur-ban environments under favorable meteorological conditions (such as stagnation) and high anthropogenic emissions of NOxand VOCs. In some urban settings biogenic
hydrocar-bons can also play an important role in O3production over
regions where they contribute significantly to the total bur-den of emitted VOCs (Chameides et al., 1988; Kleinman et al., 2005). Tropospheric O3is also affected by transport,
dis-persion, and deposition processes.
A prerequisite to an effective emission-based O3 control
strategy is to understand the temporal and spatial relation-ship between O3and its precursors, and the response of O3
concentrations to changes in emissions of NOx and VOCs.
Furthermore, an effective O3control strategy should include
efforts to reduce O3production rates in areas that affect peak
O3 concentrations in a receptor site (Tonnesen and Denis,
2000). The ozone-precursor relationship can be better un-derstood in terms of NOxor VOC-sensitive chemistry of O3
formation, which is usually defined based on the relative im-pact of a given percent reduction in NOxrelative to VOCs
in the context of urban chemistry (Sillman, 1999). Using this definition in this paper, the sensitive (or VOC-limited) regime refers to conditions where a percent reduc-tion in VOCs would lead to a significantly greater decrease in O3with respect to the same percent reduction in NOx, and
vice versa.
Mexico City Metropolitan Area (MCMA) has emerged as one of the most polluted areas in the world over the last two decades (Molina and Molina, 2002). A fleet of over 3.5 mil-lion vehicles in the area, together with industrial, commer-cial and service sources, as well as residential activities, in-ject high emissions of NOx, VOCs, and primary PM to the
atmosphere. In addition, the MCMA is located inside an elevated basin at an altitude of 2240 m a.s.l. surrounded by mountain ridges on the west, south and east, with a broad opening to the north and a narrow gap to the south-southwest. The high altitude makes combustion processes less efficient, leading to enhanced VOC emissions. In addition, sunlight is more intense at the high altitude and the tropical latitude (19◦25′N) compared to low elevation, higher latitude cities. Together, these effects are more conducive to high rates of photochemical smog formation. The meteorological condi-tions associated with the complex topography in the Mexico basin also contribute to the high levels of air pollution (Fast and Zhong, 1998; de Foy et al., 2005). Although the air qual-ity has improved significantly over the last decade, persistent high levels of surface O3and PM are observed in the MCMA,
and the national standards are often violated throughout the year (Molina and Molina, 2002; GDF, 2004).
Many modeling efforts on O3photochemistry have been
carried out in the MCMA in conjunction with previous field measurements conducted in the MCMA (LANL/IMP, 1994; IMP, 1998; Doran et al., 1998; Edgerton et al., 1999; Baum-gardner et al., 2000; Raga et al., 2001). Jazcilevich et al. (2002, 2003) simulated the effects of land-use change on the pollutant concentrations. 3-D photochemical airshed models have also been applied to reproduce O3
concentra-tions and evaluate the emission uncertainties (Streit and Guz-man, 1996; West et al., 2004). Box models have been em-ployed to investigate the effects of emission reduction op-tions (Streit and Guzman, 1996; Young et al., 1997). How-ever, due to the quality of emission estimates, lack of con-straints from comprehensive measurements, particularly spe-ciated VOC measurements, and lack of accounting for trans-port and/or usage of averaged meteorological fields, contra-dictory implications for O3control strategies were drawn. In
addition, to our knowledge, there are no peer-reviewed mod-eling studies focusing on O3production rates in the MCMA,
and few comprehensive model studies incorporating com-prehensive measurements have been conducted to investigate the combined roles of meteorology, chemistry, emissions and deposition in O3formation, spatial distribution, and temporal
evolution in the MCMA (Molina and Molina, 2002; Jazcile-vich et al., 2005).
The MCMA-2003 Campaign was an integrated field mea-surement campaign that generated by far the most compre-hensive suite of data sets for gaseous species, particles, and meteorological fields in the MCMA (Zavala et al., 2006; Volkamer et al., 2005; Shirley et al., 2006; Salcedo et al., 2006, 2007; de Foy et al., 2005; detailed information on the Campaign is also available at http://www.mce2.org). One of the goals of the Campaign was to improve the current un-derstanding of the chemistry and transport processes and the evolution of pollutants in the MCMA atmosphere, and to pro-vide insights for devising emission reduction strategies. The role of meteorology in air pollution in the MCMA has been relatively well characterized and analyzed through modeling
efforts (de Foy et al., 2005, 2006a, b). Oxidation character-istics of VOCs have also been investigated through measure-ments of secondary species and/or radical species (Marley et al., 2004; Volkamer et al., 2005; Shirley et al., 2006).
In this paper, we employ a 3-D chemical transport model (CTM), the Comprehensive Air Quality Model with exten-sions (CAMx), to investigate O3 photochemical production
in the MCMA and its response to O3precursors under the
“O3-South” meteorological conditions (de Foy et al., 2005),
with the emissions of precursors particularly speciated VOCs constrained by measurements. Characteristics of O3
produc-tion under other meteorological condiproduc-tions will be reported in a subsequent paper. The objectives are to characterize the O3production rate, partition the contributions to the O3
pro-duction of processes of chemistry, physical transformation and transport, and to evaluate the sensitivity of O3formation
to emission reduction of anthropogenic VOCs and NOx.
Sec-tion 2 gives a brief descripSec-tion of the modeling methodology. Section 3 presents and discusses the modeling performance, in situ O3photochemical production, contributions of
differ-ent processes to O3formation, and sensitivity analysis of the
O3response to emissions reduction. A summary of
conclu-sions is provided in Sect. 4.
2 Modeling methodology
2.1 Model and model inputs
A 3-D chemical transport model, CAMx (version 4.03), is employed for this study. CAMx is an Eulerian photochemical grid model designed to investigate air quality issues on urban and regional scales (ENVIRON, 2003). CAMx simulates the emission, transport, chemistry, and deposition processes of pollutants in the troposphere.
CAMx is driven by hourly meteorological output fields from the Penn State/National Center for Atmospheric Re-search (PSU/NCAR) Mesoscale Modeling System (MM5) (Grell et al., 1995), including wind, temperature, water va-por, cloud/rain and land use. The vertical diffusion coef-ficients were deduced from the MM5 output based on the O’Brien scheme (1970), and the minimum values were set to 2–4 m2/s (day-varying) in the MCMA. De Foy et al. (2007) concluded that this was a better scheme for representing the vertical dispersion in the MCMA. MM5 was configured to three one-way nestings with grid resolutions of 36, 12 and 3 km and 23 sigma levels in the vertical, and was run with the NOAH soil model, MRF boundary layer scheme, K-F con-vection scheme, simple ice microphysics, and cloud radiation scheme (de Foy et al., 2006a). The CAMx model domain is the same as the MM5 Domain 3 (D3), except that four grids were trimmed from each edge (resulting in 52×52 grid cells), with 15 vertical layers corresponding to the lowest 15 layers in the MM5, extending from the surface to 5 km a.g.l. with the bottom layer interface of about 64 m a.g.l. Figure 1
Fig. 1. (a) Model domain and (b) RAMA monitoring stations. The grey contour in (a) indicates the terrain topography. Also shown in (a)
is the “urban analysis area” (the inner bold square), the central urban area where most of the RAMA monitoring stations are located. The RAMA monitoring stations are indicated as filled circles and filled squares. The 8 stations marked as filled squares with the station codes along side are denoted in the text as REP-8 stations. The thin curves are the MCMA delegation political borderlines. The location of the MCMA-2003 Campaign supersite CENICA is also indicated in (a).
illustrates the CAMx domain; it also defines a region, desig-nated as “urban analysis area” herein, which is located in the central urban region and contains most of the monitoring sta-tions of the Ambient Air Monitoring Network of Mexico City (RAMA). Analyses and discussions in this study are mainly focused in this area.
The chemical initial and boundary conditions (BCs) were similar to those used in West et al. (2004), except that lower NOx, VOC and CO values were used for the boundary
con-ditions. The boundary conditions were carefully examined using measurements taken at the boundary sites during the MCMA-2003 Campaign. A sensitivity run with a 50% change of the chemical BCs (which basically covered the variations of the boundary measurements for most important species) did not show significant effects on O3and other
pho-tochemically active species.
The SAPRC99 gas phase chemical mechanism (Carter, 2000) was used in this study. Photolysis rate frequencies for clear sky were precomputed with the Tropospheric Ul-traviolet and Visible radiation model (TUV, Madronich and Flocke, 1998). In the computation, the aerosol loading was scaled to match those measured during the MCMA-2003. In the highly polluted area the aerosol optical depth at 340-nm wavelength was set to 0.8, comparable to the concurrent LIDAR aerosol extinction measurements (Frey et al., 2004; Simeonov et al., 2004). The effects of cloud presence on pho-tolysis rates were taken into account by using the approach of Chang et al. (1987).
2.2 Emission estimates
The emission input fields were constructed based on the 2002 official emissions inventory (EI) for MCMA (CAM, 2004). Total annually emitted masses of VOCs, CO and NOxwere
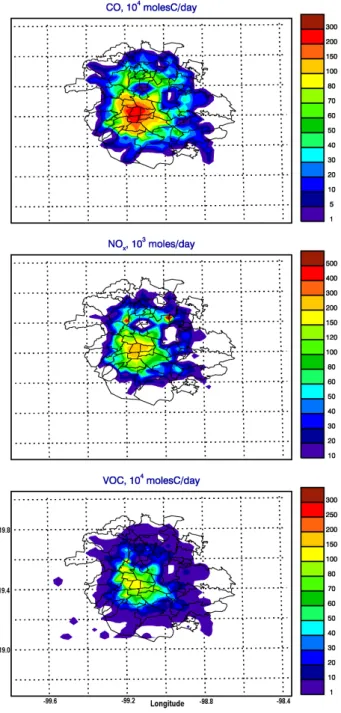
distributed across mobile, point and area source categories considered in the emission inventory and were transformed into spatially and temporally resolved and chemically speci-ated emission fields, following the procedures described in West et al. (2004). Updated industrial, road and area source-specific databases were used for the construction of emission fields using a bottom-up approach. When information from area source-specific emission categories was not available, updated population-based distributions were used as proxies for spatial distributions. In addition, the spatial resolution of the emissions has been increased by mapping the updated industrial, mobile and area emissions into grid cells at a reso-lution of 2.25 km. The emission input fields described above are referred to as the initial emission estimates henceforth. A summary of the total basin-wide emissions by source cat-egory and pollutant type is given in Table 1 and a map of MCMA CO, NOxand VOC emissions is shown in Fig. 2.
It has been suggested that the VOC emissions in the 1998 EI for the MCMA were underestimated by as much as a factor of 2–3 (Molina and Molina, 2002; Arriaga-Colina et al., 2004; West et al., 2004). Underestimates of VOC emissions by a factor of 2 or more were also found in some U.S. cities (Sillman, 1999; Russell and Den-nis, 2000). An extensive array of VOC measurements were obtained during the MCMA-2003 Campaign using a variety of techniques, including canister sampling ana-lyzed by Gas Chromatography/Flame Ionization Detection
Fig. 2. Spatial distribution of CO, NOxand VOC emissions for a
normal weekday in the initial estimates from the 2002 official emis-sion inventory.
(GC-FID), long-path Differential Optical Absorption spec-troscopy (DOAS), Fourier-transform Infrared Specspec-troscopy (FTIR) and Proton Transfer Reaction Mass Spectroscopy (PTR-MS) (Velasco et al., 2007; Volkamer et al., 2005; Rogers et al., 2006). In this study, on the basis of the initial emission estimates, model runs were carried out and modeled VOC (as well as NOy and CO) concentrations were
com-pared with the extensive suite of VOC measurements from GC-FID and DOAS. The PTR-MS data were not used due
Table 1. Total annual emissions (in ktons/year) by source category
in the MCMA from the 2002 official emission inventory. CO NOx VOCsa VOCsb
Mobile 1927.1 156.3 193.8 332.3
Area 4.4 6.5 258.9 439.7
Point 6.9 19.5 75.2 112.8 Vegetation and soil N/A 0.6 16.6 15.2 Total 1938.4 183.0 544.5 900.0
aInitial estimates from MCMA 2002 EI. bAdjusted estimates.
to the difficulty in species lumping. The initial emission es-timates were then adjusted until a satisfactory agreement in the comparisons was reached (see details in Sect. 3.1 for the comparisons). Mole-based scaling factors listed in Table 2 were applied to adjust the initial emission estimates. These adjustment factors were similar to those reported by Velasco et al. (2007), who used the distribution of measured ambient concentrations from canister samples to estimate adjustments in the distribution of emissions (1998 EI) by species classes. Some factors in Table 2 are different from those given by Ve-lasco et al., because different speciation methods were used and different base year inventories (1998 vs. 2002) were em-ployed.
Kolb et al. (2004) and Zavala et al. (2006) suggested that vehicle emissions of formaldehyde (HCHO), which may sig-nificantly influence radical budgets and photochemistry in the MCMA (Garcia et al., 2006), may be higher in the MCMA than in some U.S. urban cities. Based on the compar-ison of modeled concentrations and DOAS measurements at CENICA supersite (see Sect. 3.1), emissions of HCHO were scaled by a factor of 9, and a scaling factor of 4 was assumed for higher aldehydes. Both the emission rates (in the initial emission estimates) and photolysis rates of the higher alde-hydes are much lower than those of HCHO; hence their role in the photochemistry is not as significant as HCHO in the MCMA.
The adjusted VOC emissions are also summarized in Ta-ble 1. The total VOC emissions increase by about 65% (mass based) after the adjustment, which is lower than the previous estimates of a factor of 2 to 3. The adjustment also con-sidered weekend and day-to-day emission variations. It was assumed that, based on traffic count information and an anal-ysis of the variation of morning peak CO concentrations, ve-hicular emissions decreased by about 10% on Saturday and 30% on Sunday (Garcia et al., 2006; Salcedo et al., 2006). The modeling episode (see the section below) included part of the Easter week, in which schools were closed and resi-dents left the city for vacation. As reported in ambient con-centrations and measured fluxes (Velasco et al., 2005, 2007), emissions were reduced during the Easter week. Based on
Table 2. Adjustment factors for correction of the 2002 MCMA emissions inventory.
Model species Adjustment factor+(this work) Adjustment factor#from Velasco et al. (2007)
Ethane 2.3 (see note)
ALK1 2.0 3.1 (see note)
ALK2 3.0 0.3 (see note)
ALK3 4.0 ALK4 1.5 ALK5 0.4 ETHE 1.0 OLE1 1.0 0.4 OLE2 1.0 0.2 ARO1 1.5 0.6 ARO2 1.5 0.7 HCHO 9.0
CCHO and RCHO 4.0
Different speciations of alkanes in CAMx and the work of Velasco et al. were used. ALK1+contains ethane; ALK2+includes propane and acetylene; ALK3+includes n-butane, i-butane and 2,2-dimethyl butane; ALK4+includes i-pentane, n-pentane, cyclopentane, methyl-cyclopentane, 2-methyl pentane, 3-methyl pentane, 2,3-dimethyl butane and hexane; ALK5+includes cyclohexane, 2-methyl hexane, 3-methyl hexane, 2,3-di3-methyl pentane, 2-3-methyl heptane, 4-3-methyl heptane, i octane, n-heptane, 3-methylcyclohexane, 2,4-di3-methyl hexane, 2,3,4-trimethyl heptane, n-octane, nonane and 1,2,4 trimethylcyclohexane. ALK1#is the combination of ALK2+, ALK3+and ALK4+; ALK2#corresponds to ALK5+.
the RAMA CO measurements, emissions during these days were downscaled by 10% of regular days. This adjusted emission scenario is defined as the reference case in this pa-per.
2.3 Episode selection
A 4-day episode (13–16 April 2003) was chosen for this study. The simulation was started at 12 April 00Z allowing 24 h for spin-up to reduce the influence of initial conditions. We chose this period because it was an “O3–South” episode
in the MCMA (de Foy et al., 2005). During “O3-South” days,
meteorological conditions are characterized by weak synop-tic forcing, stagnant surface winds and clear skies, which are conductive to the occurrence of high O3 levels. The basin
flow is governed by a thermally-driven northerly flow from the Mexican plateau during the day and southerly gap flow from the southeast passage in the late afternoon and early evening, which leads to the highest O3levels in the
south-ern part of the city (de Foy et al., 2005). In addition, The “O3-South” episode is a typical meteorological phenomenon
in the MCMA, which has been extensively studied (Williams et al., 1995; Fast and Zhong, 1998; Whiteman et al., 2000; de Foy et al., 2005).
As noted above, during the early Easter Week that started on 14 April 2003, traffic counts and pollutant levels were about 10% lower than other non-holidays weeks (Garcia et al., 2006). Although the emissions during most of the time for this episode were slightly less than non-holiday period, we believe this episode can be used to represent the normal day scenario for MCMA, given the O3patterns that occurred.
3 Results and discussions
The CAMx performance during this episode studied is eval-uated by comparing near surface O3, NOy and CO with
RAMA data and by comparing VOC concentrations with measurements from canister samples (Velasco et al., 2007) and DOAS (Volkamer et al., 2005) at CENICA. The charac-teristics of O3photochemical formation are discussed next.
Finally, the O3response to precursor emission reductions is
presented.
3.1 Model performance
The MM5 performance for the selected period has been de-scribed by de Foy et al. (2006a, b). The main features of the Mexico basin flow are well represented by the model in-cluding the northerly flow from the Mexican plateau during the day, up-slope flows on the basin edges and the southerly gap flow from the southeast passage in the late afternoon and early evening. Weak synoptic forcing leads to surface winds that are weak and variable and particularly challenging to model. The main difference between the model and the ob-servations is the timing of the increase in surface wind speeds and the wind shift. This affects the location of the horizon-tal wind convergence zone, and can have a large impact on pollutant dispersion predictions.
The model performance of CAMx is evaluated by com-paring near-surface concentrations of O3, CO, NOy, and
VOCs with a comprehensive suite of measurements. First, the modeled hourly concentrations of O3in the bottom model
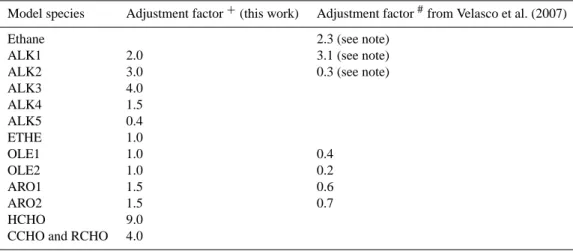
Fig. 3. Comparison of simulated (colored contour) versus observed
(colored dots and squares) near-surface peak O3concentration
dur-ing 13–16 April 2003. Dots and squares indicate the positions of RAMA monitoring stations which have O3measurements during
this episode, whose size is proportional to the O3 concentration. The REP-8 stations are marked as small squares. Also shown in the upper left panel is the “urban analysis area” (encompassed by a black rectangle) in which data are used for analyses.
shows the comparison of surface peak O3concentration and
its geographic distribution. A transition from “O3-North” to
“O3-South” occurred on 13 April, with the peak O3
concen-tration located in a narrow strip running SW-NE through the city center. Subsequently, peak O3concentrations occurred
in the south of the city. In general, the model reproduces the spatial distribution and magnitude of peak O3reasonably
well, even though in some stations the peak O3
concentra-tions are off by a factor of 2. The location of the modeled O3center is shifted far to the south of the city, particularly
on 16 April, and as a result the O3peak levels are
overesti-mated. On the other hand, predicted NOyconcentrations (not
shown) during morning rush hours are in excellent agreement with the RAMA measurements. The agreement between the predicted and observed distribution of NOy concentrations
suggests that the shift of high O3center is not due to the
spa-tial representation of pollutant emissions.
One probable cause of the shift in the modeled O3 high
concentration center (Fig. 3) is the simulated meteorologi-cal factors mentioned previously. Weak and variable surface winds can significantly influence O3 concentration and its
spatial distribution on the urban scale. In addition, the
dis-crepancy of simulated sharp wind shift from south-easterly to north-westerly in the morning vs. the observed gradual turning (see Fig. 15 in de Foy et al., 2006b) probably also contributes to the O3shift. Another factor may be associated
with the treatment of HONO chemistry and other missing radical sources in the SAPRC99 gas-phase chemical mecha-nism.
Recently both laboratory studies and field measurements have reported that the heterogeneous chemistry is a ma-jor source of nighttime HONO (Kleffmann et al., 1998; Finlayson-Pitts et al., 2003; Stutz et al., 2004), although the mechanisms at the molecular level still remain not well un-derstood. In the current SAPRC99 mechanism, the associa-tion reacassocia-tion of OH+NO+M→HONO+M is the sole source of HONO in the atmosphere; it cannot explain the night-time accumulation of HONO concentration up to a few ppb observed during the MCMA-2003 Campaign (Volkamer et al., 20071). Our simulation tests over several episodes using the reference case emissions indicated (not shown) that the model using the current SAPRC99 mechanism resulted in de-layed and underpredicted radical concentrations in the high NOxMCMA area, suggesting missing radical sources or/and
missing NOxsinks in the mechanism. The missing HONO
sources and possible missing and delayed sources of other radicals can lead to the delay of O3formation and the shift of
high O3center to the downwind regions; missing NOxsinks
can lead to overprediction of peak O3.
Two test runs with increased northerly wind flows and in-creasing radical concentrations (indirectly by reducing NOx
emissions in the urban area), respectively, confirmed that both factors would shift the O3high concentration center to
the north, with the shift being more sensitive to the wind field change. Therefore it is likely that the shift is primarily due to meteorology, and the interactions between meteorology and missing radical sources could magnify the shift.
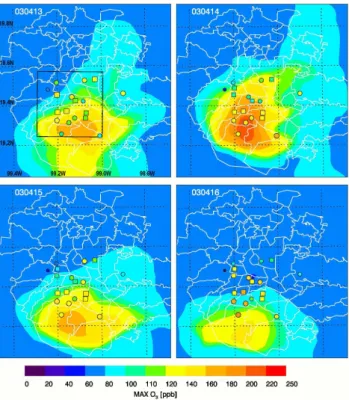
Figure 4 compares measured and simulated concentrations of O3, NOy, and CO averaged over 8 stations within the
urban area analyzed. These 8 stations (denoted as REP-8 stations) represent urban conditions with less influences from nearby local emission sources. Measurements of NOx
from RAMA using the chemiluminescence technique more accurately represent NOy. Accordingly, we compared the
RAMA NOx data with the sum of modeled species
corre-sponding to NOy. The model using the reference emissions
reproduces correctly the diurnal variation of O3 in the first
3 days, although the peak O3 on 14 April is overestimated
by about 30 ppb. On the other hand, the model using the initial emissions clearly underpredicts the O3level over the
whole episode, suggesting the necessity of increasing VOC emissions. On 16 April the O3high concentration center was 1Volkamer, R., Sheehy, P., Molina, L. T., and Molina, M. J.:
Oxidative capacity of the Mexico City atmosphere. Part 1: A radical source perspective, Atmos. Chem. Phys. Discuss., to be submitted, 2007.
Fig. 4. Comparison of measured (black) and simulated (red)
diur-nal variation of near surface hourly concentrations of (a) O3, (b)
CO, and (c) NOyaveraged over the REP-8 stations. Error bars and
shaded areas envelop the 25% and 75% percentiles of measurements and simulations, respectively. Also shown in panel (a) is the mod-eled O3time series using the initial emissions. Time in the x-axis is
the end hour in CDT (central daylight time) starting at 01:00 CDT 13 April 2003.
shifted too far to the south of the city, hence the 16 April data were not included in the analyses and discussions of photo-chemical characteristics of O3formation given below.
Comparison between observed and simulated species con-centrations can also provide information on the accuracy of emissions estimates. Figure 4 shows that simulated CO and NOyagree well with the measurements (within the modeled
and experimental uncertainties), and there are no systematic biases between modeled and observed daytime CO and NOy.
Nevertheless, there appear to be some hangovers of simu-lated CO and NOy during midnight and very early
morn-ing. Most of the hangover can be explained by the underpre-diction of nighttime vertical mixing and planetary boundary layer (PBL) height. The larger NOyhangover is due to the
relative higher nighttime NOxemission fractions (compared
to CO). This gives us confidence in model performance and in the accuracy of the emissions of CO and NOxused in the
model.
Fig. 5. Scatter plot of observed and simulated near surface O3
con-centrations over all RAMA stations during 13–15 April 2003 when observed O3values are above 40 ppb. Also shown are the linear fitting parameters and performance statistics.
Figure 5 shows the relationship between measured and predicted surface O3concentrations over all RAMA stations
during this episode, with the cutoff value set to 50 ppb of measured concentrations. As indicated in the figure, there is good agreement between the measured and the predicted O3
concentrations. Figure 5 also presents some ozone perfor-mance statistics, such as the normalized bias (the percentage difference between the predicted and observed O3
concen-trations paired in time and site with observed values above a 40 ppb threshold), the normalized gross bias (the percent-age of the absolute difference between the predicted and ob-served O3 concentrations paired in time and site with
ob-served values above the threshold), and the average accuracy of the peak (the percentage difference between the predicted and observed peak O3concentrations paired in site). These
statistical values also indicate a satisfactory performance in the O3simulation.
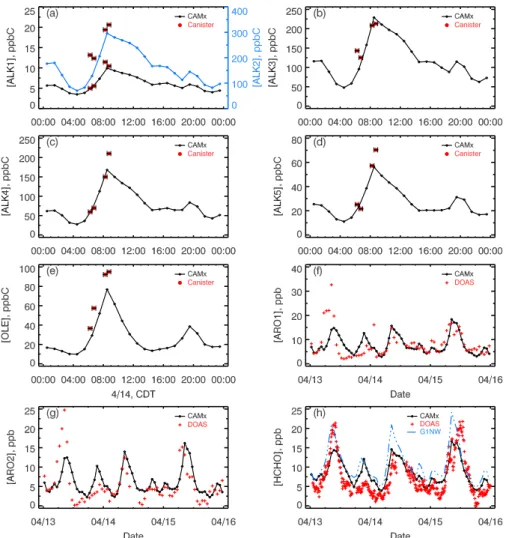
Finally we compare predicted VOC species with a com-prehensive array of available observations described in de-tail in Velasco et al. (2007) and Volkamer et al. (2005). As shown in Fig. 6 (panels a–e), the predicted concentrations of alkenes and speciated alkanes agree very well with mea-sured concentrations (30-min average) from canister samples (Velasco et al., 2007). Figure 6 also shows the comparison of predicted concentrations of aromatics and formaldehyde with those measured by DOAS. Observed ARO1 (Fig. 6f) was constructed from DOAS measurements of toluene and benzene, and observed ARO2 (Fig. 6g) was derived from DOAS measurements of xylenes using a scaling factor ob-tained from the canister data in which the contribution of xylenes to ARO2 can be estimated. There is good agreement between modeled and measured concentrations for aromatics on 14–15 April, and no systematic bias exists. The measured
Fig. 6. Comparisons of modeled VOC concentrations with canister and DOAS measurements at CENICA supersite. Canister data are 30-min
averages. The legend G1NW denotes one model grid northwest of CENICA (3 km north and west respectively).
aromatic concentrations on 13 April are much higher than the rest of the measurement period, which the model is unable to reproduce. However, the phenomenon of much higher predicted aromatic concentrations on 13 April com-pared to other days is not found in the case of CO, NOx
or HCHO. HCHO is somewhat underestimated during the morning hours at CENICA site even with an adjustment fac-tor of 9 to the HCHO emissions. Nevertheless, grid cells a few kilometers north and west of CENICA were predicted to have much higher HCHO concentrations. Figure 6h shows the simulated HCHO concentrations at the model grid 3 km northwest of CENICA (dashed line), which gives similar peak HCHO concentrations as the DOAS observations at CENICA. This may suggest an uncertainty in the spatial dis-tribution of HCHO in the EI: CENICA site is located at the edge of high vehicular emission area in the current emission estimates; the total emission estimates may need to be allo-cated over a broader area, considering the growth of the city. Based on these comparisons, it seems that emissions of some VOC species are underestimated by a factor of 2–3
in the EI, but not all VOCs are underestimated. Overall the emissions of VOCs are underestimated by about 65%. This result is consistent with the conclusions from Velasco et al. (2007), which are based on comparisons of 1998 EI with canister data of early morning VOC abundance over several sampling sites. It should be noted, however, that the adjust-ments of VOC emissions in this study were solely based on comparisons at only one station (CENICA), over a few days (one day for alkanes and alkenes), with limited dataset, and with assumptions that the spatial and temporal distribution of emissions in the EI were accurate. To thoroughly evaluate the uncertainty of EI, more measurement data and investigations with broader spatial and temporal coverage are needed.
Table 3. Notation.
Symbol Meaning
PG Gross chemical production rate
P Net chemical production rate L Chemical loss rate
Q Radical primary sources PFR Peroxide formation rate
LR Radical loss rate due to radical-radical reactions of OH+HO2and RO2+R′O2
LN Radical loss rate due to reactions between free radicals and NOx
LON Formation rate of PANs, other organic nitrates, and particulate nitrates. Difference between this term and LNis that the latter includes the HNO3formation rate from the OH+NO2reaction
kt Weighted average rate constant for reaction of HO2and RO2with NO
keff Effective rate constant for peroxide (H2O2+ROOH) formation
kOH−VOC Rate constant for reaction of VOC+OH
kOH−NO2 Rate constant for reaction of NO2+OH
KVOC VOC reactivity, defined as the product of the VOC concentration and the rate constant for the reaction
of VOC+OH
KNO2 NO2reactivity, defined as the product of the NO2concentration and the rate constant for the reaction of
NO2+OH
OPE Ozone production efficiency, defined as P(O3)/P(NOz)
Y Average yield of [HO2]+[RO2] for each OH+VOC reaction
3.2 Photochemical formation rate and production effi-ciency
3.2.1 Theoretical background
O3formation can be considered a radical competition
pro-cess in which VOCs and NOx compete for the OH
radi-cal (Seinfeld and Pandis, 1998). When NOx increases and
passes the turnaround level, defined as the NOx
concentra-tion at which O3production rate P(O3) reaches a maximum,
P(O3) is expected to decrease. Based on the concept of
rad-ical budget (OH+HO2+RO2), Sillman et al. (1990),
Klein-man et al. (1997), and Daum et al. (2000) derived analytical solutions for O3 photochemical production in terms of O3
precursors and other oxidation products that can be readily measured. These analytical equations have been widely used in box models to calculate O3production rates based on
ob-servations. PG(O3)= kt √ 2keff p Q−LN−LR [NO] (1) PG(O3)=Y kOH−VOC[VOC]
kOH−NO2[NO2](Q−2PFR−LR−LON
),
VOC-limited (2)
Notations used in these equations and the rest of this paper are listed in Table 3. Note that Q is the production rate of primary radicals (i.e., radicals generated from the radical ini-tiation, not those participating in the radical propagation. The primary radicals are not necessarily associated with direct
emissions), which is determined largely by the photolysis of O3, aldehydes and other intermediate VOCs including those
from VOC oxidations and direct emitters.
Equation (1) assumes that the O3production rate is the rate
of NO oxidation to NO2by peroxy radicals. Thus, Eq. (1) is
more suitable for examining the behavior of O3 production
at low NOxconcentrations (i.e., NOx-limited). Equation (2)
assumes that the O3production rate can be approximated by
the rate at which OH reacts with VOCs (i.e., VOC limited). Equation (2) is thus more appropriate for examining the be-havior of O3 production at NOx-abundant conditions. An
implicit assumption in deriving Eq. (2) is that no primary peroxy radicals contribute to the O3production (the Q term
is introduced into Eq. (2) because of the need to represent [OH] using other species on the basis of radical budget).
Subtracting the O3chemical loss term from PG(O3) gives
the net O3chemical formation rate P(O3). Under urban
con-ditions the O3 chemical loss term is usually much smaller
than the gross production term. For example, simulations of several different episodes in the MCMA indicated that near surface O3 chemical loss was constantly about 7–9%
of the gross chemical formation in the afternoon. Therefore, Eqs. (1–2) are also good approximations for P(O3). Under
low NOxconditions, LNand LRterms are negligible; while
under VOC-limited conditions, PFR and LRterms are very
small compared to other radical loss pathways such as forma-tions of HNO3, PANs and other organic nitrates (c.f. Fig. 8f
below). Thus, Eqs. (1) and (2) can be further simplified as
PG(O3)= kt √ 2keff p Q [NO], NOx−limited (3)
Fig. 7. Simulated dependence of photochemical production rates of
Ox(P(Ox)) on NOxin the model bottom layer over the urban region
during 12:00–17:00 CDT, 13–15 April 2003.
PG(O3)=Y
kOH−VOC[VOC]
kOH−NO2[NO2](Q−LON
), VOC-limited (4) The rather simple forms of Eqs. (3) and (4) are a practical reason for using Eq. (1) under NOx-limted conditions and
Eq. (2) under VOC-limited conditions. These equations will be employed to discuss the P(O3) in the MCMA in the
fol-lowing section.
3.2.2 Characteristics of ozone production rate
We examined the net photochemical formation rates of Ox
(Ox=O3+NO2in this paper), P(Ox), as a function of NOx;
the results are presented in Fig. 7. Oxis used here instead of
O3because Oxis a more conservative quantity than O3in that
it is not influenced by the titration process of NO+O3→NO2.
In Fig. 7, hourly-cumulative modeled data of P(Ox) sampled
within the “urban analysis area” (c.f. Fig. 1) between 12:00– 17:00 CDT during 13–15 April are used. The time window of 12:00–17:00 CDT is when the most active O3production
and the O3 peak occur; thus we are in a better position to
evaluate the sensitivity of O3 formation to VOC and NOx
during the afternoon hours. In the calculation P(Ox) includes
chemical losses of NOxto gaseous HNO3, PANs and other
organic nitrates. P(Ox) is a good approximation for P(O3)
because P(NO2) is expected to be small compared to P(O3)
due to the rapid inter-conversion between NO and NO2 in
this time window. A distinct feature in Fig. 7 is the large scat-tered relationship between P(Ox) and NOx. As near-surface
NOxconcentrations vary between 10 and 80 ppb, P(Ox)
val-ues vary between 10 and 80 ppb/h. The modeled valval-ues and the scatter in the dependence of P(Ox) on NOx is
consis-tent with observation-based estimates of P(O3) (Shirley et
al., 2006). Despite the scattered relationship, P(Ox)
gen-erally increases with NOx in the MCMA urban area, and
no obvious turnaround behavior of P(Ox) can be deduced
from Fig. 7, even when NOxconcentration reaches as high
as 100 ppb. The mean values of P(Ox) at each NOx level
are much higher than in most U.S. urban regions (Kleinman et al., 2005), even at very high NOxlevels, and are close to
or higher than those found in the Houston metropolitan area (Kleinman et al., 2002; Lei et al., 2004).
Figure 8 shows the simulated relationship among P(Ox),
primary radical source (Q, in units of ppb/h), and VOC-to-NO2 reactivity in the urban area analyzed. P(Ox) is
nearly a linear function of the primary radical production rate (Fig. 8c), indicating that P(Ox) is predominantly determined
by the availability of primary radicals. Therefore the scatter in the relationship shown in Fig. 7 reflects the dependence of the radical source on NOx. P(Ox) is weakly dependent
on√Q−LN [NO] (Fig. 8a), suggesting that Eq. (1) can not
explain the P(Ox) behavior in the MCMA, i.e., Ox
produc-tion is not NOx-limited in the urban area. Instead, Eq. (4)
explains the P(Ox) behavior well (Fig. 8d) suggesting that
P(Ox) is largely determined by the radical source and the
VOC-NO2reactivity ratio. This implies that Oxformation is
VOC-limited. About 18% of the sampled data points deviate from the linear cluster, probably due to the exclusion of the contribution of primary peroxy radical sources to the O3
pro-duction in Eq. (4). HCHO has been quantified as an impor-tant radical source in the MCMA (Volkamer et al., 20071).
The primary peroxy radicals may have significantly influ-enced a small portion of the data in Fig. 8. Including the con-tribution of primary peroxy radicals to O3production would
increase P(Ox), and thus improve the “clustering” in Fig. 8d.
The slope in Fig. 8d shows that on average two peroxy rad-icals are yielded for each OH+VOC reaction. We also note that P(Ox) is affected significantly by the LON term,
sug-gesting the importance of the formation of PANs and other organic nitrates in the ozone photochemical production. The VOC-to-NOxreactivity ratio contributes to the magnitude of
P(Ox), but there is no apparent dependency between the
re-activity ratio and P(Ox) (Fig. 8b). The relative constant ratio
of VOC-to-NOxreactivity (∼3–7) suggests the co-emissions
of NOx and VOCs in the MCMA urban area. In addition,
the radical source increases with VOC reactivity (Fig. 8e). Based on Eq. (4), the relationship revealed in Figs. 8b and e explains the observation that P(Ox) does not decrease at high
NOx(Fig. 7). Figures 8c, d and e indicate that VOC reactivity
plays an essential role in the Oxphotochemical production.
During this period, over 90% of the radicals are lost to the NOx oxidation while less than 10% are lost to the
radical-radical reactions (Fig. 8f), implying again that the Ox
forma-tion is VOC-limited (Sillman et al., 1995; Kleinman et al., 1997).
In summary, during the photochemical active period of 12:00–17:00 CDT, P(Ox) depends not only on NOx, but also
on VOC reactivity and primary radical sources; NOxlosses
to PANs and other organic nitrates also affect P(Ox). There
exists a scattered yet positive relationship between P(Ox) and
NOx. The dependence of P(Ox) on precursors is controlled
Fig. 8. Simulated relationships among Ox formation rate (P(Ox)), primary radical source (Q), and ratio of VOC-to-NO2 reactivity
(kVOC/kNO2), and relationship between radical source as a function and VOC reactivity. Data in the “urban analysis area” between 12:00–
17:00 CDT 13–15 April 2003 are used.
on the VOC reactivity. The relationship between P(Ox) and
precursors and the primary radical source suggests that O3
formation in the urban region is VOC-limited during this pe-riod.
3.2.3 VOC reactivity partitioning
As demonstrated above, VOC reactivity plays an essential role in determining the Oxphotochemical formation. Many
concepts have been developed to quantify the impact of VOC reactivity (Chameides et al., 1992; Carter, 1994; Seinfeld and Pandis, 1998). In this paper we use the summation of the product of speciated VOCs and their reaction rates with OH because it is closely related to the discussions above and we focus on the near-field photochemistry. An effort is made to examine the apportionment of VOC reactivity. Figure 9 illustrates the contributions of various VOCs to the VOC re-activity in the afternoon. The calculated total VOC rere-activity is very high with mean value >20 s−1, which is close to the
values observed in industrial plumes over the Houston Ship Channel area (Kleinman et al., 2002; Daum et al., 2003), and much higher than other U.S. urban environments (Kleinman et al., 2002, 2005; Lei et al., 2004). Including the contribu-tion from CO, the total reactivity (about 25 s−1) is in very
good agreement with the OH reactivity observed by Shirley et al. (2006), which also includes OH loss to other chem-ical processes, e.g., OH+NO2, for the same time window.
0 5 10 15 20 25 AVOC HCHO CO V O C R e a c ti v it y ( s -1) Aldehydes Aromatics Alkenes Alkanes
Fig. 9. Simulated VOC reactivity averaged over the “urban analysis
area” during 12:00–17:00 CDT 13–15 April 2003 at model bottom layer. AVOC = anthropogenic VOCs. Aldehydes include HCHO.
Alkanes, alkenes and aromatics contribute comparably to the VOC reactivity, with alkanes slightly dominating. Velasco et al. (2007) reported that during the early morning rush hour, alkenes dominate the total VOC reactivity in the MCMA. As time evolves, relatively less contribution to the VOC reactiv-ity would be expected from the more reactive alkenes in the afternoon due to their shorter lifetimes.
An important feature shown in Fig. 9 is the significant con-tribution from aromatics to the VOC reactivity. Aromatic
Fig. 10. Simulated relationship between ozone production
effi-ciency (P(Ox))/P((NOz)) and NOxat 12:00–17:00 CDT during 13–
15 April 2003 in the model bottom layer over the “urban analysis area”.
compounds with high reactivity, such as xylenes, account for about 75% of the aromatic activity (not shown). This is unique compared to most of the urban cities in the U.S., where either alkanes or alkenes contribute the majority of VOC reactivity. Aromatics are important precursors for sec-ondary organic aerosols (Odum et al., 1996; Seinfeld and Pandis, 1998). The importance of aromatics to the VOC re-activity may have important implications in formulating ef-fective control strategies for the VOC-limited area, because reduction in aromatic emissions may lead to significant de-crease in both O3and organic aerosols, and hence reducing
the emissions of aromatics may help to bring non-attainment areas into compliance with the national standards for O3and
PM. Aldehydes, mainly the intermediate oxidation products of primary VOCs during the sampling time window, also contribute significantly to the VOC reactivity, furthering the O3production potentials of primary VOCs. Another
notice-able feature is the role of CO in the OH reactivity due to the very high CO concentrations observed in MCMA.
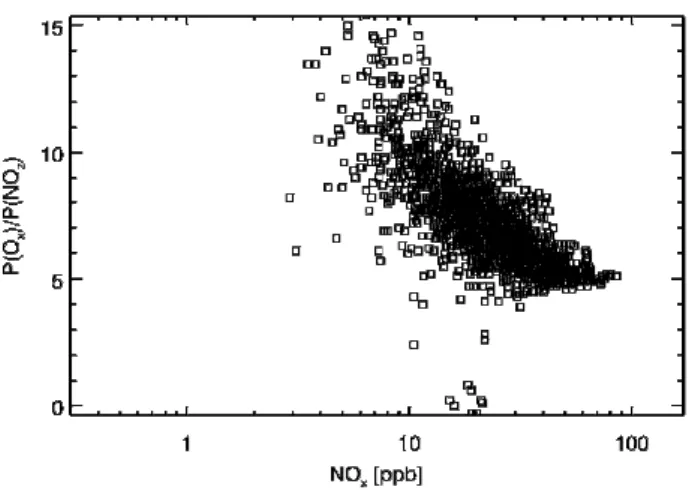
3.2.4 Characteristics of ozone production efficiency
Ozone production efficiency (OPE) is defined here as the number of O3molecules generated photochemically per NOx
molecule oxidized (i.e., P(O3)/P(NOz). NOz is the
oxida-tion products of NOx (NOz=NOy-NOx)). OPE is an
im-portant metric for understanding O3formation and response
to precursor emissions control because it contains informa-tion about the condiinforma-tions under which O3 is produced and
it is important in evaluating impacts from NOx emission
sources. OPE determines the efficiency of the catalyst NOx
in the O3formation. In this study, OPE is approximated as
P(Ox)/P(NOz). Under conditions where the O3titration does
not significantly affect the O3production, such an
approxi-mation is valid. Figure 10 presents the predicted afternoon
hourly near surface OPE as a function of NOxin the MCMA
urban area. In the calculation of NOxoxidation rate, P(NOz),
HNO3formation from the reaction of OH+NO2and net
for-mation of organic nitrates (including PANs), the predominant terms, are included; no other minor terms such as deposition and particulate NO−3 heterogeneous removal are considered. The calculated values of OPE frequently concentrate on 4–12 molecules of O3 per NOxoxidized at NOx>10 ppb, which
are higher than those observed or modeled in urban plumes of most U.S. urban cities in the same NOx range, such as
New York City (3–4) (Kleinman et al., 2000); Nashville (3– 6) (St. John et al., 1998; Nunnermacker et al., 1998), Phoenix (3–5) (Kleinman et al., 2002), and Houston (3–8) (Klein-man et al, 2003; Lei et al., 2004), particularly at higher NOx levels. As shown in Eq. (2) (divided by Q, note that
Q≈P (NOz), see Fig. 8f), the OPE values are closely related
to the VOC-to-NO2reactivity ratio, and OPE increases with
increasing ratio. A nonlinear dependence of OPE on NOxis
also exhibited, as found by Liu et al. (1987).
3.3 Process apportioning of ozone production in the bound-ary layer
O3production is the result of the interaction of the emission,
chemistry, transport and deposition processes. 3-D CTMs are probably the most powerful tool to gain an integrated under-standing of these interacting processes. The Process Analysis (PA) tool in CAMx is employed to apportion the O3
produc-tion from these processes. Figure 11a presents the time series of contributions of these processes to O3production in the
MCMA urban region in the boundary layer. The nighttime mixing layer height was assumed to be 500 m deep, close to the upper limit of observations (Frey at al., 2004). In gen-eral, positive P(O3) (net O3photochemical production)starts
at 09:00–10:00 CDT, rises significantly after 11 CDT and rapidly reaches maximum during 11:00–14:00 CDT. As the ozone production reaches a maximum, O3is transported to
the free troposphere via vertical advection; on 15 April it is also transported to the surrounding environment through the bilateral advection. The outflow of ozone to the free tropo-sphere is accompanied by inflow through the horizontal ad-vection to preserve the mass conservation of the air mass. The outflow of urban pollution suggests a regional-scale air quality impact. Another interesting phenomenon is that dur-ing morndur-ing hours there are little entrainments of O3from
the top of PBL.
Both the booming time (at which P(O3) rises significantly)
and peak time of P(O3) are about 1 h earlier than that for
O3 concentration itself, but are about 1–2 h later than the
observation-based model results from Shirley et al. (2006). Although there are many factors contributing to this dis-crepancy, such as the difference in height (PBL vs. sur-face) and geographical coverage (urban area average vs. one site), the determining factor is probably due to the miss-ing radical sources at high NOxconditions in the chemical
(a)
(b)
Fig. 11. Stacked time series of contribution of various processes to (a) O3production, and (b) PAN production in the simulated boundary
layer. The analysis region is confined to the “urban analysis area”, and bars are the hourly-integrated production rate change due to different processes within the PBL (each bar represents one-hour data).
mechanism employed in the model as discussed previously. Carter (2005) suggests that the current oxidation mechanism for aromatics (an important VOC species in the MCMA, see Fig. 9) in SAPRC99 underpredicts radical inputs, which leads to the underprediction of O3 formation in the
VOC-limited environments.
Dry deposition can be important for O3 removal in the
near-surface area (reaching ∼7 ppb/h on the diurnal average basis), but its effect is negligible for the entire PBL.
We also conduct a similar analysis for PAN, which can be an important reservoir species for NOxand radicals in
less-polluted tropospheric regions. The partitioning results are presented in Fig. 11b, which reveals two important features. First, PAN is not in chemical-thermal equilibrium during the photochemically active period. This is demonstrated by the positive net chemical/thermal production of PAN throughout the daytime period, with a production rate as high as 2 ppb/hr occurring in the mixing layer. This is contrary to the results
from many urban environments. Gaffney et al. (1999) re-ported very high PAN concentrations in MCMA during the 1997 IMADA Campaign, which they attributed to the high levels of PAN precursors. The non-equilibrium state of PAN may also contribute to the high PAN levels. Second, signifi-cant amounts of PAN are transported to regional ambient air. This again suggests that outflows of pollutants in the MCMA may affect the ambient air quality and photochemistry on a regional scale. We expect that significant amounts of pollu-tants and primary pollutant precursors will be transported out of the city to the regional environments.
3.4 Sensitivity of O3formation to precursors
High levels of ozone are produced in the urban areas due to anthropogenic emissions of NOxand anthropogenic and
biogenic emissions of VOCs. A key issue in developing an effective O3 control strategy is to understand the nonlinear
Fig. 12. Time series of O3concentrations for different emission
control scenarios. Data are averaged over the REP-8 stations in the bottom model layer. Time starts at 00:00 CDT 13 April 2003. In the legend Base denotes the reference case, 0.5NO denotes a 50% reduction in NOxemissions, 0.5VOC denotes a 50% reduction in
VOC emissions, and ALL denotes a 50% reduction in emissions of both NOxand VOCs.
section we evaluate the response of O3levels to the O3
pre-cursors by perturbing the emission rates and examining the resulting changes in O3concentrations and O3
photochemi-cal production rates. The perturbations of emissions include a 50% reduction in NOxemissions, a 50% reduction in VOC
emissions, and a 50% reduction in both NOxand VOCs
emis-sions.
Figure 12 illustrates the effects of emissions reductions on near-surface O3averaged over the REP-8 stations. It clearly
shows that a 50% reduction in NOxemissions leads to little
decrease in O3(on 13 April), or even increases in O3(on 14–
15 April), while a 50% reduction in VOC emissions results in decrease of O3by nearly a factor of two. 50% reductions
in both NOxand VOCs emissions also lead to a decrease in
O3, but less than the VOC-only scenario. Emission
reduc-tions also affect the timing of O3formation: the reduction in
NOxemissions causes the peak O3to form one hour earlier
and the morning-hour O3to rise more rapidly and efficiently;
the reduction in VOC emissions leads to a one-hour delay in the timing of peak O3 and delays the rise in the
morning-hour O3. The accelerated and enhanced O3formation in the
NOx-reduction case (with respect to the reference case) on
14–15 April is indicative of the O3VOC-sensitive chemistry
in the midday during this period and the depression of O3
formation under current NOxlevel. The NOx-reduction case
also indicates that O3sensitivity evolves during the day. For
example, on 14 April, with the reduction of NOxemissions,
O3 increases in the morning while it decreases in the late
afternoon and increases again in the evening. This concurs with the findings of Molina et al. (2002), in which detailed
Fig. 13. Geographic distribution of changes in Oxphotochemical
production rate in the model bottom layer on 15 April 2003 due to a 50% reduction in NOxemissions. Data are averaged over 12:00–
17:00 CDT. The change is calculated as P(Ox) (emission control
run) – P(Ox) (reference run).
analyses of the evolution of O3sensitivity to precursors were
presented.
The geographic distributions of the changes of P(Ox),
av-eraged over 12:00–17:00 p.m., due to a 50% reduction in NOx emissions on 15 April 2003 are shown in Fig. 13.
P(Ox) is used over O3 because P(Ox) represents
instanta-neous ozone chemistry that would apply to a broad range of atmospheric conditions and is less dependent on assump-tions on individual calculaassump-tions (Sillman, 1999). The reduc-tion of NOxemissions leads to increases of P(Ox) in most of
the urban area, particularly in the southern urban area, where peak O3increases more than 20 ppb (not shown). This
sug-gests that O3formation is VOC-limited during this episode
in most of the MCMA urban area, which is consistent with the conclusion from the P(Ox) analyses in Sect. 3.2.2.
As shown in Fig. 13, the area where the ozone formation enhances most due to the 50% reduction in NOxemission is
not located in the high O3center (c.f. Fig. 3 lower left panel),
but is shifted to the north of the O3center (i.e., closer to the
source region than O3 does). This suggests that the ozone
formation has been depressed by the high NOx
concentra-tion in the reference case on 15 April (also on 14 April, see Fig. 12) in this area, which is consistent with the acceler-ated and enhanced O3formation shown in Fig. 12. Figure 14
shows the predicted distribution of NOz/NOyratio in the
ref-erence case averaged from 12:00 to 17:00 CDT on 15 April for the modeled bottom layer. The ratio of NOz/NOy
Fig. 14. Simulated geographic distribution of NOz/NOyratio in the
reference run averaged over 12:00–17:00 CDT on 15 April 2003 in the model bottom layer.
plume possesses higher NOz/NOyratios and vice-versa.
Val-ues of NOz/NOyare also affected by advection and
disper-sion, deposition, and the reactive inhomogeneity of different VOCs. Figures 13 and 14 indicate that the VOC-sensitive area in the city generally coincides with the area of lower NOz/NOyratios; the VOC-sensitive area matches well with
areas having NOz/NOyratios less than 0.3. This
characteris-tic also holds for areas of increasing P(Ox) with decreasing
NOx emissions on 13–14 April . The area where O3poses
the largest increase due to the NOx-only emissions
reduc-tion (not shown, but similar to Fig. 14 with a larger positive area) is also shifted to the north. This phenomenon may also suggest that photochemical aging plays an important role in affecting the NOx-VOC sensitivity of ozone formation. In a
NOx-rich environment, ozone formation is depressed in the
immediate pollution source area (due to the NO titration and the “poisonous” OH+NO2reaction) until the plume travels
a substantial distance to the downwind area. A reduction in NOxemissions alleviates or even eases the depression in
the immediate downwind area in the NOx-saturated
environ-ment. These suggest that plume evolution history plays an important role in affecting the NOx-VOC sensitivity of O3
formation. The stagnant conditions during this period con-tribute to the VOC-sensitive chemistry.
Figure 15 shows the peak O3change for a 50% reduction
in emissions of VOCs and of both NOxand VOCs,
respec-tively. In both scenarios, peak O3 concentrations decrease
throughout the MCMA, with the former resulting in a larger degree of decrease in peak O3. This result also suggests that
Fig. 15. Change in peak O3in the model bottom layer on 15 April
2003 due to a 50% reduction in the emissions of (a) VOCs only and
(b) both NOxand VOCs.
O3formation is VOC-sensitive in the MCMA urban region
during this episode. The largest decrease in O3induced by
the VOC emission reduction (see Fig. 15a) corresponds to the high O3area of the reference case. This should be contrasted
with the NOx-only reduction case.
Figure 16 summarizes the responses of near-surface P(Ox)
to emissions reductions in NOx and VOC emissions as
a function of reference NOx; modeled data from 12:00–
Fig. 16. The Percentage change in P(Ox) as a function of reference
NOxfrom 13:00–17:00 CDT during 13–15 April 2003 in the
bot-tom model layer over the “urban analysis area” when emissions of NOxand VOC are reduced by 50% each and when both are reduced.
We present here the response of P(Ox), instead of O3itself,
because the former provides more insights on the chemistry of O3formation and its relationship with O3 precursors. It
shows that under “all” NOxconditions sampled (all points
with NOxconcentrations fall in the range shown in the
fig-ure), with few exceptions, a reduction in VOC emissions al-ways leads to a decrease in P(Ox), which also changes with
NOx. 50% reductions in emissions of both NOxand VOC
lead to mostly unanimous and constant decreases in P(Ox)
over a wide range of NOx levels, with the decrease
magni-tude less than the NOx-only reduction scenario. Considering
the co-emissions of NOx and VOCs, it appears that
reduc-tions in both VOCs and NOxare practical to reduce O3
con-centrations in MCMA.
The dependence of the P(Ox) change on NOxdue to the
re-duction of NOxemissions is more complicated. At low NOx
(less than ∼10 ppb), P(Ox) decreases when NOxemissions
are reduced; at NOx levels of 15–30 ppb, the reduction of
NOxemissions can lead to either a decrease or an increase in
P(Ox), due to the scattered P(Ox)-NOxrelationship discussed
previously; but at higher levels of NOx(>30 ppb), the
reduc-tion of NOxemissions results in an increase of P(Ox).
De-spite the scatter of the P(Ox) responses to reductions in NOx
and VOCs, it appears that VOC emission control is more ef-fective than NOxemission control for most NOxlevels. This
conclusion is drawn from Fig. 16, i.e., from the simulated results in the urban area studied and in terms of the Ox
pro-duction rate. The conclusion may be different when different regions are targeted. Replacing P(Ox) with O3, a graph
sim-ilar to Fig. 16, with a different variability, is obtained. The difference is that P(Ox) may be considered a present state
quantity, while O3not only explicitly includes the influences
of physical processes (e.g., transport and deposition), but also carries the history of the air mass (Kleinman, 2000).
These sensitivity calculations are necessarily based on the reference emissions. O3 response to emissions reductions
may vary with different base emissions because the O3
sen-sitivity chemistry can shift from one regime to another. Cer-tainly an accurate EI is a prerequisite to develop an O3
con-trol strategy based on sensitivity studies. In addition, the O3
sensitivity chemistry may vary if the magnitude of emissions reduction changes (e.g., 30% or 70% reduction instead of 50% reduction). Finally, the O3 sensitivity chemistry can
behave differently under different meteorological situations, and thus in different regions. Future work will extend the sensitivity analyses to other two meteorological categories that also occur frequently in MCMA, “O3-North” and “Cold
Surge”, and to improved emission estimates with different perturbations.
4 Conclusions
A 3-D chemical transport model (CAMx 4.03) was used to characterize the midday (12:00–17:00 CDT) ozone forma-tion and its response to precursor changes in the MCMA during a 3-day episode of 13–15 April 2003. Model per-formance was assessed by comparing simulated near-surface O3, NOx, CO, and speciated VOC concentrations with a
comprehensive array of measurements at the RAMA mon-itoring stations and at the CENICA supersite during the MCMA-2003 Campaign. The model successfully repro-duces the concentrations of CO, NOx, O3and VOCs in the
MCMA during this episode.
The simulated relationship between O3 production and
ambient NOx and VOC concentrations is complex and is
mainly attributed to the non-homogeneous primary radical sources under different NOxlevels. The behavior of P(Ox)
suggests that O3 formation is VOC-limited during 12:00–
17:00 CDT in the urban region. The model predicts O3
pho-tochemical formation rates of 10–80 ppb/h at the most fre-quently measured NOxconcentrations. These NOx
concen-trations are much higher than in most U.S. urban regions. The high O3 production is due to the high VOC reactivity
in which alkanes, alkenes, and aromatics make comparable contributions. The predicted ozone production efficiency is between 4–10 O3molecules per NOxmolecule oxidized, and
increases with increasing VOC-to-NO2reactivity ratio.
Contributions of chemistry, transport, and deposition to O3production in the boundary layer are apportioned in this
study. O3is produced photochemically during the day, and is
transported to the free troposphere via vertical advection in the later afternoon and evening. No significant entrainments from above the PBL occur during morning hours. Deposition has negligible effects on the column ozone within the bound-ary layer. Significant outflows of pollutants such as O3and
PAN from the urban areas to the surrounding environment are predicted, which can have important influences on the air
quality on the regional scale. PAN is not in equilibrium dur-ing the photochemically active periods.
The response of O3 production to reductions in
precur-sor emissions was investigated using three emissions control scenarios: a 50% reduction in NOx only, a 50% reduction
in VOCs only, and 50% reductions in both NOxand VOCs.
50% reductions in emissions of VOC-only and in both NOx
and VOCs lead to decreases in peak O3, with the former
re-ducing O3 most; the latter leads to a constant decrease of
O3production over a wide range of NOxlevels. A 50%
re-duction in NOxemissions leads to small decreases, or even
increases in peak O3 for less aged (NOz/NOy<0.3) urban
plumes. These results suggest that O3formation in the
mid-day during this episode is VOC-sensitive in the urban region, and current NOxlevels depress the O3production.
Consid-ering the co-emissions of VOCs and NOx, reductions in both
VOCs and NOxappear to be practical to lower the O3levels
in MCMA. The sensitivity also evolves with time of the day. The results obtained from model simulations in this study are based on one meteorological event and one adjusted emission scenario. Because of uncertainties in the emis-sions inventory and the diverse response of O3 to ambient
precursor levels, and the sensitivity of the concentration spa-tial distribution to meteorology, one episodic simulation may not be sufficient to capture the general features of O3-NOx
-VOC chemistry under a specific meteorological condition. More episodic studies are needed to construct a comprehen-sive and representative picture of the O3production
charac-teristics in the MCMA and its response to emission controls. Future studies, which are underway, will be performed using upgraded initial emission estimates and more sophisticated emission controls under different meteorological conditions, such as those identified during the MCMA-2003 campaign – the “O3-North”and “Cold Surge”. In addition, it should
be noted that the conclusions of this study are applied to the MCMA urban region and may not be applicable to the whole metropolitan area.
Acknowledgements. This research was supported by the Mexican
Metropolitan Environmental Commission, the U.S. National Sci-ence Foundation (ATM-308748 and 0528227), and the Department of Energy (Award DE-FG02-05ER3980). The authors thank the Secretary of Environment of the Government of the Federal District in Mexico for their contribution in gathering the data used in this manuscript. The authors are grateful to B. Lamb and E. Velasco for providing VOC canister sampling data and P. Sheehy for assistance in DOAS data processing, and to F. San Martini, E. Velasco, B. Lamb, G. Sosa and A. Garcia for their valuable discussions and comments. The authors also acknowledge the constructive comments from the anonymous reviewers, which helped to improve the presentation of this article. CAMx is made publicly available by ENVIRON, and the authors would like to thank G. Yarwood for his support.
Edited by: C. E. Kolb
References
Arriaga-Colina, J. L., West, J. J., Sosa, G., Escalona, S. S., Ord´u˜nez, R. M., and Cervantes, A. D. M.: Measurements of VOCs in Mex-ico City (1992–2001) and evaluation of VOCs and CO in the emissions inventory, Atmos. Environ., 38, 2523–2533, 2004. Baumgardner, D., Raga, G. B., Kok, G., Ogren, J., Rosas, I., B´aez,
A., and Novakov, T.: On the evolution of aerosol properties at a mountain site above Mexico City, J. Geophys. Res., 105, 22 243– 22 254, 2000.
CAM (Comisi´on Ambiental Metropolitana): Inventario de Emi-siones 2002 de la Zona Metropolitana del Valle de M´exico, M´exico, 2004.
Carter, W. P. L.: Development of ozone reactivity scales for volatile organic compounds, J. Air Waste Manage. Assoc., 44, 881–899, 1994.
Carter, W. P. L.: Documentation of the SAPRC-99 chemical mech-anism for VOC reactivity, final report to California Air Re-sources Board, Contract 92-329 and 95-308, Calif. Air Res. Board, Sacramento, Calif., 2000.
Carter, W. P. L.: Environmental chamber studies of ozone forma-tion potentials of volatile organic compounds, Proceedings of the NATO Advanced Research Workshop “Environmental Sim-ulation Chambers: Application to Atmospheric Chemical Pro-cesses”, edited by: Rudzinski, K. and Barnes, I., NATO Sciences Series, IV. Earth and Environmental Sciences, Zakopane, Poland, Kluwer Academic Publishers, 1–4 October 2004.
Castro, T., Madronich, S., Rivale, S., Muhlia, A., and Mar, B.: The influence of aerosols on photochemical smog in Mexico City, At-mos. Environ., 35, 1765–1772, 2001.
Chameides, W. L., Lindsay, R.W., Richardson, J., and Kiang, C. S.: The role of biogenic hydrocarbons in urban photochemical smog – Atlanta as a case-study, Science, 241, 1473–1475, 1988. Chameides, W. L., Fehsenfeld, F., Rodgers, M. O., et al.: Ozone
precursor relationships in the ambient atmosphere, J. Geophys. Res., 97, 6037–6056, 1992.
Chang, J. S., Brost, R. A., Isaksen, I. S. A., Madronich, S., Middle-ton, P., Stockwell, W. R., and Walcek, C. J.: A three-dimensional Eulerian acid deposition model: Physical concepts and formula-tion, J. Geophys. Res., 81, 421–423, 1987.
Daum, P. H., Kleinman, L. I., Imre, D. G., Nunnermacker, L. J., Lee, Y.-N., Springston, S. R., Newman, L., and Weinstein-Lloyd, J.: Analysis of the processing of Nashville urban emissions on July 3 and July 18, 1995, J. Geophys. Res., 105, 9155–9164, 2000. Daum P. H., Kleinman, L. I., Springston, S. R., Nunnermacker, L.
J., Lee, Y.- N., Weinstein-Lloyd, J., Zheng, J., and Berkowitz, C. M.: A comparative study of O3formation in the Houston urban
and industrial plumes during the 2000 Texas Air Quality Study: J. Geophys. Res., 108, 4715, doi:10.1029/2003JD003552, 2003. de Foy, B., Caetano, E., Magana, V., Zitacuaro, A., Cardenas, B., Retama, A., Ramos, R., Molina, L. T., and Molina, M. J.: Mexico City basin wind circulation during the MCMA-2003 field cam-paign, Atmos. Chem. Phys., 5, 2267–2288, 2005,
http://www.atmos-chem-phys.net/5/2267/2005/.
de Foy, B., Clappier, A., Molina, L. T., and Molina, M. J.: Distinct wind convergence patterns due to thermal and momentum forc-ing of the low level jet into the Mexico City basin, Atmos. Chem. Phys., 6, 1249–1265, 2006a.
de Foy, B., Molina, L. T., and Molina, M. J.: Satellite-derived land surface parameters for mesoscale modeling of the Mexico City