HAL Id: hal-00302936
https://hal.archives-ouvertes.fr/hal-00302936
Submitted on 29 Nov 2007
HAL is a multi-disciplinary open access
archive for the deposit and dissemination of
sci-entific research documents, whether they are
pub-lished or not. The documents may come from
teaching and research institutions in France or
abroad, or from public or private research centers.
L’archive ouverte pluridisciplinaire HAL, est
destinée au dépôt et à la diffusion de documents
scientifiques de niveau recherche, publiés ou non,
émanant des établissements d’enseignement et de
recherche français ou étrangers, des laboratoires
publics ou privés.
On a spectrum of nonlinear internal waves in the oceanic
coastal zone
A. Filonov, V. Novotryasov
To cite this version:
A. Filonov, V. Novotryasov. On a spectrum of nonlinear internal waves in the oceanic coastal zone.
Nonlinear Processes in Geophysics, European Geosciences Union (EGU), 2007, 14 (6), pp.757-762.
�hal-00302936�
www.nonlin-processes-geophys.net/14/757/2007/ © Author(s) 2007. This work is licensed
under a Creative Commons License.
Nonlinear Processes
in Geophysics
On a spectrum of nonlinear internal waves in the
oceanic coastal zone
A. Filonov1and V. Novotryasov2
1Physics Department, University of Guadalajara, M´exico 2V.I.Il’ichev Pacific Oceanological Institute, Vladivostok, Russia
Received: 4 July 2007 – Revised: 13 November 2007 – Accepted: 13 November 2007 – Published: 29 November 2007
Abstract. This paper studies the internal wave band of
tem-perature fluctuation spectra in the coastal zone of Pacific ocean. It is observed that on the central Mexican Pacific Shelf in the high-frequency band of temperature spectra the spectral exponent tends to ∼ω−1at the time of spring tide and ω−2at the time of neap tide. On the western shelf of the Japan/East Sea, in the ≪ω≪N∗range, where N∗is the representative buoyancy frequency and is the inertial fre-quency, the rate tends to ∼ω−3. These features of spectra are simulated by the model spectrum of nonlinear internal waves in the shallow water. Interaction of high-frequency in-ternal waves with an inin-ternal wave of semidiurnal frequency is considered. It is shown that as a result of the interaction the spectrum of high-frequency internal waves take the uni-versal form and the spectral exponent tends to ∼ω−1.
1 Introduction
Internal gravity waves play a significant role in the dynamics of an oceanic coastal zone (Gill and Clarke, 1974; LeBlond and Mysak, 1978). The spectrum represents one of the major characteristics of internal waves. It is used as a representa-tive statistical description of the internal wave field in studies of nonlinear interaction (e.g. Hibiya et al., 1998), acoustic propagation (e.g. Colosi et al., 1998), and mixing parameter-ization (Polzin, 1995). As a result of the analysis of several time series of temperature and currents belonging to differ-ent areas of the World Ocean, Garrett and Munk (from here, GM) (1979) have constructed the generalized spectrum of internal waves for the open ocean. It has permeated the lit-erature and is used in ways that sometimes exceed its ap-plicability. The analysis of some publications (Filonov and Lavin, 2003; Filonov and Novotryasov, 2005; Hosegood and Correspondence to: A. Filonov
van Haren, 2006) showed that the construction of a univer-sal spectrum for internal waves on a shelf, similar to the GM spectrum, was not possible. Such spectrum should de-pend on fast disintegration of the main internal fluctuation (for example, semidiurnal) and redistributions of its energy to fluctuations of high frequencies. During the transforma-tion the spectrum of internal waves should change its shape as a function of the barotropic tide intensity (height). The shape also depends on the choice of measurement site on the shelf (i.e. on the location of thermocline depth relative to the surface and bottom) as well as other factors. Moreover, the spectral exponent depends on the frequency band, and the nature of nonlinear transformation of waves depends on their frequency, too. Due to non-linear transformation of internal waves on the shelf, the spectral exponent changes with the growth of frequency (Fig. 4).
Thus, because of the impossibility to construct a univer-sal spectrum for internal waves, some researchers have en-gaged in studying the structure of a spectrum that depends on frequency growth that has significant applications, e.g., for the modeling of propagation of nonlinear internal waves on a shelf.
Because it is impossible to construct a universal spectrum of internal waves in the coastal zone, which would be sim-ilar to the GM spectrum, some researchers have engaged in studies of processes that account for these spectral exponents and attempted to model them. This is, to some extent, the objective of our work.
Features of spectra of internal waves has been emphasized in numerous works (van Haren et al., 2002; Filonov and Lavin, 2003; van Haren and Millot, 2003; van Haren, 2004; Hosegood and van Haren, 2006), in which the spectral ex-ponents in different bands of internal waves have asymptotic values of ω−3, ω−2or ω−1.
758 : A. Filonov and V. Novotryasov: A spectrum of nonlinear internal waves in the coastal zone
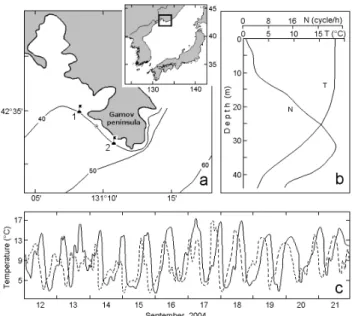
Fig. 1. (a) Study area on the Japan/East ocean shelf, September
2004. The mooring location is shown in Arabic. The circle indi-cates the location of the moored vessel, from which hourly casts were conducted on September, 20. (b) Daily mean vertical pro-files of temperature T and buoyancy frequency N . (c) Temperature variations from the two moorings: buoy 1, continuous line; buoy 2, dashed line.
2 The model
A spectral model of nonlinear internal gravity waves is de-veloped. It is assumed that H /λ≪1, and a/H ≪1, where
H is the water depth, λ is a characteristic wave-length, a is
a representative wave amplitude, and wave frequence meets the condition ω ≪N∗,where N∗is a representative buoyancy frequency. The basic component of this theory is the simple wave equation. For the first most powerful mode of the weak nonlinear internal waves the simple wave equation is written as
∂η/∂t +c∂η/∂x+αη∂η/∂x=0, (1) and is valid when nonlinearity is small. The parameter α is used as small parameter in the perturbation method to produce the evolution equation. Here η is the wave profile which, in small-amplitude, long-wave limit, gives the verti-cal displacement of the pycnocline in the first mode and c is the phase speed of long internal waves; x is a horizontal coor-dinate and t is time. Parameter of nonlinearity is determined by the background density and is related in the Boussinesq approximation as: α= 3c 0 Z −H ϕz3dz × 2 0 Z −H ϕ2zdz −1 , (2)
where z is a vertical coordinate, positive upward. The phase speed of a linear long wave c and the amplitude function of
the wave mode ϕ(z) are determined from the solution of the eigenvalue problem
d2ϕ/dz2+c−2N2(z) ϕ=0, (3) with boundary condition
ϕ(−H )=ϕ(0)=0, (4)
and with the normalization
ϕmax=1. (5)
Let us consider transformation of the intensity spectrum of shallow water internal wave’s vertical displacements or the spectrum of those internal waves. We assume that the wave field η(t, 0)=η(t) at the boundary x=0 is statistically ho-mogeneous and is described by the Gaussian statistics with a zero mean value and covariant function B0(τ )=σ02R(τ ),
where σ02=B(0)= ¯η20is the root-meansquare value of vertical displacements and R is the correlation coefficient.
We confine our analysis to the initial stage of waves evo-lution, which is characterized by the condition x<x∗, where
x∗=(αH/aω)H is the distance on which shock waves appear.
At this stage, there are no discontinuities and the coherent nonlinear interaction of harmonics of the initial perturbation with energy conservation manifests itself. Since the field at the boundary is statistically homogeneous, we obtain the fol-lowing relation for the spectra of vertical displacements at the arbitrary distance x<x∗following (Gurbatov et al., 1990; Filonov and Novotryasov, 2005):
Spη(ω; x)=exp[−(σ0 βωx)2] 2π(βωx)2 ∞ Z −∞ {exp[B0(τ )(βωx)2] − 1} exp(iωτ ) · dτ, (6) where β=α/c2.
Equation 6 allows us to study the transformation of the ini-tial perturbation spectrum with arbitrary width and spectral shape. Determination of the equilibrium shape for the spec-tral distribution or finding a universal law for the spectrum
Spηω; x) at ω→∞ is of special interest. Let us consider the behavior of the spectrum as frequency increases. In this case, we can use the saddle-point method to estimate integral (6). Restricting ourselves to the first two terms of the covari-ant function expansion in the series B0(τ )≈σ02(1−ντ2/2),
where ν= ∞ R −∞ ω2E0(ω)dω/ ∞ R −∞ E0(ω)dω, and substituting
this expansion into (6), we get
Spη(ω; x)∼ω−3(βx)−3
√
2π/ν exp[−(σ0βνx)−2/2]. (7)
It follows from the obtained expression (7) that the spectrum of nonlinear shallow water internal waves for
σ0βx≪1 with ω→∞ decreases according to a power law Spη(ω ; x)∼ω−3(Gurbatov et al., 1990). Thus, Eq. (6) makes it possible to conclude that the quadratic nonlinearity pro-duces the spectral exponent ∼ω−3(physically caused by en-ergy transfer to higher frequencies). Such is indeed the case in the middle-frequency band of the spectrum at the Fig. 3.
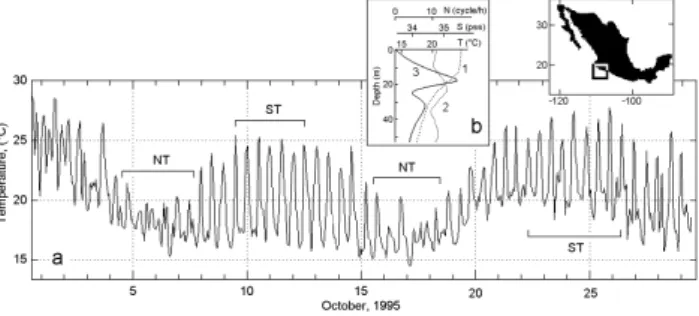
Fig. 2. (a) Temperature variations from the mooring located on the
Mexican Pacific (Barra de Navidad) in October, 1995. Letters NT and ST denote the periods of neap and a spring barotropic tides respectively. (b) Daily mean vertical profiles of temperature (1), salinity (2) and calculated on them buoyancy frequency (3) from the mooring deployed near Barra de Navidad in October 1995.
Tidal and/or inertial internal waves with small but finite amplitude and linear random waves (RW) with a typical fre-quency ω∗∼N∗/2 are a common feature of coastal areas.
Let us consider interaction nonlinear internal wave with fre-quence (tidal or inertial) and linear RW using asymptotic theory of evolution of the spectrum of internal waves de-scribed in terms of the simple wave Eq. (1). Let the verti-cal displacement of the pycnocline η(x, t ) at the boundary of the coastal area x=0 be the superposition of internal wave with frequence and background linear RW with a typical frequency ω∗≫ and the variance σ2=<ξ02>
η0(t )=A cos(t + ψ) + ξ0(t ), (8) where ψ− is a random phase with uniform distribution in the interval [−π, +π].
The transformation of a wave field η is determined by the modified Eq. (1)
∂η/∂x′−βη∂η/∂θ=0, (9) where x′=ct, θ=t−x/c and β=α/c2.
Henceforth the prime on x′is omitted. Equation (9) is a basic model of the interaction of internal waves. Mathemat-ically, this is a Cauchy initial value problem, where the evo-lution coordinate (“time”) is essentially a spatial coordinate. This equation with the initial condition η(θ, x=0)=η0(t )
de-scribes the transformation of a wave field η in the coordinate. The solution of (9) that satisfies the initial condition at x=0, is
η=η0(θ +βxη). (10)
We confine our analysis to the wave evolution stage, which is characterized by conditions x<xT, where xT= (βA)−1 and x<xW, where xW= (βσ ω∗)−1. In this stage the shock internal wave appears and it is not accompanied by genera-tion of internal solitons. We introduce parameters dT=x/xT and dW=x/xW, which determine the similarity between an internal shock-wave and internal wave and consider the case
dT<1, dW<1. For this case spectral amplitude wave field η is a(ω, x)=(2π)−1 +∞ Z −∞ η(θ, x) exp(iωθ )dθ (11)
After substituting for ϑ=θ+βxη Eq. (11) is reduced to a(ω, x)= 1 2π +∞ Z −∞ η0(ϑ )(1−βx ∂η0 ∂ϑ) exp [iω(ϑ−βxη0)] dϑ (12) We perform the Fourier transform of the wave field η0(ϑ ),
which at the boundary x=0 is determined by (8), taking a path integral twice, and obtain spectral amplitude of the wave. a(ω, x)=(2πiωβx)−1 +∞ Z −∞ exp[−iωβxA cos(t + ψ)−
−iωβxξ0(t )]−1}eiωtdt
. (13)
We shall consider the wave-tide interaction using formula (13). Let n∗ be a characteristic number of tidal harmonics and n∗ the spectral band at x>0. Let the tide be far from the
place of the shock-front formation, assuming that n∗ ≪ ω∗ and the permutation ω≃n∗ before ξ0(t ). In that case the
ef-ficiency of waves influence on the tide is determined by the parameter dT W≃nβxσ =dW(n∗/ω∗)≪1. Consequently, the tide does not cause a large influence on the waves be-fore the formation of wave’s fronts. From the expression
dW T =ωβxA=(ω∗/ ) dT we are convinced that the tide in-fluence on the waves can be considerable at some distance, where the distortion of the tide is faint.
Consider the case dW≪1, i.e., when the steepening of the waves is weak. It follows from (13) that
a(ω, x) = −(2πiωβx)−1 +∞ Z −∞ [exp{−iωβxA cos(τ + ψ)}− −1] exp(iωτ )dτ +(2π)−1 +∞ Z −∞ ξ0(τ ) exp{−iωβxA cos(τ + ψ)+ +iωτ }dτ. (14)
From (14), we can affirm that the first component is the spectral density of the tide and that the second component is the spectral density of waves distorted by the tide. Per-forming a Bessel expansion of the exponent in Eq. (14) and taking into account that <a(ω)a∗(ω′)>=S(ω)δ(ω−ω′), <ξ0(t +τ )ξ0(t )>=B(τ ) we obtain the formula for the
spec-trum of the wave field Spη(ω, x)= ∞ X n=−∞ n6=0 J2 n(XAn) exp{−(Xσ n)2} (Xn)2 ×δ(ω − n) + ∞ X n=−∞ n6=0 Jn2(ωXA) 2π(ωX)2 exp[−(ωXσ ) 2 ]
760 : A. Filonov and V. Novotryasov: A spectrum of nonlinear internal waves in the coastal zone
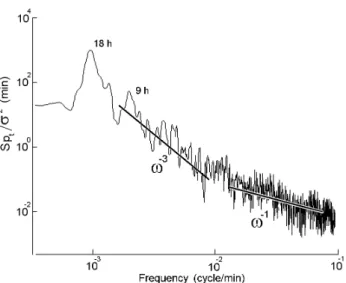
Fig. 3. Normalized spectra for the temperature fluctuations of the
35 m level (buoy 2, near the Gamov peninsula). The lines show dependences of the spectrum slope with growth of frequency.
×
+∞
Z
−∞
{exp[B0(s)(ωX)2]−1}ei(ω−n)sds, (15)
where X = βx
The first series in (15) is a superposition of tidal harmonics distorted by the interaction with the waves. The second series in the (15) is the spectrum of the linear random waves Spξ distorted by the interaction with the tide.
We will determine the spectrum of waves Spξ, when
dT W≫1. For that, we use the following approximation of the Bessel function
Jn2(y)≃(πy)−1(1+ cos(2y−nπ−π/2)), |y|>|n| (16) We define the frequency band of the waves as follows: ω ∈
[ωl, ωh], where 1ω=ωh−ωl ≫ . Based on formula (16), it follows that the boundaries of the wave spectrum under condition dT W ≫ 1 are equal to
ω′l=ωl/(1+dT), ω′h=ωh/(1−dT). (17) We can write the wave spectrum Spξ for the band ω ∈
[ωl′=ωh/(1+dT), ω′h=ωh/(1−dT)] in the following form:
Spξ(ω, x)≃(πωβxA)−1 ∞ X n=−∞ S0(ω−n)(1+ cos(2ωβxA−πn − π/2)) ≃ ≃(π ωβxA)1 1 ∞ Z −∞ S0(ω)dω= σ 2 ωπβxA. (18)
Based on this formula, we can observe that the high-frequency wave spectrum is non-homogeneous and has the asymptotic form Spξ∼ω−1. Parameters of the spectrum are full energy waves ∼σ2, amplitude – A and frequency –
for low-frequency waves (for example, semidiurnal or iner-tial frequency).
3 Observations
The model has been validated with the values observed in two regions of the Pacific Ocean: on a shelf of the Japan/East Sea and on the shelf of the western coast of Mexico. In the first region, measurements were performed during 10 days starting 12 September 2004, near the Gamov Peninsula on the Japan Sea coast of Russia (Figure 1a). Time series of temperature were collected from two moorings which were deployed along the coastline at a distance of 800 m from it, approximately at 40 m depth and separated by a distance of 5.5 km from each other.
The first of them was deployed at 28 m depth and the sec-ond one, at 35 m depth (below the surface). Each mooring was equipped with digital thermographs made by a Russian manufacturer. The devices had a measuring precision of 0.05◦C for temperature. The sampling rate was 1 m. Tem-perature and salinity vertical profiles were performed on 20– 21 September, from a vessel anchored between the moorings with Canadian Guideline CTD profiler, whose errors were no larger than 0.01◦C in temperature and 0.02 psu in salinity. In total, 25 hourly casts were made.
In the second region, measurements were performed at the Central Pacific Coast of Mexico, near Barra de Navidad (Fig. 2). From 1–30 October 1995, time series were col-lected from a mooring located 2 kilometers away from the coast with a bottom depth of 52 m. It was equipped with a SEACAT SBE-16 CTD at 37 m level. The sampling rate was 1 minute. The temperature and salinity fields near the mooring were measured for 24 h on 2–3 October 1995 with a CTD SBE-19 profiler from a small anchored ship. A total of 72 vertical temperature and salinity profiles were carried out with a time interval of 20 min between any two consecutive profiles (Fig. 2b). Both devices had a measuring accuracy of 0.005◦C for temperature and of 0.0005 S/m for conductivity.
4 Results and discussion
4.1 The shelf of the Japan/East Sea
On Figure 1b mean profiles of temperature and buoyancy fre-quency in the survey area are shown. The time series of tem-perature fluctuations on moorings 1 and 2, smoothed by a Tukey window (with a 1-h width) are shown in Fig. 1c. It is clear that fluctuations of temperature had a quasi-periodic mode with an average period of about 18 h. Cross spectral analysis of these time series has shown that a phase differ-ence between fluctuations of inertial frequency was about 4.1 h, corresponding to the mean velocity propagation be-tween the moorings (close to 0.38 m/s). The phase velocity
c1 of the first mode of the internal Kelvin wave with
fre-quency 1/18 cycles/h is close to 0.4 m/c. This value was cal-culated by means of the solution of the eigenvalue problem (3) and (4), considering the natural profile of the buoyancy frequency. The velocity was close to 0.38 m/s. We conclude that internal Kelvin waves propagated in the coastal zone of the Japan/East Sea. These waves had a large height and were caused by an intensive typhoon that had passed near the sur-vey area.
The spectrum of temperature fluctuations normalized by variance on mooring 1 is shown in Fig. 3. In the low-frequency part of the spectrum, there are peaks of spectral density at 18- and 9-h periods, which correspond to inter-nal waves with inertial period and first overtone. The figure shows good conformity between the inclination of a spec-tral exponent and frequency dependence ∼ω−1 in a range of 0.01<ω<0.1 cycle/min and the same conformity between character of the spectral exponent and frequency dependence
∼ω−3in a range of 0.001<ω<0.01 cycle/min. 4.2 The Mexican shelf of Pacific Ocean.
Processes of nonlinear transformation of internal waves on an abrupt shelf off the Mexican coast have been earlier discussed in several works (Filonov and Konyaev, 2003; Filonov and Novotryasov, 2005). In this coastal area shelf slope is the most critical characteristic of daily internal in-flow. Therefore, these waves are reflected back to the ocean, and only semidiurnal internal tidal waves propagate to the coast (Konyaev and Filonov, 2006).
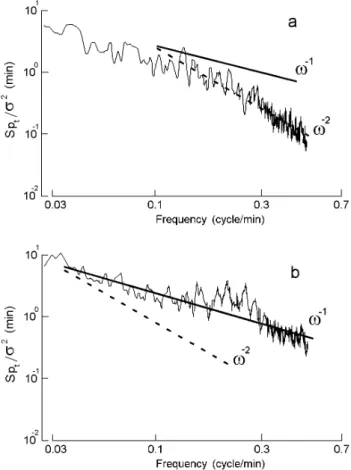
In Fig. 2a the time series of temperature fluctuations, mea-sured 2 km away from coast at 37 m is displayed. Spectra of temperature fluctuations were calculated for the time seg-ments corresponding to neap tide (9–12th, 22–25 days of measurement) and spring tide (4–7th, 15–18th days of mea-surement). The segments had a length of 2048 numbers (the FFT method was used) and were selected so that the variabil-ity of amplitude of fluctuations within a segment was mini-mal. The average spectra (for an interval from 0.03 up to 0.5 cycles/min) for two segments at times of neap and spring barotropic tide (segments NT and ST in Fig. 2a) are shown in Fig. 4a, b. From this figure it follows that as frequency increases; the falloff of a spectrum has a power dependence on ωgf the kind SpT∼ω−p. The inclined line in this fig-ure shows the ω−1slope. The inclination of a spectrum for spring tide is close to p=1 (Fig. 4b), and for neap tide is close to p=2 (Fig. 4a).
The marked distinctions for the inclination of a spectrum are connected with the nonstationarity of internal semidiur-nal waves, caused by monthly variations in the barotropic tide in the survey area on the Mexican shelf. Thus, the analysis has shown that during the moments of barotropic neap tides internal waves are less intense in amplitude and their nonlinear-dispersive disintegration on a shelf causes the slope of their spectrum in the analyzed frequency range in
Fig. 4. Normalized spectra of high-frequency temperature
fluctua-tions for neap (a) and spring (b) barotropic tide. The inclined lines show dependences of the spectrum slope with growth of frequency.
accordance with the SpT∼ω−2law, which is consistent with the background spectrum GM of internal waves in Open Ocean (Garrett and Munk, 1979). More intensive high-frequency internal waves interact with internal tide during the moments of spring. The slope of their spectrum behaves asSpT∼ω−1. The slope of a spectrum ω−3 in the middle band of an internal wave’s frequency was earlier discussed in several works (van Haren et al., 2002; Filonov and Lavin, 2003; van Haren, 2004), however the slope of spectrum ω−1 in a high-frequency band had not yet been discussed in the scientific literature.
As a conclusion, in the ocean shelf in the presence of in-tensive internal tidal or inertial waves, the modeled spectrum of temperature variations in a high-frequency band is non-uniform and has slope p=1, as demonstrated in Fig. 3 and 4. Hence, the influence of nonlinearity can render essential influence on the formation of a universal spectrum of internal waves in a coastal zone of the ocean.
Acknowledgements. This work was supported by the Russian Basic
Research Foundation, project 06-I-13-048 and by CONACYT (Mexico) through projects: 35553-T and 46674-F. The authors thank the editor and an anonymous referee for remarks which led
762 : A. Filonov and V. Novotryasov: A spectrum of nonlinear internal waves in the coastal zone
to a substantial improvement of the article. Special recognition goes to George Davidov for his help in field measurements.
Edited by: R. Grimshaw
Reviewed by: Y. Geshelin and another anonymous referee
References
Colosi, J. A. and the ATOS Group: A review of recent results on ocean acoustic wave propagation in random media: Basin scales, IEEE J. Oceanic Eng., 24, 138–155, 1999.
Filonov, A. E. and Konyaev, K. V.: Nonlinear Internal Waves near Mexico’s Central Pacific Coast, edited by: Velasco Fuentes, O. U., Sheinbaum, J., and Ochoa, J.: Nonlinear Processes in Geo-physical Fluid Dynamics, Kluver Academic Publishers, 257– 274, 2003.
Filonov, A. E. and Lavin, M. P.: Internal tides in the North-ern Gulf of California, J. Gephys. Res., 108(C5), 3151, doi:10.1029/2002JC001460, 2003.
Filonov, A. and Novotryasov, V.: Features of the nonlinear wave spectrum in the coastal zone, Geophiys. Res. Lett., 32, L15602, doi:10.1029/2005GL023046, 2005.
Filonov, A. and Konyaev, K.: Orbital motions and coherent structures in the internal tide on a steep shelf off the pa-cific coast of Mexico, Geophys. Res. Lett., 33, L14612, doi:10.29/2006GL026712, 2006.
Garrett, C. J. R. and Munk, W.H.: Internal waves in the ocean, Annu. Rev. Fluid Mech., 11, 339–369, 1979.
Gill, A. E. and Clarke, A. J.: Wind-induced upwelling, Deep-Sea Res., 21, 325–345, 1974.
Hibiya, T., Niwa, Y., and Fujiwara, K.: Numerical experiments of nonlinear energy transfer within the oceanic internal wave spec-trum, J. Geophys. Res., 103, 18 715–17 722, 1998.
Gurbatov, S. N., Malakhov, A. N., and Saichev, A. I.: Nonlinear Random Waves in Media with Zero Dispersion, Nauka, Moscow, 215 pp., 1990.
Hosegood, P. and van Haren, H.: Sub-inertial modulation of semi-diurnal currents over the continental slope in Faeroe-Shetland Channel, Deep-Sea Res. I, 53, 627–655, 2006.
Konyaev, K. and Filonov, A.: Breaking of a Tidal Internal Waves on a Steep Shelf as Inferred from Temperature Measurements, Izv. Atmos. Oceanic Phys., 42(4), 523–530, 2006.
LeBlond, P. H. and Mysak, L. A.: Waves in the Ocean, Elsevier, Amsterdam, 606 pp., 1979.
Polzin, K. L., Toole, J. M., and Schmitt, R. W.: Finescale parametrization of turbulent disspation, J. Phys. Oceanogr., 25, 306–328, 1995.
van Haren, H., Maas, L., and van Aken, H.: On the nature of internal waves spectra near a continental slope, Geophiys. Res. Lett., 29, 1615, doi:10.1029/2001GL014341, 2002.
van Haren, H. and Millot, C.:, Seasonality of internal waves kinetic energy spectra in the Ligurian Basin, Ocean. Acta, 26, 635–644, 2003.
van Haren, H.: Some observations of nonlinearly modified internal wave spectra, J. Geophys. Res., 109, C03045, doi:10.1029/2003JC002136, 2004.