Assessment of Gasoline Direct Injection Engine
Cold Start Particulate Emission Sources
The MIT Faculty has made this article openly available.
Please share
how this access benefits you. Your story matters.
Citation
Oh, Changhoon and Wai K. Cheng. "Assessment of Gasoline Direct
Injection Engine Cold Start Particulate Emission Sources." SAE
International Journal of Engines 10, 4 (2017): pp. 1556-1565.
As Published
10.4271/2017-01-0795
Version
Author's final manuscript
Citable link
https://hdl.handle.net/1721.1/121564
Terms of Use
Creative Commons Attribution-Noncommercial-Share Alike
Page 1 of 9
2017-01-0795
Assessment of Gasoline Direct Injection Engine Cold Start Particulate Emission
Sources
Author, co-author (
Do NOT enter this information. It will be pulled from participant tab in
MyTechZone
)
Affiliation (
Do NOT enter this information. It will be pulled from participant tab in MyTechZone
)
Abstract
The gasoline direct injection (GDI) engine particulate emission sources are assessed under cold start conditions: the fast idle and speed/load combinations representative of the 1st acceleration in the
US FTP. The focus is on the accumulation mode particle number (PN) emission. The sources are non-fuel, combustion of the premixed charge, and liquid fuel film. The non-fuel emissions are measured by operating the engine with premixed methane/air or hydrogen/air. Then the PN level is substantially lower than what is obtained with normal GDI operation; thus non-fuel contribution to PN is small. When operating with stoichiometric premixed gasoline/air, the PN level is comparable to the non-fuel level; thus premixed-stoichiometric mixture combustion does not significantly generate particulates. For fuel rich premixed gasoline/air, PN increases dramatically when lambda is less than 0.7 to 0.8. This lambda threshold does not correlate with engine speed and load; however, it increases slightly when the intake air is diluted with nitrogen. To assess the fraction of the GDI injected fuel that contributes to the PN, at fixed load and lambda, the injected gasoline is systematically reduced, with premixed methane as balance for the fuel. It is found that only a small fraction of the injected fuel contributes to the PM emissions. The fraction is dependent on the fuel amount and the rigor of the mixing process; hence it is dependent on speed, load, and timing of the injection.
Introduction
The gasoline direct injection (GDI) technology [1] is an important enabler for boosted downsize spark ignition engines which are employed to meet the increasingly stringent fuel economy
requirements [2]. The in-cylinder injection cools the charge, thereby increases the engine knock resistance and volumetric efficiency [3, 4]. The GDI engines, however, have much higher particulate matter (PM) emission than the port-fuel-injection (PFI) engines, especially during cold start [5-8], because of the substantial presence of in-cylinder liquid fuel film due to the direct injection. (In PFI engines under part load condition, there is a reverse flow from the cylinder to the intake manifold when the intake valve opens [9]. This flow substantially spreads the port liquid fuel over the port and manifold surfaces, thereby facilitates evaporation and reduces the amount of liquid fuel transport into the cylinder.) PM emission in GDI engines is a major concern.
The fine particle emissions are particularly important because of their impact on health effects [10-12]. Regulations have been established to constrain the particle number (PN). The Euro VI regulation calls for a limit of 6x10¹¹ particles/ km for light-duty vehicles [13]. The
PN is measured according to the particle measurement protocol (PMP) [14]. The number comprises the solid (non-volatile) particles in the 23 – 2500 nm range. These are particles mostly in the accumulation mode of the particle size spectrum [15].
Spark-ignition engine particulate emission sources comprise of: (a) Non-fuel sources – from the lubrication oil, combustion
chamber deposit, ...
(b) Particles formed from the locally fuel rich regions of the premixed flame.
(c) Particles from pyrolysis in the fuel rich region of the vapor plume derived from the wall liquid fuel films [16]. The objective of this work is to assess the contributions of these sources under engine cold start condition by a series of experiments that isolates the different sources.
Methodology
Engine
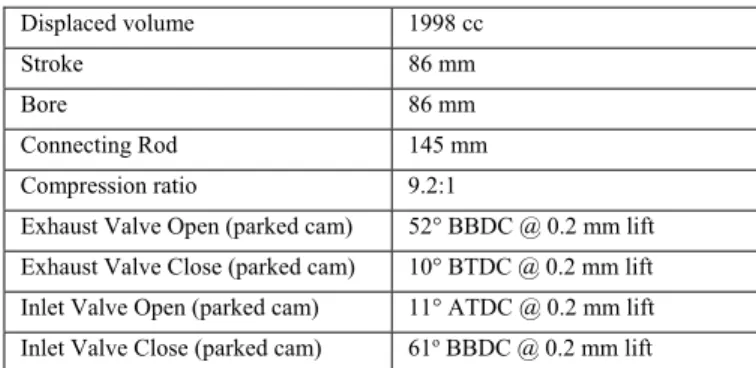
Measurements are made in a modern boosted GDI spark-ignition engine (the GM – LTG engine which powers various models of the Cadillac and Malibu vehicles). The engine specifications are shown in Table 1.
Table 1. Specification for the LTF engine.
Displaced volume 1998 cc
Stroke 86 mm
Bore 86 mm
Connecting Rod 145 mm
Compression ratio 9.2:1
Exhaust Valve Open (parked cam) 52° BBDC @ 0.2 mm lift
Exhaust Valve Close (parked cam) 10° BTDC @ 0.2 mm lift
Inlet Valve Open (parked cam) 11° ATDC @ 0.2 mm lift
The engine is reconfigured to run as a single cylinder engine on cylinder #1, which is equipped with its own intake and exhaust runners. Intake air is supplied by a motor driven screw compressor capable of boosting to a MAP of 1.7 bar. The overall schematic of the engine is shown in Fig. 1.
The engine is controlled by a computer by which the spark timing, injection timing, and injection duration could be specified. The cam phasers for the valve timing control are not energized so that the cam phasers are at the parked positions.
All the results have been obtained at steady state engine condition as indicated by that the measurements are no longer changing with time. It takes nominally 1 minute to achieve steady state condition for GDI operations, and, because of the low emission level (close to ambient value), up to 10 minutes for the premixed charge operations.
Figure 1. Schematic of engine, fuel supply, and measurement system.
Fuel delivery system
It will be discussed in the subsequent sections that besides the direct injection of the original engine, several fuel supplies are used in the experiment. The supplies include pre-vaporized-premixed gasoline, methane, and hydrogen. The latter two fuels are used to assess the engine non-fuel PM emissions. The gasoline used in the experiments is a certification gasoline (Haltermann HF437, with 97.4 RON, 89 MON and RVP of 62 kPa). A schematic of the overall system is shown in Fig. 1.
Gasoline direct injection
The engine uses a wall-guided direct injection strategy with a side-mounted injector inclined at 25o from the horizontal. The injector has
6 holes with a spray cone angle of 52o. The fuel for the direct
injection is supplied by a fuel bladder pressurized with bottle nitrogen gas. The fuel pressure can be regulated from 30 to 150 bar. The nominal injection pressure is at 50 bar.
Pre-vaporized-premixed gasoline
Pre-vaporized-premixed gasoline mixture is used to assess the PM production in the engine nominal premixed flame. This fuel is prepared via a port-fuel-injector (operating at 3.5 bar injection pressure) that sprays the gasoline onto the heated surface (at 80o C) of
a tube in which the intake air passes through. To ensure adequate mixing, the mixture passes through a long mixing pipe before entering the intake manifold of the engine.
Gaseous fuel supply
The gaseous fuels (methane and hydrogen) are introduced far upstream in the intake system to ensure good mixing between the gases and the intake air.
PN measurement
The particles are measured by the Cambustion DMS 500 Fast Particle Sizer equipped with a rotating disk type dilutor [17]. The instrument measures the distribution of the exhaust gas particles effective mobility diameter. (The term effective is used because the measured mobility diameter results from the combined effects of the true mobility diameter and the efficiency of attaching a charge to the particle. The charge attachment is dependent on the shape and size of the particle; see application notes in Ref. [17].) The sample is taken from the exhaust runner at approximately 15 cm from the exhaust valve, and with the sampling line heated to 150o C; the procedure is
consistent with the PMP.
The software of DMS500 uses log-normal distributions to separate the nucleation and the accumulation modes of the distribution. Typical particle size spectra are shown in Fig. 2, from which the distributions for the nucleation and the accumulation can be identified and fitted accordingly.
Figure 2. Typical particle size spectra. The spectra are for different SOI (as CAD ATDC-intake); engine at 1200 rpm, 2 bar NIMEP.
The total particle number N (as number of particles per standard cubic centimeter (#/cc)) is obtained by integrating the respective part of the PM spectrum associated with the accumulation and nucleation modes: accum. or nucl. P P accum. or nucl. dN N d og(D ) d og(D )
(1)The size bin range of the instrument is from 5 to 1000 nm. However, there are not many particles above 1000 nm, and that the number of nucleation mode particles above 23 nm is relatively small (compared to the total number accumulation mode particles). Thus Naccum is a
good measure of the total number of 23-2500 nm particles called out in PMP.
The DMS500 has a data rate (for scanning all the size channels) of 10Hz. The data reported are averaged over a period of 10 seconds.
Surge Tank 1 Air N2 Pressurize Pre-mixing pipe Fuel Tank Gaso -line High pressure Direct injection Low pressure injection Engine Exhaust Gas accumulator PN analyzer Exhaust λ meter Surge Tank 2 N2 for dilution CH4 or H2 Screw compressor Isolated exhaust Isolated intake
Page 3 of 9
Each data point comprises at least 3 measurements to establish consistency.
Operating points of interest
Since cold-start PN is of interest, the water and lubricant
temperatures are kept at 25o C. is kept at stoichiometric except for
experiments with sweeps. Spark timing is adjusted for CA50 = 7o
aTDC so that combustion phasing is approximately at optimum. The COV of the NIMEP is kept under 10% (some results have been rejected in the SOI sweep experiments because of the high COV). Note that the optimum spark timing used in this work is to maximize the data range in the parameter sweeps while keeping the engine stable. In practice, during the cold fast idle period, the timing is significantly retarded to accelerate the catalyst light-off time. Operating points of interest are at fast idle (1200 rpm, 2 bar NIMEP), and points in the first acceleration of the FTP75; see Fig. 3. The following operating points are representative of those in the first acceleration: 1400 rpm, 4 bar NIMEP; 1600 rpm, 6 bar NIMEP; 1800 rpm, 8 bar NIMEP. Sweeps at constant speeds and loads are also done to assess the data trends.
The engine transient time scale in the first FTP acceleration is of the order of 2 to 5 seconds, which are long compared to the cycle times of 60 to 100 ms. However, the combustion surface temperature, which impacts the fuel film evaporation, is in transient responding to the load and speed changes. Therefore, it is cautioned that the static engine test would not reproduce the same PM emissions as in the actual test cycle. (See also comment at the end of the conclusion section.)
Figure 3. Operating condition of the first acceleration in FTP75; mid-size sedan (Ford Taurus vehicle).
GDI engine baseline PN emissions as function of
SOI timing
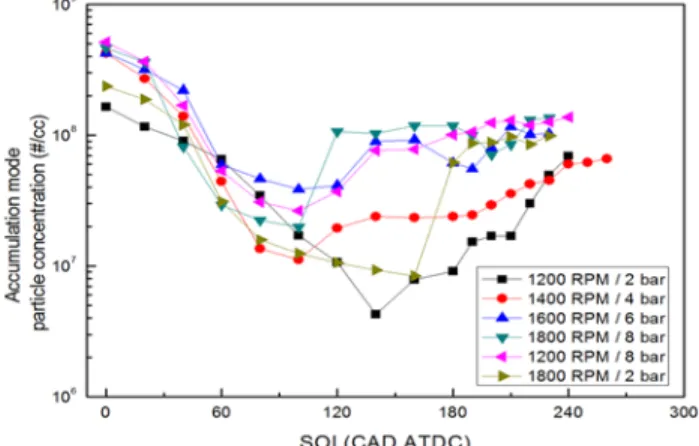
To establish a baseline PN emission from the engine, a sweep of the start-of-injection (SOI) timing is done. The results at the fast idle condition (1200 rpm, 2 bar NIMEP) are shown in Fig. 4. There is a range of SOI timing (240 to 305 CAD ATDC-intake) for which combustion is deemed unstable (COV of NIMEP > 10%). With the late injection in this range, the charge is significantly stratified. Then the charge motion does not transport a mixture of the correct equivalence ratio to the spark plug; the process results in significant variations in the flame kernel development. The combustion
becomes stable again with further retard of SOI when the charge motion convects the correct mixture to the spark plug. This phenomenon has also been observed in a similar engine [16]. The nucleation mode PN is relatively independent of SOI timing. This insensitivity suggests that the nucleation mode particles may not be related to the amount of in-cylinder liquid fuel, which changes substantially with the SOI timing. Since our focus is on the accumulation mode PN, the nucleation mode particles will not be further discussed. From here on, the PN are the values of the accumulation mode only.
For the accumulation mode, the PN is high with early injection and it drops rapidly (by more than an order of magnitude) with SOI at mid-stroke. Then it rises again when SOI is in the compression mid-stroke. The high PN values with early injection (SOI between 0 to 30 CAD ATDC) are due to the significant wall liquid fuel film formed on the head resulting from the bounce of the fuel jet off the piston [16]. The rise of the PN with retarding SOI in the compression stroke is due to the decreasing time for fuel evaporation and mixing with the charge air [16].
Figure 4. Engine PN emissions as a function of SOI at fast idle (1200 rpm, 2 bar NIMEP). Injection duration approximately 7 CAD (duration changes to keep NIMEP constant)
The PN values as a function of SOI for other speed and load conditions are shown in Fig. 5. (Only the SOI range with stable combustion is shown.) The PN behaviors are similar to those under fast idle condition.
Figure 5. Engine accumulation mode PN emissions as a function of SOI at operating points representative of the first FTP acceleration.
0 10 20 30 500 1000 1500 2000 20 25 30 35
test time (sec) 0 50 100 150 mp h rp m To rq (N m )
Non-fuel PN emissions
Premixed gaseous fuels are used to assess the PN emissions due to non-fuel sources (such as the lubricant oil and combustion chamber deposit). Originally, hydrogen is used because it is impossible to product soot in hydrogen combustion. However, it is observed that the heat release schedule, and thus cylinder pressure/temperature history produced by hydrogen combustion are significantly different from those produced by gasoline; direct comparison may not be meaningful. Therefore methane is used as fuel to assess the non-fuel PN mission because there should not be any significant soot formation in the combustion of a premixed stoichiometric mixture.
PN from premixed stoichiometric methane-air
combustion
The accumulation mode PN emissions for premixed methane-air mixture as a function of NIMEP are shown in Fig. 6 for engine speeds from 1200 to 1800 rpm. There is no consistent speed dependence. The general trend is that PN is at a low level (~104/cc)
and it is not sensitive to load up to ~ 5 bar NIMEP; then it increases with NIMEP up to 105/cc at 8 bar NIMEP. In general, the values are
significantly lower than those obtained with GDI. (These values will be plotted together with the GDI values later.)
Figure 6. Accumulation mode PN from stoichiometric methane-air premixed mixture.
The PN values with premixed stoichiometric methane-air combustion are compared to those obtained in a motored engine. The procedure is to stop firing the engine (by cutting off the fuel), and record the PN continuously while the engine is motored (with the throttle fixed) at the same speed via the dynamometer. The results for selected speeds and loads are shown in Fig. 7. The symbols on the left-hand-side of the plot are the firing PN values; the lines on the right-hand-side of the plot are the motoring values. The motoring values are not very much different from the firing values. The observation suggests that combustion should not be a significant source of particulates and the PN is due to non-fuel sources.
To further confirm that the accumulation mode PN observed is not from the premixed stoichiometric methane combustion, the PN from the firing engine is compared to those from a motoring engine at the same peak pressure, which is adjusted by boosting the intake pressure. Due to the limitation of the compressor, the maximum
corresponding NIMEP is limited to 4 bar. The results are shown in Fig. 8. The PN values are comparable.
Figure 7. Accumulation mode PN from stoichiometric methane-air premixed mixture, comparing engine firing values and motoring values.
Figure 8. Accumulation mode PN from firing engine with premixed stoichiometric methane-air and motoring engine with peak pressure adjusted to the same value as in the firing engine. Filled symbols: firing engine; open symbols: motoring engine.
These observations suggest that combustion of the premixed stoichiometric methane-air produces, if any, insignificant amount of accumulation mode particles. Therefore the observed PN values are due to the non-fuel sources. For comparison, the ambient air of the test cell measured with the DMS500 with the same setting as in the engine experiment, registers a PN of 6x10³/cc, which is not much
lower than those obtained from the engine; see Fig. 8.
The data trend in Fig. 6 may be explained as follows. As NIMEP is lowered from 8 bar, the PN decreases plausibly because there is less crevice outflow which is a major source of oil particles. When the NIMEP value is sufficiently low (<6 bar), the PN due to the crevice flow is small compared to other background sources (note that ambient air produces a PN of 6x10³/cc) and the PN value levels out.
The exact nature of these background sources has not been identified. In summary, the non-fuel PN emissions from 2 to 8 bar NIMEP and 1200 to 1800 rpm are of the order of 104 to 105/cc. These are
significantly lower (by an order of magnitude; see Fig. 9 later) than the GDI PN emissions.
Page 5 of 9
PN from gasoline pre-mixed flames
PN from premixed stoichiometric gasoline-air flame
To assess the extent that flame is a PN source, the engine is operated with pre-vaporized and premixed gasoline-air mixture at = 1. The results are shown in Fig. 9. In this figure, the accumulation mode PN emissions from stoichiometric premixed gasoline-air, from premixed methane and air, and from gasoline direct injection are compared. For the GDI operation, the SOI has been set at the value that gives the lowest PN emission at each operating point. The y-axis values have been normalized by the PN value for the methane-air mixture at 1200 rpm, 2 bar NIMEP.
Figure 9. Comparing accumulation mode PN from stoichiometric mixture of premixed gasoline-air, premixed methane-air, and from stoichiometric GDI operation. For the latter, SOI is at the value that would produce the lowest PN emissions. The y-axis values have been normalized by the PN value for methane-air at 1200 rpm, 2 bar NIMEP.
The results show that PN from the stoichiometric premixed mixtures (methane-air; gasoline-air) are approximately the same, and are both significantly lower than those obtained from GDI at the same speed/load point. Since it has been argued in the last section that the stoichiometric methane-air mixture does not produce significant PN in combustion, the same statement also applies to the premixed stoichiometric gasoline-air mixture.
Particulate from premixed non-stoichiometric
gasoline-air flame
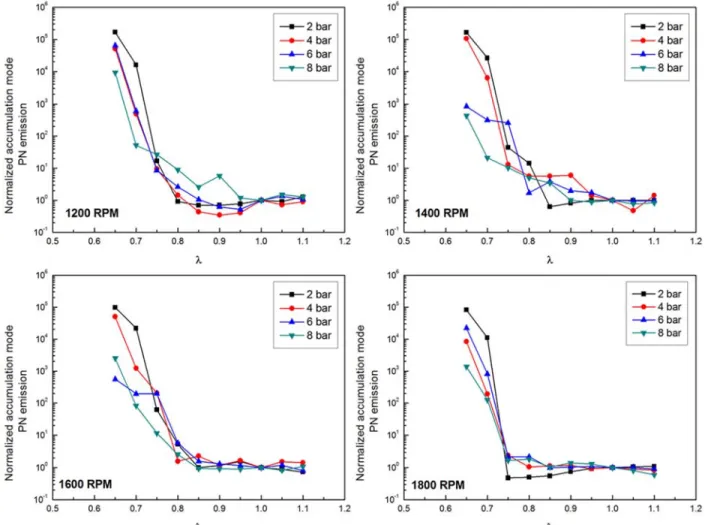
Accumulation mode PN from non-stoichiometric pre-vaporized, premixed gasoline-air mixtures are measured. The results for 1200 rpm is shown in Fig. 10. The PN values do not change significantly until is below 0.8; then they rise rapidly to a high value (note the large range of the y-axis values). Results for 1400, 1600 and 1800 rpm are similar. (The plots are shown in the appendix.) Similar observations for a rich threshold below which the PN rises sharply have been reported [19]. It is noted that for methane-air mixtures, no such threshold is observed down to = 0.7. (Combustion becomes very unstable for methane-air mixture with less than 0.7 and no meaningful result has been obtained.)
A rich threshold below which PN rises sharply may be defined as the point at where the PN is 10 x value at = 1. The threshold values are plotted against the engine speed (Fig. 11) and load (Fig. 12). The thresholds are in the range of = 0.7 to 0.8. No correlation with speed or load is observed.
That the rich threshold is 0.8 or below indicates that to form significant accumulation mode particulate, the local mixture value (due to mixture non-uniformity) has to be below 0.8. Such locally rich zone may be found in the fuel vapor/ air mixing interface of the vapor plume from the wall fuel film [16].
Figure 10. Accumulation mode PN from premixed non-stoichiometric gasoline-air flame in SI engine; engine speed at 1200 rpm.
Figure 11. Rich threshold for PN rise for premixed gasoline-air flame in SI engine as a function of engine speed.
Figure 12. Rich threshold for PN rise for premixed gasoline-air flame in SI engine as a function of NIMEP..
Effect of dilution on the
threshold for particulate
formation in premixed gasoline-air flame
To assess the effect of dilution on the particulate formation in the SI engine gasoline-air flame, nitrogen is added as a diluent to the air in preparing the stoichiometric premixed gasoline-air mixture. The results are shown in Fig. 13 as a function of the mole fraction (xO2) of
O2 in the N2 and air mixture. (To relate xO2 to EGR dilution: at =1,
it is noted that the burned gas has negligible amount of oxygen, and has a molecular weight approximately equal to that of air. Then xO2
≈ (1-EGR) * 21%; thus at 20% EGR, xo2 ≈ 16.8%). The threshold
decreases with xO2. The sensitivity is that when xO2 is dropped from
21% to 16.8% (corresponding to 0 to 20% EGR dilution), the threshold increases modestly, by approximately 0.05 points. The increase in the threshold (easier to form soot) in the premixed flame results with dilution is consistent with observations in the literature [20]. The soot formation is a competition between oxidation (mainly by OH) and formation by pyrolysis of the precursors [21]. When temperature increases, the oxidation overpowers the formation, and soot formation decreases (harder to form soot). The reverse is true when temperature decreases with dilution.
Figure 13. Rich threshold for PN rise for premixed gasoline and nitrogen-diluted-air flame in SI engine as a function of the oxygen mole fraction in the diluted air. Engine at 1200 rpm.
Particulate formation from GDI
The results so far suggest that the particles from non-fuel sources and from the flame of well-mixed stoichiometric mixtures do not significantly contribute to the accumulation mode PN emissions. To assess the injected liquid fuel portion which is most responsible to the PN emissions, the engine is operated in a dual fuel mode: a portion of the fuel is delivered by GDI as liquid gasoline; the remaining fuel (to make = 1) is supplied as premixed methane-air. The liquid portion of the fuel is varied from 1 (all gasoline) to 0 (all methane). The minimum amount of liquid fuel that could be injected is limited by the smallest fuel pulse width (400 s) for repeatable injection. The SOI is at the timing which would result in the lowest PN emission when all the fuel is delivered by GDI.
The results of the dual fuel experiments are shown in Fig. 14 for the engine operating at 1200 rpm. For each NIMEP, the SOI for the GDI is set to produce the minimum PN when the fuel is all liquid gasoline. The PN values do not increase substantially until the liquid fuel fraction is 0.8 or beyond. The observation implies that if all the fuel is introduced by GDI, only a small fraction (~20%) is responsible for PN emission.
It is also observed in Fig. 14 that the liquid-fuel-fraction transition point to higher PN does not change appreciably (at liquid fraction = 0.9) for NIMEP from 2 to 6 bar. The transition point is earlier (at liquid fraction = 0.8) for NIMEP at 8 bar. At the higher load, more fuel is injected; so more wall fuel film is expected. However, this effect is counter-acted by a hotter cylinder wall temperature and by a higher charge motion Reynolds number; both factors enhance fuel evaporation and mixing. Therefore the transition point is only moderately sensitive to load.
Figure 14. Accumulation mode PN as a function of the fraction of fuel delivered by GDI; the balance of the fuel is via premixed methane-air mixture. Engine operating at 1200 rpm, =1. SOI of GDI set at timing that would produce the lowest PN when liquid fuel fraction =1.
At a higher engine speed (1800 rpm), because of the better mixing due to a faster charge motion, PN only increases moderately with the liquid-fuel-fraction. There is no abrupt transition to a high PN value; see Fig. 15.
Figure 15. Accumulation mode PN as a function of the fraction of fuel delivered by GDI; the balance of the fuel is via premixed methane-air mixture. Engine operating at 1800 rpm, =1. SOI of GDI set at timing that would produce the lowest PN when liquid fuel fraction =1.
Page 7 of 9
Since the amount of wall fuel film and thus PN emissions depend on the SOI timing (see Fig. 5), the GDI SOI in the dual fuel experiment is varied. The load is chosen at 1200 rpm, 8 bar NIMEP to maximize the amount of liquid fuel injected. The results are shown in Fig. 17. At each SOI timing, there is a liquid-fuel-fraction beyond which the PN transitions from a low to a high value.
The difference between the full liquid fuel amount and the liquid fuel injected at the transition point may be interpreted as the amount of liquid fuel most responsible for particulate formation. In Fig. 17, the PN observed with all liquid fuel (i.e. the y-values at liquid-fuel-fraction =1 in Fig. 16) is plotted versus the liquid-fuel-fraction of liquid fuel most responsible for particulate formation (i.e. 1 – transition liquid-fuel-fraction for each curve in Fig. 16). It is observed that the PN values increases very rapidly (exponentially) with the fraction of liquid fuel most responsible for particulate formation.
Figure 16. Accumulation mode PN as a function of the fraction of fuel delivered by GDI; the balance of the fuel is via premixed methane-air mixture. Engine operating at 1200 rpm, =1, NIMEP=8bar; various SOI for the GDI.
Figure 17. PN from all liquid fuel GDI versus the liquid fraction most responsible for particulate formation. See text for explanation of x-axis.
Effect of dilution on particle formation from
liquid fuel film
An important mechanism for particulate formation is the pyrolysis of the vapor plume from the surface liquid fuel film [16]. (Under normal engine operating condition, the burned gas surrounding the vapor plume does not have sufficient oxygen to sustain a diffusion
flame.) The heat source for pyrolysis is the burned gas. Since the pyrolysis process is temperature dependent, it is of interest to examine the effect of burned gas temperature on such particulate formation process.
The engine is run with a premixed- stoichiometric methane air mixture which is diluted by nitrogen to change the burned gas temperature. A small amount of gasoline is injected late in the compression process as a source of particulate production. The amount of injected fuel is limited by the minimum fuel pulse width (400 s) for repeatable operation. The injection pressure is lowered (to 30 bar) to reduce the injected fuel amount and to increase the drop size to lower in-flight evaporation. Nevertheless, the amount injected fuel is still quite significant (13 to 20% of total fuel). Then the exhaust < 1 (in the range of 0.86 to 0.94) because of the extra introduced fuel. The SOI is fixed at 40 CAD BTDC which is the latest time that the injection would not interfere with the spark. Most of the fuel lands on the piston as liquid film.
The results are shown in Fig. 18. The experiment is not tidy because the local equivalence ratio at where the flame arrives at the vapor plume is modified by the diffusing fuel vapor; then the burned gas temperature is not well defined. Nevertheless, PN decreases with increase of dilution. This observation is consistent with the decrease of soot formation with lower temperature in the pyrolysis process [22]. (Note that this trend is opposite to the trend in premixed flame since the competing oxidation process is absent.)
Figure 18. PN from fuel film introduced on piston when the burned gas temperature is changed by dilution. X-axis is the oxygen mole fraction in the diluted air.
Summary/Conclusions
The sources of particulate emissions from GDI engines have been systematically assessed through a series of experiments using premixed mixtures of methane/air, pre-vaporized gasoline/air, and a charge prepared with premixed methane/air plus gasoline direct injection. The engine operating points of interest are those of cold fast idle and those associated with the first acceleration in the US FTP. The following conclusions on the accumulation mode particulate emissions may be drawn.
1. The non-fuel emission sources do not produce significant PN (relative to the GDI PN values).
2. The flame in a stoichiometric pre-vaporized, premixed gasoline/air mixture does not produce significant PN.
3. For a rich premixed gasoline/air flame, there is a rich threshold (at ~ 0.7 to 0.8) beyond which there is significant PN emission. The threshold does not correlate with engine speed or load. However, the threshold increases modestly (to a leaner value, i.e. favoring particulate formation) with dilution. The result is consistent with the temperature dependence of soot formation in premixed flames.
4. At the optimal SOI (which would produce the minimum PN), only 10-20% of the injected fuel is mostly responsible for particulate formation. The latter value increases when SOI is changed from the optimum value. The PN values increase rapidly (exponentially) with the fraction of fuel responsible for particulate formation.
5. For particulate formation via pyrolysis of the fuel in the vapor plume derived from wall fuel films, the PN values decreases with dilution of the main charge. The observation is consistent with the temperature dependence of particulate formation by pyrolysis.
It is noted that the above conclusions have been drawn from static test results. In a transient test such as in the FTP cycles, the combustion chamber temperature, which impacts the fuel film evaporation, will be in transient responding to the change of load and speed. Therefore, direct comparison of transient PN emissions with those at steady state engine tests under the same operating point would not be meaningful. However, the general observations obtained from the steady state test – the non-fuel sources are insignificant; the premixed mixture does not produce significant PN unless the local is richer than approximately 0.8; and only a small amount of the injected fuel contributes to the PN emission – should still hold.
References
1. Zhao, F., Lai, M. C., and Harrington, D. L., “Automotive Spark-Ignited Direct Injection Gasoline Engines,” Progress in Energy and Combustion Science, 25 (5):437–562, 1999.
2. EPA and NHTSA. Final rulemaking for 2017–2025 light-duty vehicle greenhouse gas emission standards and corporate average fuel economy standards. EPA/NHTSA Report, No. EPA-420-R-12-901, 28 August 2012.
3. Davis, R., Mandrusiak, G., and Landenfeld, T., “Development of the Combustion System for General Motors' 3.6L DOHC 4V V6 Engine with Direct Injection,” SAE Int. J. Engines 1(1):85-100, 2008, doi:10.4271/2008-01-0132.
4. Bandel, W., Fraidl, G., Kapus, P., Sikinger, H. et al., "The Turbocharged GDI Engine: Boosted Synergies for High Fuel Economy Plus Ultra-low Emission," SAE 2006-01-1266, 2006, doi:10.4271/2006-01-1266.
5. Whitaker, P., Kapus, P., Ogris, M., and Hollerer, P., “Measures to Reduce Particulate Emissions from Gasoline DI engines,” SAE Int. J. Engines 4(1):1498-1512, 2011, doi:10.4271/2011-01-1219.
6. Sabathil, D., Koenigstein, A., Schaffner, P., Fritzsche, J. et al., “The Influence of DISI Engine Operating Parameters on Particle Number Emissions,” SAE Technical Paper 2011-01-0143, 2011, doi:10.4271/2011-01-0143.
7. Piock, W., Hoffmann, G., Berndorfer, A., Salemi, P. et al., “Strategies Towards Meeting Future Particulate Matter Emission Requirements in Homogeneous Gasoline Direct Injection Engines,” SAE Int. J. Engines 4(1):1455-1468, 2011, doi:10.4271/2011-01-1212.
8. Rodriguez, J.F., Cheng, W.K., “Cycle-by-Cycle Analysis of Cold Crank-Start in a GDI Engine,” SAE Paper 2016-01-0824, 2016.
9. Shin, Y., Cheng, W.K., Heywood, J.B., “Liquid Gasoline Behavior in the Engine Cylinder of a SI Engine,” SAE Paper 941872, 1994.
10. Murphy, D. M., “Something in the air,” Science, 307 (5717): 1888–1890, 2005.
11. Kaiser, J., “Mounting Evidence Indicts Fine-Particle Pollution,” Science, 307 (5717):1858–1861, 2005.
12. Gunter, O, “Toxicology of Ultrafine Particles: In vivo Studies,” Phil. Trans. of the Royal Soc. of London, Series A, Math. Phys. and Eng. Sc., 358 (1775): 2719–2740, 2000.
13. Commission Regulation (EU) No 459/2012.
14. Giechaskiel, B., Mamakos, A., Andersson, A.D., et al, “Measurement of Automotive Nonvolatile Particle Number Emissions within the European Legislative Framework: A Review,” Aerosol Sc. and Tech., 46(7):719–749, 2012. 15. Kittelson, D. B., “Engines and Nanoparticles, a Review,”
Journal of Aerosol Science, 29(5):575–588, 1998. 16. Ketterer, J. and Cheng, W., "On the Nature of Particulate
Emissions from DISI Engines at Cold-Fast-Idle," SAE Int. J. Engines 7(2):2014, doi:10.4271/2014-01-1368.
17. Cambustion Limited, fast-response particle size analyzer;
http://www.cambustion.com/products/dms500/engine. 18. Namazian, M., and Heywood, J.B., “Flow in the
Piston-Cylinder-Ring Crevices of a Spark-Ignition Engine: Effect on Hydrocarbon Emissions, Efficiency and Power,” SAE Paper 820088, 1988.
19. Hageman, M.D., Sakai, S.S., and Rothamer, D.A.,
“Determination of soot onset and background particulate levels in a spark-ignition engine.” Proceedings of the Combustion Institute, 35(3):2949–2956, 2015.
20. Takahashi, F., Glassman, I, “Sooting Correlations for Premixed Flames,” Comb. Sc. & Tech., 37, 1-19, 1994.
21. Millikan, R.C., “Non-equilibrium soot formation in premixed flames,” J. Phys. Chem.,66, 794, 1962.
22. Tesner, P.A., Shurupov, S.V., “Some Physico-Chemical Parameters of Soot Formation During Pyrolysis of
Hydrocarbons,” Comb. Sci. and Tech., 105, pp. 147-161, 1995.
Contact Information
Changhoon Oh; ch_oh@mit.edu
Wai Cheng; wkcheng@mit.edu
Acknowledgments
This work was supported by the Consortium for Engine and Fuels Research. The membership companies are BorgWarner, FCA, Ford and GM. We would also like to acknowledge the inputs from David Roth of BorgWarner, Kevin Freeman of FCA, Tom Leone of Ford, Rick Davis and Justin Ketterer of GM.
Definitions/Abbreviations
ATDC After top dead center
ABDC After bottom dead center
BTDC Before top dead center
Dp Particle diameter
EGR Exhaust gas recirculation
FTP Federal test procedure
Page 9 of 9
MAP Manifold absolute pressure
Naccum Accumulation mode number density
Nnucl Nucleation mode number density
NIMEP Net indicated mean effective pressure
PFI Port fuel injection
PM Particulate matter
PMP Particle measurement protocol
PN Particle number density
SOI Start of injection Air equivalence ratio
Appendix
PN emissions from non-stoichiometric premixed gasoline-air at different engine speeds
The accumulation mode PN emissions as a function of are shown in Fig. A1 as a function of at different engine speeds. The y-axis values are normalized by the PN value at = 1.