HAL Id: hal-00296450
https://hal.archives-ouvertes.fr/hal-00296450
Submitted on 20 Feb 2008
HAL is a multi-disciplinary open access
archive for the deposit and dissemination of
sci-entific research documents, whether they are
pub-lished or not. The documents may come from
teaching and research institutions in France or
abroad, or from public or private research centers.
L’archive ouverte pluridisciplinaire HAL, est
destinée au dépôt et à la diffusion de documents
scientifiques de niveau recherche, publiés ou non,
émanant des établissements d’enseignement et de
recherche français ou étrangers, des laboratoires
publics ou privés.
Intercomparison of ILAS-II version 1.4 and version 2
target parameters with MIPAS-Envisat measurements
A. Griesfeller, T. von Clarmann, J. Griesfeller, M. Höpfner, M. Milz, H.
Nakajima, T. Steck, T. Sugita, T. Tanaka, T. Yokota
To cite this version:
A. Griesfeller, T. von Clarmann, J. Griesfeller, M. Höpfner, M. Milz, et al.. Intercomparison of
ILAS-II version 1.4 and version 2 target parameters with MIPAS-Envisat measurements. Atmospheric
Chemistry and Physics, European Geosciences Union, 2008, 8 (4), pp.825-843. �hal-00296450�
www.atmos-chem-phys.net/8/825/2008/
© Author(s) 2008. This work is distributed under the Creative Commons Attribution 3.0 License.
Chemistry
and Physics
Intercomparison of ILAS-II version 1.4 and version 2 target
parameters with MIPAS-Envisat measurements
A. Griesfeller1,*, T. von Clarmann2, J. Griesfeller1,**, M. H¨opfner2, M. Milz2,***, H. Nakajima1, T. Steck2, T. Sugita1, T. Tanaka1, and T. Yokota1
1National Institute for Environmental Studies (NIES), Tsukuba, Japan
2Inst. f¨ur Meteorologie und Klimaforschung (IMK), Forschungszentrum Karlsruhe und Univ. Karlsruhe, Karlsruhe, Germany *now at: Service d’A´eronomie, CNRS, Verri`eres-le-Buisson, France
**now at: Laboratoire des Sciences du Climat et de l’Environnement CEA/CNRS/UVSQ-IPSL, Gif-sur-Yvette, France **now at: Institutionen f¨or Rymdvetenskap, Lule˚a Tekniska Universitet, Kiruna, Sweden
Received: 21 May 2007 – Published in Atmos. Chem. Phys. Discuss.: 2 July 2007 Revised: 14 December 2007 – Accepted: 18 January 2008 – Published: 20 February 2008
Abstract. This paper assesses the mean differences between
the two ILAS-II data versions (1.4 and 2) by comparing them with MIPAS measurements made between May and October 2003. For comparison with ILAS-II results, MIPAS data pro-cessed at the Institut f¨ur Meteorologie und Klimaforschung, Karlsruhe, Germany (IMK) in cooperation with the Insti-tuto de Astrof´ısica de Andaluc´ıa (IAA) in Granada, Spain, were used. The coincidence criteria of ±300 km in space and ±12 h in time for H2O, N2O, and CH4 and the coin-cidence criteria of ±300 km in space and ±6 h in time for ClONO2, O3, and HNO3were used. The ILAS-II data were separated into sunrise (= Northern Hemisphere) and sunset (= Southern Hemisphere). For the sunrise data, a clear im-provement from version 1.4 to version 2 was observed for H2O, CH4, ClONO2, and O3. In particular, the ILAS-II ver-sion 1.4 mixing ratios of H2O and CH4were unrealistically small, and those of ClONO2above altitudes of 30 km unreal-istically large. For N2O and HNO3, there were no large dif-ferences between the two versions. Contrary to the Northern Hemisphere, where some exceptional profiles deviated sig-nificantly from known climatology, no such outlying profiles were found in the Southern Hemisphere for both versions. Generally, the ILAS-II version 2 data were in better agree-ment with the MIPAS data than the version 1.4, and are rec-ommended for quantitative analysis in the stratosphere. For H2O data in the Southern Hemisphere, further data quality evaluation is necessary.
Correspondence to: T. Sugita
1 Introduction
Water vapor (H2O), nitrous oxide (N2O), methane (CH4), ozone (O3), nitric acid (HNO3), and chlorine nitrate (ClONO2) are trace species that play an important role in global warming, greenhouse effect, and ozone-depletion pro-cesses in the lower stratosphere. These trace gases have been observed in the high latitudes and on a global scale in 2003 respectively by two satellite borne instruments, the Im-proved Limb Atmospheric Spectrometer-II (ILAS-II) (Naka-jima et al., 2006a) and the Michelson Interferometer for Pas-sive Atmospheric Sounding (MIPAS) (Fischer et al., 2007). ILAS-II was designed to monitor vertical profiles of ozone and related minor species to study the ozone layer (Nakajima et al., 2006a). The first public release of the data was ver-sion 1.4 (V1.4), including O3, HNO3, N2O, and CH4(Ejiri et al., 2006; Irie et al., 2006; Sugita et al., 2006; Wetzel et al., 2006). The validation studies showed that there were neg-ative biases of the H2O, CH4, and O3 data in the Northern Hemisphere (NH) measurements, although no major biases were found in the Southern Hemisphere (SH) measurements. The H2O data in the NH especially showed in some excep-tional cases profiles that deviate from known climatology, thus they are not open to the public. In order to consider this problem, we have developed a new retrieval algorithm, version 2 (V2). This paper assesses the mean differences be-tween the two ILAS-II data versions (1.4 and 2) by compar-ing them with MIPAS measurements made between May and October 2003. In Sect. 2, we report the instrumental details of ILAS-II and MIPAS that are necessary to understand the intercomparison. In Sect. 3, we present the vertical profiles derived from the data of ILAS-II and MIPAS between May and October 2003 on a monthly basis. Hemispheric differ-ences are investigated in detail, and clear improvements in the ILAS-II V2 data are shown in Sect. 4. We conclude the
2 Measurements and data analysis
2.1 ILAS-II
The ILAS-II solar occultation instrument was developed un-der responsibility of the Ministry of the Environment (MOE) of Japan to succeed the ILAS. It was launched in Decem-ber 2002 on board the Advanced Earth Observing Satellite-II (ADEOS-Satellite-II) spacecraft of the Japan Aerospace Explo-ration Agency (JAXA) (Nakajima et al., 2006a) and oper-ated during its sun-synchronous polar orbit at an inclination angle of 98.7◦ and a height of 802.9 km. Measurements were made approximately 14 times a day in each hemisphere from January to October 2003. The instantaneous field of view (IFOV) for the infrared (IR) spectrometer at the tangent point was 1.0 km in the vertical and 13.0 km in the hori-zontal. ILAS-II included four observation channels. Three of them used the infrared region (IR: 850–1610 cm−1, MIR: 1754–3333 cm−1, and 778–782 cm−1), and one the visible (VIS: 12 755–13 280 cm−1). ILAS-II used a solar occul-tation technique from which vertical profiles of several at-mospheric constituents can be retrieved. This includes: O3, HNO3, NO2, N2O, CH4, H2O, ClONO2, N2O5, CFC-11, CFC-12, and aerosol extinction coefficients. Volume mix-ing ratio (VMR) profiles of atmospheric constituents are de-rived with an onion-peeling retrieval method (Yokota et al., 2002), with a retrieval vertical grid of 1 km. Vertical res-olutions were 1.3–2.9 km at tangent heights of 15–55 km (Nakajima et al., 2006a). The simultaneous retrieval of the species presented below was made using all of the 44 spec-tral elements of the IR spectrometer. The first public release of the data was V1.4, including O3, HNO3, N2O, and CH4 (Ejiri et al., 2006; Irie et al., 2006; Sugita et al., 2006; Wet-zel et al., 2006). As mentioned in Sect. 1, the validation studies of V1.4 data showed several problems, especially in the NH data. Artefacts in the NH measurements are due to a degradation of output signals caused by a deformation of entrance slits of the instrument (Nakajima et al., 2006a). To overcome the difficulty presented by the ILAS-II hard-ware issues, a new retrieval algorithm, V2, was developed including a model for correcting the degraded transmittance, a more refined altitude registration method, and other minor revisions. The most important change was the inclusion of transmittance correction for the NH data (it was not included for the SH, as described in the appendix). This and other differences are described in Appendix A. It should be noted that occultation events occurred in the NH and in the SH as observed by satellite sunrise and sunset measurements, re-spectively. To examine how the V2 data improved from the V1.4 data, we compared the ILAS-II data with measurements from MIPAS on board Envisat that are already validated, in the process of validation, or were at least compared to other measurements.
2.2 MIPAS
MIPAS, which was developed at the European Space Agency (ESA), is one of the atmospheric sounding instruments on board Envisat, launched in March 2002 (Fischer et al., 2007). It is an infrared spectrometer working in the range between 685 cm−1and 2410 cm−1(15 µm and 4 µm) with a spectral resolution of 0.035 cm−1(unapodized) in five spectral bands, which allow the retrieval of vertical profiles of numerous at-mospheric constituents, including: CH4, ClO, ClONO2, CO, CFC-11, CFC-12, H2O, HNO3, HNO4, HOCl, N2O5, N2O, NO2, NO, O3, and other trace gases, covering an altitude range from 6 to 68 km. The orbit is sun-synchronous at 800 km altitude with an inclination of 98.55◦, performing 14.4 orbits per day. The field of view is 30 km in the hor-izontal and 3 km in the vertical at the tangent points. The retrieval vertical grid was 1 km, which is identical to the ILAS-II. While the operational ESA data are processed with a code described by Ridolfi et al. (2000), we used data from a science-oriented data processor, developed at IMK in coop-eration with IAA. The data used for comparison are based on IMK spectra version V3O and are based on calibrated radi-ance spectra generated by offline level-1 re-processing (ESA version IPF 4.61/4.62). The scientific data processor (von Clarmann et al., 2003a,b; Funke et al., 2001) has been de-veloped and is operated by the IMK, Karlsruhe, Germany, in cooperation with the IAA in Granada, Spain, and uses the Karlsruhe Optimized and Precise Radiative transfer Algo-rithm (KOPRA) as a forward model for the retrieval (H¨opfner et al., 1998; Stiller et al., 1998; Stiller, 2000). The MIPAS-IMK data have been chosen instead of the ESA data, because the ESA data do not cover all species considered in our in-tercomparison, particularly ClONO2is missing in the ESA data set, the IMK data often cover a wider altitude range, often are less oscillatory, and use a more rigorous cloud re-jection threshold. The spectroscopic database (Flaud et al., 2003) used for IMK MIPAS retrievals is largely identical to HITRAN 2004. MIPAS took measurements almost continu-ously from July 2002 until the end of March 2004. Instabil-ities in the interferometer driver velocity led to a temporary interruption of operational measurements at that point, but it was restarted with a different observation scheme in early 2005.
The retrieval strategies and quality assessment of the MI-PAS data have already been published, for example, H2O (Milz et al., 2005), O3 (Steck et al., 2007; Bracher et al., 2005; Verronen et al., 2005; Wang et al., 2005), N2O and CH4 (Bracher et al., 2005; Glatthor et al., 2005), HNO3 (Mengistu Tsidu et al., 2005; Wang et al., 2007), and ClONO2(H¨opfner et al., 2004, 2007). However, these vali-dation results are also based partly on different spectra ver-sions, and retrieval baseline versions (e.g. different wave-length bands, regularization), and not only on the spectra generated by offline level-1 re-processing presented here. In contrast to the large spectral range in which the ILAS-II
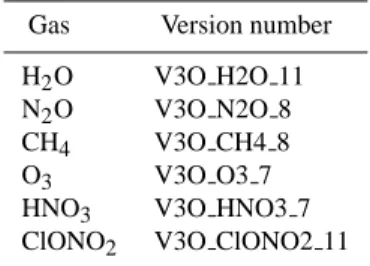
Table 1. Version number of the scientific processor of MIPAS.
Gas Version number H2O V3O H2O 11
N2O V3O N2O 8
CH4 V3O CH4 8
O3 V3O O3 7 HNO3 V3O HNO3 7
ClONO2 V3O ClONO2 11
measurements were performed, the MIPAS retrievals use narrow wavelength bands called microwindows. For all gases the same spectroscopic dataset was used for MIPAS and for ILAS-II V2 data, so the spectroscopic error is not ex-pected to contribute to the differences between ILAS-II and MIPAS results.
Table 1 shows the version number of the scientific pro-cessor of MIPAS for each gas. The MIPAS version iden-tifiers are identical for Northern and Southern Hemispheres for each gas.
3 Comparison
3.1 Coincidence criteria
Using the coincidence criteria of ±300 km in space and
±12 h in time for the long-lived gases H2O, N2O, and CH4 and the coincidence criteria of ±300 km in space and ±6 h in time for ClONO2, O3, and HNO3, different numbers of coin-cidences were found for these gases as shown in Tables 2 and 3. These coincidence criteria were approximately the same as used for MIPAS validation studies (e.g., H¨opfner et al., 2007; Steck et al., 2007; Wang et al., 2007) and they were chosen to provide a sufficiently large number of coincidences to obtain reasonably reliable statistics. The number of coin-cidences is different for each gas because MIPAS data from the scientific data processor were not always available for each gas. Besides the number of coincidences, the average distances in space and time for the northern and Southern Hemispheres are also listed in Tables 2 and 3, respectively.
Coincidences in both of the hemispheres were found be-tween May and October 2003. According measurements were performed between 54.8◦N and 71.0◦N (ILAS-II) and 55.7◦N and 72.4◦N (MIPAS), and between 68.5◦S and 87.8◦S (ILAS-II) and 67.7◦S and 86.6◦S (MIPAS). The ex-istence of polar vortex and hence the presence of polar strato-spheric clouds (PSCs) was not considered in the NH. In the SH, on the other hand, the coincidences were separated into those from inside and those from outside the polar vortex us-ing the criterion of Nash et al. (1996) at an equivalent latitude
were outside or at the edge of the polar vortex. All the other coincidences were clearly inside.
3.2 Monthly averaged profiles
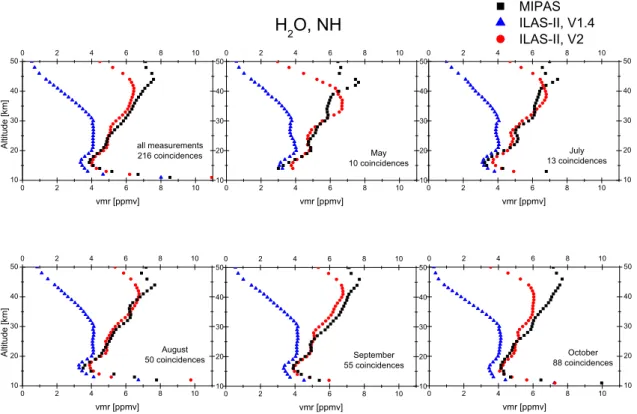
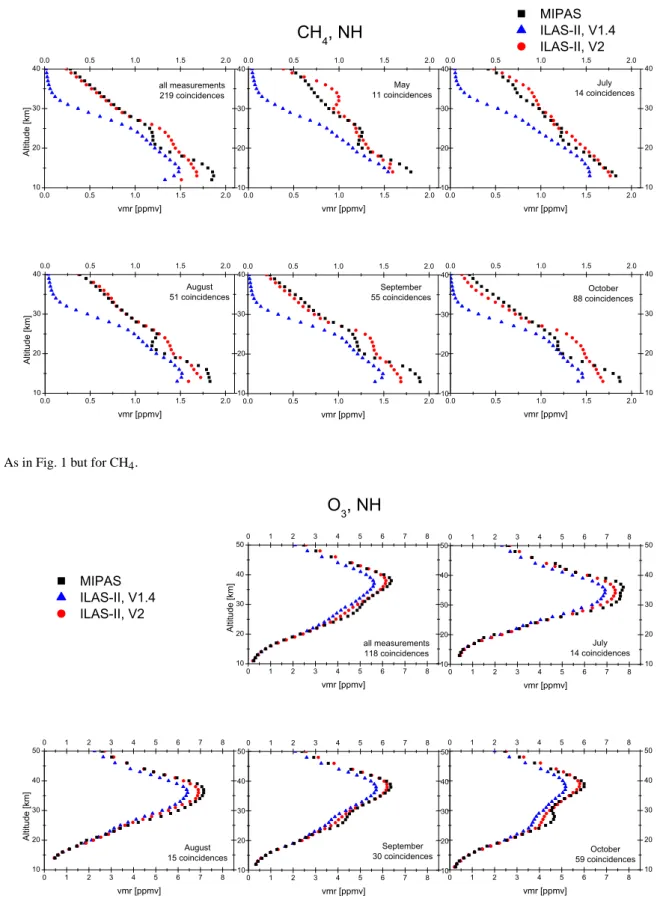
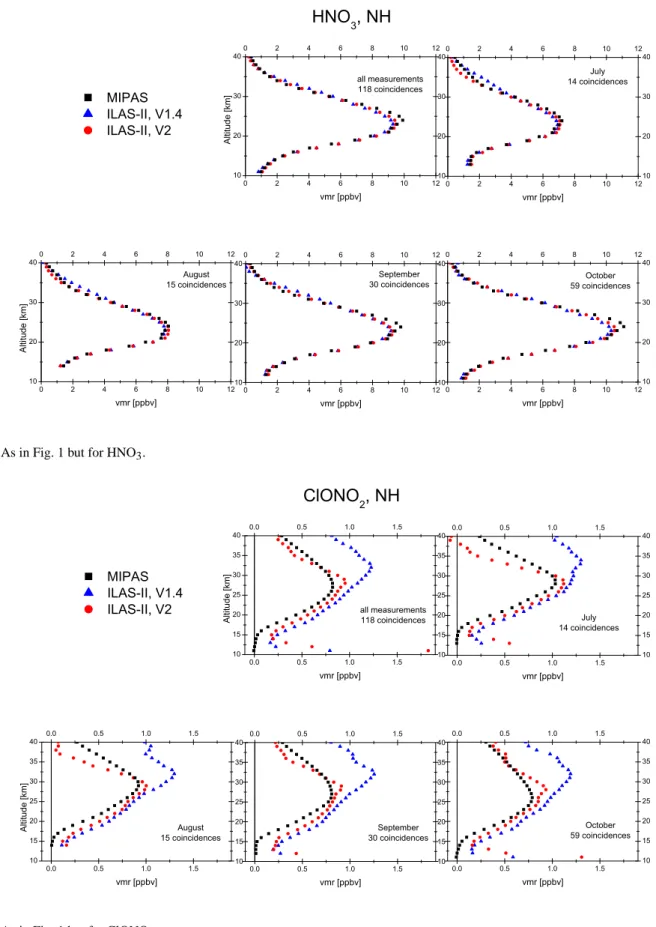
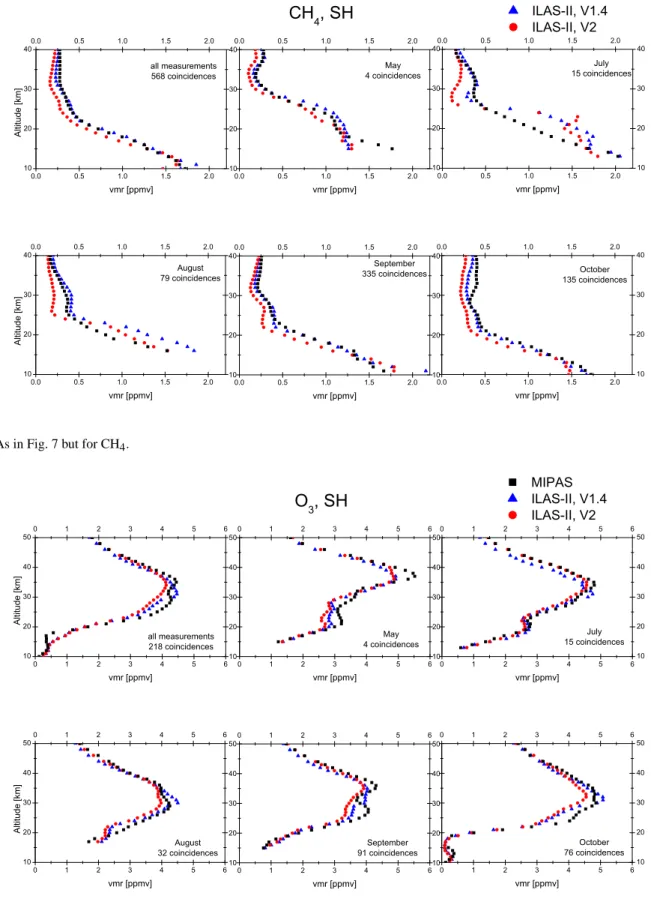
Figures 1–6 show monthly averaged profiles of H2O, N2O, CH4, O3, HNO3, and ClONO2 in the NH, and Figs. 7–12 show those in the SH. The ILAS-II V1.4 and V2 data were compared to the MIPAS data as a global validation source. Hemispheric averaged profiles were also depicted for each figure. The number of coincidences is shown in each panel. Most of the coincidences were found from August to October in the NH, and in September and October in the SH.
For H2O, CH4, and ClONO2in the NH, the comparison between MIPAS and both versions of ILAS-II suggest a clear improvement in the later version, owing to the inclusion of transmittance corrections. Unlike the ILAS-II V1.4 NH data, there were no large differences between ILAS-II V1.4 and V2 data in the SH, because the ILAS-II V1.4 SH data did not have the difficulty as was found in the NH. Detailed discus-sion on this point will be given in Sect. 4.
Some distinctive features are briefly mentioned. In Fig. 7, it can be seen that there was a clear maximum peak of the MIPAS H2O mixing ratios around 30–35 km in the SH in May, subsiding in July to 25–30 km, which did also exist in the ILAS-II data, with a small bias for ILAS-II V1.4 and a larger bias for V2. Below 20 km, both instruments observed dehydrated air inside the polar vortex with very small VMR values of about 1–1.5 ppmv between August and October. Note that the number of coincidences for May (4) and July (15) are small compared to the other months and thus the shape of the mean profile may be dominated by an individual profile. The reason for the differences between MIPAS and ILAS-II might be the different retrieval approaches. While onion-peeling is used for ILAS-II a global-fit approach is used for MIPAS, which uses a smoothing constraint related to the shape of an a priori profile.
In SH October, clear ozone hole values (≤0.5 ppmv) be-low 20 km (Fig. 10) can be seen. HNO3 had a bi-modal altitude distribution seen by both instruments in SH July (Fig. 11). The large values in high altitudes in this bi-modal distribution were due to a high-altitude enhancement of NOx, which was also seen by MIPAS (Stiller et al., 2005). The low values in the ILAS-II data for low altitudes could be the re-sult of denitrification.
3.3 Hemispheric averages and differences between ILAS-II and MIPAS
Figures. 13–18 show the mean profiles of H2O, N2O, CH4, O3, HNO3, and ClONO2 for all coincidences in the NH, and Figs. 19–25 show those in the SH except for O3 and HNO3. In the following we use a terminology, as suggested e.g. by von Clarmann (2006), who propose to first
deter-Table 2. Coincidences of ILAS-II and MIPAS measurements in the NH. Different numbers of coincidences for the different gases are mainly
caused by different coincidence criteria for inert gases on the one hand and reactive species on the other hand. Minor differences are due to occasional failure of convergence in some of the MIPAS retrievals.
Gas # of Average Average Average Average coinc. 1space 1lat. [◦] 1long. [◦] 1time
[km] [hours] H2O 216 168 –0.27 –1.37 6:11 ±84 ±1.04 ±3.05 ±2:24 N2O, CH4 219 168 –0.27 –1.35 6:11 ±83 ±1.04 ±3.04 ±2:26 O3, HNO3, ClONO2 118 167 –0.29 –1.92 4:21 ±86 ±1.05 ±2.61 ±1:21
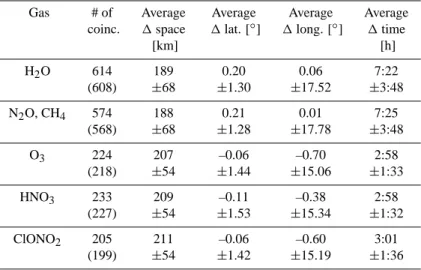
Table 3. Same as in 2 but for the SH. The number in brackets indicate the number of coincidences inside the polar vortex.
Gas # of Average Average Average Average coinc. 1space 1lat. [◦] 1long. [◦] 1time
[km] [h] H2O 614 189 0.20 0.06 7:22 (608) ±68 ±1.30 ±17.52 ±3:48 N2O, CH4 574 188 0.21 0.01 7:25 (568) ±68 ±1.28 ±17.78 ±3:48 O3 224 207 –0.06 –0.70 2:58 (218) ±54 ±1.44 ±15.06 ±1:33 HNO3 233 209 –0.11 –0.38 2:58 (227) ±54 ±1.53 ±15.34 ±1:32 ClONO2 205 211 –0.06 –0.60 3:01 (199) ±54 ±1.42 ±15.19 ±1:36
measurements, to assess its significance by means of its stan-dard error, and to use debiased measurements for subsequent precision validation. In our Figs. 13 to 25 the mean differ-ences (ILAS-II – MIPAS) along with their statistical uncer-tainties, according to Eqs. (30) and (31) in von Clarmann (2006) are included. Also, the percentage difference is ac-cording to Eqs. (39) and (40) in von Clarmann (2006).
For the SH O3 comparisons, data were separated in two periods; one is from May until September (Fig. 22), and the other is for October (Fig. 23) where a significant ozone de-pletion was seen in the lower stratosphere (a regular ozone hole condition). For the SH HNO3comparison, the July data were not considered in the analysis of differences because of the mesospheric NOx transport into the stratosphere, as mentioned earlier.
3.4 Tracer correlation and time series
To evaluate the ILAS-II versions, we also examine a tracer-tracer correlation. Figures 26 and 27 show correlations be-tween N2O and CH4in the NH and SH, respectively. A more compact correlation was found from V2 than from V1.4 in the NH, although an almost identical correlation was found in the SH.
Another way to evaluate them is to examine a time-series of species in different atmospheric conditions. Figure 28 shows an O3time-series at 24 km in the SH.
4 Discussion
4.1 Northern Hemisphere
Unrealistic small values of ILAS-II V1.4 H2O and CH4data (Figs. 13 and 15) above 20–25 km were due to a degradation
10 20 30 40 50 0 2 4 6 8 10 0 2 4 6 8 10 10 20 30 40 50 0 2 4 6 8 10 10 20 30 40 50 0 2 4 6 8 10 10 20 30 40 50 0 2 4 6 8 10 0 2 4 6 8 10 10 20 30 40 50 0 2 4 6 8 10 0 2 4 6 8 10 10 20 30 40 50 0 2 4 6 8 10 10 20 30 40 50 0 2 4 6 8 10 10 20 30 40 50 0 2 4 6 8 10 0 2 4 6 8 10 all measurements 216 coincidences vmr [ppmv] Al ti tu d e [ km] MIPAS ILAS-II, V1.4 ILAS-II, V2 July 13 coincidences vmr [ppmv] September 55 coincidences vmr [ppmv] August 50 coincidences vmr [ppmv] Al ti tu d e [ km]
H
2O, NH
October 88 coincidences vmr [ppmv] May 10 coincidences vmr [ppmv]Fig. 1. Comparison of the H2O measurements in the NH. The mean profiles of the MIPAS measurements are shown as black squares, the
mean profiles of the ILAS-II V1.4 data as blue triangles, and the mean profiles of the ILAS-II V2 data as red circles for each month in which we found coincidences. 10 20 30 40 50 0.0 0.1 0.2 0.3 0.0 0.1 0.2 0.3 10 20 30 40 50 0.0 0.1 0.2 0.3 10 20 30 40 50 0.0 0.1 0.2 0.3 10 20 30 40 50 0.0 0.1 0.2 0.3 0.0 0.1 0.2 0.3 10 20 30 40 50 0.0 0.1 0.2 0.3 0.0 0.1 0.2 0.3 10 20 30 40 50 0.0 0.1 0.2 0.3 10 20 30 40 50 0.0 0.1 0.2 0.3 10 20 30 40 50 0.0 0.1 0.2 0.3 0.0 0.1 0.2 0.3 all measurements 219 coincidences vmr [ppmv] Al ti tu d e [ km] MIPAS ILAS-II, V1.4 ILAS-II, V2 July 14 coincidences vmr [ppmv] September 55 coincidences vmr [ppmv] August 51 coincidences vmr [ppmv] Al ti tu d e [ km]
N
2O, NH
October 88 coincidences vmr [ppmv] May 11 coincidences vmr [ppmv]10 20 30 40 0.0 0.5 1.0 1.5 2.0 0.0 0.5 1.0 1.5 2.0 10 20 30 40 0.0 0.5 1.0 1.5 2.0 10 20 30 40 0.0 0.5 1.0 1.5 2.0 10 20 30 40 0.0 0.5 1.0 1.5 2.0 0.0 0.5 1.0 1.5 2.0 10 20 30 40 0.0 0.5 1.0 1.5 2.0 0.0 0.5 1.0 1.5 2.0 10 20 30 40 0.0 0.5 1.0 1.5 2.0 10 20 30 40 0.0 0.5 1.0 1.5 2.0 10 20 30 40 0.0 0.5 1.0 1.5 2.0 0.0 0.5 1.0 1.5 2.0 all measurements 219 coincidences vmr [ppmv] Al ti tu d e [ km] MIPAS ILAS-II, V1.4 ILAS-II, V2 July 14 coincidences vmr [ppmv] September 55 coincidences vmr [ppmv] August 51 coincidences vmr [ppmv] Al ti tu d e [ km]
CH
4, NH
October 88 coincidences vmr [ppmv] May 11 coincidences vmr [ppmv]Fig. 3. As in Fig. 1 but for CH4.
10 20 30 40 50 0 1 2 3 4 5 6 7 8 0 1 2 3 4 5 6 7 8 10 20 30 40 50 0 1 2 3 4 5 6 7 8 10 20 30 40 50 0 1 2 3 4 5 6 7 8 10 20 30 40 50 0 1 2 3 4 5 6 7 8 0 1 2 3 4 5 6 7 8 10 20 30 40 50 0 1 2 3 4 5 6 7 8 0 1 2 3 4 5 6 7 8 10 20 30 40 50 0 1 2 3 4 5 6 7 8 10 20 30 40 50 0 1 2 3 4 5 6 7 8 all measurements 118 coincidences vmr [ppmv] Al ti tu d e [ km] MIPAS ILAS-II, V1.4 ILAS-II, V2 July 14 coincidences vmr [ppmv] September 30 coincidences vmr [ppmv] August 15 coincidences vmr [ppmv] Al ti tu d e [ km]
O
3, NH
October 59 coincidences vmr [ppmv]10 20 30 40 0 2 4 6 8 10 12 0 2 4 6 8 10 12 10 20 30 40 0 2 4 6 8 10 12 10 20 30 40 0 2 4 6 8 10 12 10 20 30 40 0 2 4 6 8 10 12 0 2 4 6 8 10 12 10 20 30 40 0 2 4 6 8 10 12 0 2 4 6 8 10 12 10 20 30 40 0 2 4 6 8 10 12 10 20 30 40 0 2 4 6 8 10 12 all measurements 118 coincidences vmr [ppbv] Al ti tu d e [ km] MIPAS ILAS-II, V1.4 ILAS-II, V2 July 14 coincidences vmr [ppbv] September 30 coincidences vmr [ppbv] August 15 coincidences vmr [ppbv] Al ti tu d e [ km]
HNO
3, NH
October 59 coincidences vmr [ppbv]Fig. 5. As in Fig. 1 but for HNO3.
10 15 20 25 30 35 40 0.0 0.5 1.0 1.5 0.0 0.5 1.0 1.5 10 15 20 25 30 35 40 0.0 0.5 1.0 1.5 10 15 20 25 30 35 40 0.0 0.5 1.0 1.5 10 15 20 25 30 35 40 0.0 0.5 1.0 1.5 0.0 0.5 1.0 1.5 10 15 20 25 30 35 40 0.0 0.5 1.0 1.5 0.0 0.5 1.0 1.5 10 15 20 25 30 35 40 0.0 0.5 1.0 1.5 10 15 20 25 30 35 40 0.0 0.5 1.0 1.5 all measurements 118 coincidences vmr [ppbv] Al ti tu d e [ km] MIPAS ILAS-II, V1.4 ILAS-II, V2 July 14 coincidences vmr [ppbv] September 30 coincidences vmr [ppbv] August 15 coincidences vmr [ppbv] Al ti tu d e [ km]
ClONO
2, NH
October 59 coincidences vmr [ppbv]10 20 30 40 50 0 1 2 3 4 5 6 7 8 9 0 1 2 3 4 5 6 7 8 9 10 20 30 40 50 0 1 2 3 4 5 6 7 8 9 10 20 30 40 50 0 1 2 3 4 5 6 7 8 9 10 20 30 40 50 0 1 2 3 4 5 6 7 8 9 0 1 2 3 4 5 6 7 8 9 10 20 30 40 50 0 1 2 3 4 5 6 7 8 9 0 1 2 3 4 5 6 7 8 9 10 20 30 40 50 0 1 2 3 4 5 6 7 8 9 10 20 30 40 50 0 1 2 3 4 5 6 7 8 9 10 20 30 40 50 0 1 2 3 4 5 6 7 8 9 0 1 2 3 4 5 6 7 8 9 all measurements 608 coincidences vmr [ppmv] Al ti tu d e [ km] MIPAS ILAS-II, V1.4 ILAS-II, V2 July 15 coincidences vmr [ppmv] September 338 coincidences vmr [ppmv] August 80 coincidences vmr [ppmv] Al ti tu d e [ km]
H
2O, SH
October 171 coincidences vmr [ppmv] May 4 coincidences vmr [ppmv]Fig. 7. Comparison of the H2O measurements in the SH. The mean profiles of the MIPAS measurements are shown as black squares, the
mean profiles of the ILAS-II V1.4 data as blue triangles, and the mean profiles of the ILAS-II V2 data as red circles for each month in which we found coincidences. 10 20 30 40 0.0 0.1 0.2 0.3 0.0 0.1 0.2 0.3 10 20 30 40 0.0 0.1 0.2 0.3 10 20 30 40 0.0 0.1 0.2 0.3 10 20 30 40 0.0 0.1 0.2 0.3 0.0 0.1 0.2 0.3 10 20 30 40 0.0 0.1 0.2 0.3 0.0 0.1 0.2 0.3 10 20 30 40 0.0 0.1 0.2 0.3 10 20 30 40 0.0 0.1 0.2 0.3 10 20 30 40 0.0 0.1 0.2 0.3 0.0 0.1 0.2 0.3 all measurements 568 coincidences vmr [ppmv] Al ti tu d e [ km] MIPAS ILAS-II, V1.4 ILAS-II, V2 July 15 coincidences vmr [ppmv] September 335 coincidences vmr [ppmv] August 79 coincidences vmr [ppmv] Al ti tu d e [ km]
N
2O, SH
October 135 coincidences vmr [ppmv] May 4 coincidences vmr [ppmv]10 20 30 40 0.0 0.5 1.0 1.5 2.0 0.0 0.5 1.0 1.5 2.0 10 20 30 40 0.0 0.5 1.0 1.5 2.0 10 20 30 40 0.0 0.5 1.0 1.5 2.0 10 20 30 40 0.0 0.5 1.0 1.5 2.0 0.0 0.5 1.0 1.5 2.0 10 20 30 40 0.0 0.5 1.0 1.5 2.0 0.0 0.5 1.0 1.5 2.0 10 20 30 40 0.0 0.5 1.0 1.5 2.0 10 20 30 40 0.0 0.5 1.0 1.5 2.0 10 20 30 40 0.0 0.5 1.0 1.5 2.0 0.0 0.5 1.0 1.5 2.0 all measurements 568 coincidences vmr [ppmv] Al ti tu d e [ km] MIPAS ILAS-II, V1.4 ILAS-II, V2 July 15 coincidences vmr [ppmv] September 335 coincidences vmr [ppmv] August 79 coincidences vmr [ppmv] Al ti tu d e [ km]
CH
4, SH
October 135 coincidences vmr [ppmv] May 4 coincidences vmr [ppmv]Fig. 9. As in Fig. 7 but for CH4.
10 20 30 40 50 0 1 2 3 4 5 6 0 1 2 3 4 5 6 10 20 30 40 50 0 1 2 3 4 5 6 10 20 30 40 50 0 1 2 3 4 5 6 10 20 30 40 50 0 1 2 3 4 5 6 0 1 2 3 4 5 6 10 20 30 40 50 0 1 2 3 4 5 6 0 1 2 3 4 5 6 10 20 30 40 50 0 1 2 3 4 5 6 10 20 30 40 50 0 1 2 3 4 5 6 10 20 30 40 50 0 1 2 3 4 5 6 0 1 2 3 4 5 6 all measurements 218 coincidences vmr [ppmv] Al ti tu d e [ km] MIPAS ILAS-II, V1.4 ILAS-II, V2 July 15 coincidences vmr [ppmv] September 91 coincidences vmr [ppmv] August 32 coincidences vmr [ppmv] Al ti tu d e [ km]
O
3, SH
October 76 coincidences vmr [ppmv] May 4 coincidences vmr [ppmv]10 20 30 40 0 2 4 6 8 10 12 14 16 18 0 2 4 6 8 10 12 14 16 18 10 20 30 40 0 2 4 6 8 10 12 14 16 18 10 20 30 40 0 2 4 6 8 10 12 14 16 18 10 20 30 40 0 2 4 6 8 10 12 14 16 18 0 2 4 6 8 10 12 14 16 18 10 20 30 40 0 2 4 6 8 10 12 14 16 18 0 2 4 6 8 10 12 14 16 18 10 20 30 40 0 2 4 6 8 10 12 14 16 18 10 20 30 40 0 2 4 6 8 10 12 14 16 18 10 20 30 40 0 2 4 6 8 10 12 14 16 18 0 2 4 6 8 10 12 14 16 18 all measurements 227 coincidences vmr [ppbv] Al ti tu d e [ km] MIPAS ILAS-II, V1.4 ILAS-II, V2 July 15 coincidences vmr [ppbv] September 91 coincidences vmr [ppbv] August 32 coincidences vmr [ppbv] Al ti tu d e [ km]
HNO
3, SH
October 85 coincidences vmr [ppbv] May 4 coincidences vmr [ppbv]Fig. 11. As in Fig. 7 but for HNO3.
10 15 20 25 30 35 40 0.0 0.5 1.0 1.5 0.0 0.5 1.0 1.5 10 15 20 25 30 35 40 0.0 0.5 1.0 1.5 10 15 20 25 30 35 40 0.0 0.5 1.0 1.5 10 15 20 25 30 35 40 0.0 0.5 1.0 1.5 0.0 0.5 1.0 1.5 10 15 20 25 30 35 40 0.0 0.5 1.0 1.5 0.0 0.5 1.0 1.5 10 15 20 25 30 35 40 0.0 0.5 1.0 1.5 10 15 20 25 30 35 40 0.0 0.5 1.0 1.5 10 15 20 25 30 35 40 0.0 0.5 1.0 1.5 0.0 0.5 1.0 1.5 all measurements 199 coincidences vmr [ppbv] Al ti tu d e [ km] MIPAS ILAS-II, V1.4 ILAS-II, V2 July 15 coincidences vmr [ppbv] September 63 coincidences vmr [ppbv] August 32 coincidences vmr [ppbv] Al ti tu d e [ km]
ClONO
2, SH
October 85 coincidences vmr [ppbv] May 4 coincidences vmr [ppbv]10 20 30 40 50 0 2 4 6 8 10 0 2 4 6 8 10 -80-40 0 40 80 10 20 30 40 50 -80-40 0 40 80 -4 -2 0 2 4 -4 -2 0 2 4 H 2O, NH, 216 coincidences vmr [ppmv] Al ti tu d e [ km] MIPAS ILAS-II, V1.4 ILAS-II, V2 difference [%] difference [ppmv]
Fig. 13. Differences between ILAS-II and MIPAS measurements
of H2O in the NH. The mean profiles of all coincidences of the MI-PAS measurements are shown as black squares, the mean profiles of the ILAS-II V1.4 data as blue triangles, and the mean profiles of the ILAS-II V2 data as red circles. At the right-hand side the differ-ences in VMR and % along with the standard error of the mean dif-ference between ILAS-II V1.4 and MIPAS data are shown in blue, and between ILAS-II V2 and MIPAS data in red.
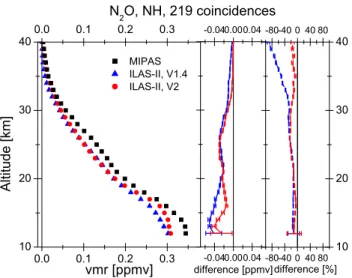
10 20 30 40 0.0 0.1 0.2 0.3 0.0 0.1 0.2 0.3 -80-40 0 40 80 10 20 30 40 -80-40 0 40 80 -0.040.000.04 -0.040.000.04 N2O, NH, 219 coincidences vmr [ppmv] Al ti tu d e [ km] MIPAS ILAS-II, V1.4 ILAS-II, V2 difference [%] difference [ppmv]
Fig. 14. As in Fig. 13 but for N2O.
of output signals caused by a deformation of entrance slits of the instrument (Nakajima et al., 2006a). Such results were reported by Ejiri et al. (2006) and Wetzel et al. (2006), in which the data were compared to the Halogen Occultation Experiment (HALOE) measurements or some balloon mea-surements (MIPAS-B2 and MkIV). Similarly, a negative bias for O3(Fig. 16) was also found around 40 km. Such a
re-10 20 30 40 0.0 0.5 1.0 1.5 2.0 0.0 0.5 1.0 1.5 2.0 -80 -40 0 40 10 20 30 40 -80 -40 0 40 -0.4 0.0 0.4 -0.4 0.0 0.4 CH4, NH, 219 coincidences vmr [ppmv] Al ti tu d e [ km] MIPAS ILAS-II, V1.4 ILAS-II, V2 difference [%] difference [ppmv]
Fig. 15. As in Fig. 13 but for CH4.
10 20 30 40 50 0 1 2 3 4 5 6 7 0 1 2 3 4 5 6 7 -20-10 0 10 20 10 20 30 40 50 -20-10 0 10 20 -1.0-0.50.0 0.5 1.0 -1.0-0.50.0 0.5 1.0 O3, NH, 118 coincidences vmr [ppmv] Al ti tu d e [ km] MIPAS ILAS-II, V1.4 ILAS-II, V2 difference [%] difference [ppmv]
Fig. 16. As in Fig. 13 but for O3.
around 40 km revealed a negative bias of ≈0.6 ppmv com-pared to some satellite occultation measurements. An inclu-sion of transmittance correction method developed for the satellite sunrise measurement mode into the ILAS-II V2 re-trieval algorithm successfully improved the ILAS-II V2 data of those species.
For H2O, up to 42 km there was good agreement between ILAS-II V2 and MIPAS data. At altitudes between 14 and 27 km and near 35 km the differences are within their stan-dard errors and thus are not significant. At higher altitudes, the values of the ILAS-II H2O data were still smaller than the MIPAS data. The largest differences were found at 50 km with 2.6 ppmv (37%). Following the discussion by von Clar-mann (2006), percentage differences were calculated as the
10 20 30 40 0 2 4 6 8 10 0 2 4 6 8 10 -50 0 50 10 20 30 40 -50 0 50 -0.8 0.0 0.8 -0.8 0.0 0.8 HNO 3, NH,118 coincidences vmr [ppbv] Al ti tu d e [ km] MIPAS ILAS-II, V1.4 ILAS-II, V2 difference [%] difference [ppbv]
Fig. 17. As in Fig. 13 but for HNO3.
10 20 30 40 0.0 0.5 1.0 1.5 0.0 0.5 1.0 1.5 -80-40 0 40 80 10 20 30 40 -80-40 0 40 80 -1 0 1 -1 0 1 ClONO2, NH, 118 coincidences vmr [ppbv] Al ti tu d e [ km] MIPAS ILAS-II, V1.4 ILAS-II, V2 difference [%] difference [ppbv]
Fig. 18. As in Fig. 13 but for ClONO2.
of individual percentage value. Since the impact of the sig-nal distortion seems to depend on the species and altitude (Ejiri et al., 2006; Nakajima et al., 2006a), the correction ap-plied to this ILAS-II V2 algorithm might not be sufficient for these altitudes. We do not recommend using the NH H2O data around 40 km and above even for V2. The MI-PAS H2O profiles have already been compared to other in-struments. Comparisons to satellite borne instruments as the HALOE or the Atmospheric Chemistry Experiment - Fourier Transform Spectrometer (ACE-FTS) (Bernath et al., 2005) showed good agreement as well as comparisons with bal-loon measurements (Milz et al. (2005), Milz, M.: Validation of MIPAS-IMK/IAA water vapour profiles, in preparation). Compared to HALOE, MIPAS had a positive bias of 5–10%, and compared to ACE-FTS, MIPAS had a negative bias of
10 20 30 40 50 0 1 2 3 4 5 6 7 8 9 0 1 2 3 4 5 6 7 8 9 -50 -25 0 25 10 20 30 40 50 -50 -25 0 25 -3 -2 -1 0 1 -3 -2 -1 0 1 H2O, SH, 608 coincidences vmr [ppmv] Al ti tu d e [ km] MIPAS ILAS-II, V1.4 ILAS-II, V2 difference [%] difference [ppmv]
Fig. 19. Differences between ILAS-II and MIPAS measurements
of H2O in the SH. The mean profiles of all coincidences of the
MI-PAS measurements are shown as black squares, the mean profiles of the ILAS-II V1.4 data as blue triangles, and the mean profiles of the ILAS-II V2 data as red circles. At the right-hand side the differ-ences in VMR and % along with the standard error of the mean dif-ference between ILAS-II V1.4 and MIPAS data are shown in blue, and between ILAS-II V2 and MIPAS data in red.
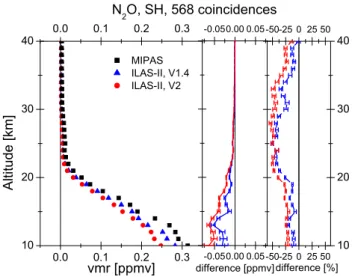
10 20 30 40 0.0 0.1 0.2 0.3 0.0 0.1 0.2 0.3 -50-25 0 25 50 10 20 30 40 -50-25 0 25 50 -0.050.00 0.05 -0.050.00 0.05 N 2O, SH, 568 coincidences vmr [ppmv] Al ti tu d e [ km] MIPAS ILAS-II, V1.4 ILAS-II, V2 difference [%] difference [ppmv]
Fig. 20. As in Fig. 19 but for N2O.
5% below ≈40 km, which was comparable to the differences found in this study.
For CH4, there was also good agreement between ILAS-II V2 and MIPAS data. The largest differences, with 0.2 ppmv (17%), were at 22 km. Below 25 km, the biases exceed two times their standard errors and thus are significant. At this al-titude range (20–24 km), ILAS-II had difficulty (apparently some high bias) in retrieving CH4profiles (Ejiri et al., 2006; Kanzawa et al., 2003). Although this is still an open question
10 20 30 40 0.0 0.5 1.0 1.5 2.0 0.0 0.5 1.0 1.5 2.0 -40-20 0 20 40 10 20 30 40 -40-20 0 20 40 -0.250.00 0.25 -0.250.00 0.25 CH 4, SH, 568 coincidences vmr [ppmv] Al ti tu d e [ km] MIPAS ILAS-II, V1.4 ILAS-II, V2 difference [%] difference [ppmv]
Fig. 21. As in Fig. 19 but for CH4.
10 20 30 40 50 0 1 2 3 4 5 0 1 2 3 4 5 -25 0 25 10 20 30 40 50 -25 0 25 -0.5 0.0 0.5 -0.5 0.0 0.5 O
3, SH, May to September, 142 coincidences
vmr [ppmv] Al ti tu d e [ km] MIPAS ILAS-II, V1.4 ILAS-II, V2 difference [%] difference [ppmv]
Fig. 22. As in Fig. 19 but for O3data from May to September.
in the ILAS-II CH4retrieval, this could contribute to the dif-ferent vertical structure seen in Fig. 15. In addition, the pos-itive bias of CH4is also apparent in the correlation between N2O and CH4(see Fig. 26). MIPAS CH4measurements have not yet been validated. A preliminary comparison with ACE-FTS data suggests that MIPAS CH4 mixing ratios may be biased high by approximately 10% below 40 km (personal communication, Markus Engelhardt, 2007), which is more recognizable in the SH comparison.
For O3 comparisons between ILAS-II V2 and MIPAS data, the differences were about 0.3 ppmv (8–10%) for nearly the whole height range. Although the mean differences be-tween ILAS-II V2 and MIPAS ozone results are small in ab-solute terms, they are significant above 23 km. MIPAS O3
10 20 30 40 50 0 1 2 3 4 5 0 1 2 3 4 5 -25 0 25 10 20 30 40 50 -25 0 25 -0.5 0.0 0.5 -0.5 0.0 0.5 O 3, SH, October, 76 coincidences vmr [ppmv] Al ti tu d e [ km] MIPAS ILAS-II, V1.4 ILAS-II, V2 difference [%] difference [ppmv]
Fig. 23. As in Fig. 19 but for O3data in October.
10 20 30 40 0 1 2 3 4 5 6 7 8 0 1 2 3 4 5 6 7 8 -50 0 50 10 20 30 40 -50 0 50 -0.5 0.0 0.5 -0.5 0.0 0.5 HNO 3, SH, 212 coincidences vmr [ppbv] Al ti tu d e [ km] MIPAS ILAS-II, V1.4 ILAS-II, V2 difference [%] difference [ppbv]
Fig. 24. As in Fig. 19 but for HNO3data for May and August to
October.
mean differences of about ±0.5 ppmv (±10%) above 18 km altitude which is in agreement with the estimated MIPAS sys-tematic error. Below 18 km, mean differences were between
−0.1 ppmv and 0.2 ppmv (−20% and 30%). These differ-ences were again comparable to the differdiffer-ences found in this study.
For N2O and HNO3, there were no large differences be-tween the two retrieval versions of ILAS-II. There was good agreement between the ILAS-II and MIPAS data, although the differences exceed the standard errors of the mean dif-ference (Figs. 14 and 17). The largest difdif-ferences of N2O occurred around 13 km and 14 km with values of 0.04 ppmv (10%) and 0.05 ppmv (15%) for ILAS-II V2 and V1.4,
re-10 20 30 40 0.0 0.5 1.0 1.5 0.0 0.5 1.0 1.5 -80-40 0 40 80 10 20 30 40 -80-40 0 40 80 -0.5 0.0 0.5 -0.5 0.0 0.5 ClONO2, SH, 199 coincidences vmr [ppbv] Al ti tu d e [ km] MIPAS ILAS-II, V1.4 ILAS-II, V2 difference [%] difference [ppbv]
Fig. 25. As in Fig. 19 but for ClONO2.
0.00 0.05 0.10 0.15 0.20 0.25 0.30 0.35 0.0 0.2 0.4 0.6 0.8 1.0 1.2 1.4 1.6 1.8 2.0 0.00 0.05 0.10 0.15 0.20 0.25 0.30 0.35 0.0 0.2 0.4 0.6 0.8 1.0 1.2 1.4 1.6 1.8 2.0 Northern Hemisphere ILAS-II Version 2 ILAS-II Version 1.4
Mid-latitudes 1993/94 (Michelson et al., 1998) adjusted to year 2003 (NO2: +2.3%, CH4: +3.2%)
C H4 Vo lu me Mi xi n g R a ti o [ p p mv]
N2O Volume Mixing Ratio [ppmv]
Fig. 26. N2O-CH4relationships as measured by ILAS-II for the
NH. The mean values at each 1 km are used. 1 σ standard deviations of the data are only shown for CH4for clarity. Trend-corrected
ref-erence correlations observed by other instruments (Michelsen et al., 1998) are shown for comparison.
to be larger than the ILAS-II measurements for the whole height range. Within the ACE-FTS, validation effort com-parisons between MIPAS and ACE-FTS N2O profiles have been made (Strong et al., 2008). In altitudes higher than 20– 25 km, these authors found a similarly good agreement as we found between ILAS-II and MIPAS data. Below these alti-tudes, MIPAS N2O profiles were found to be about 10–15% larger than those of ACE-FTS. This is consistent with the larger ILAS-II/MIPAS N2O differences seen in Fig. 14. This is attributed to a high bias of MIPAS N2O at lower altitudes which is, however, unexplained until now.
0.00 0.05 0.10 0.15 0.20 0.25 0.30 0.35 0.0 0.2 0.4 0.6 0.8 1.0 1.2 1.4 1.6 1.8 2.0 0.00 0.05 0.10 0.15 0.20 0.25 0.30 0.35 0.0 0.2 0.4 0.6 0.8 1.0 1.2 1.4 1.6 1.8 2.0 Southern Hemisphere ILAS-II Version 2 ILAS-II Version 1.4
Vortex >31km, 1994 (Michelson et al., 1998) Vortex 23-31km, 1994 (Michelson et al., 1998) Vortex <23km, 1994 (Michelson et al., 1998) all adjusted to year 2003 (NO2: +2.3%, CH4: +3.2%)
C H4 Vo lu me Mi xi n g R a ti o [ p p mv]
N2O Volume Mixing Ratio [ppmv]
Fig. 27. As in Fig. 26 but for SH.
0 1 2 3 4 5 6 7 8 5/1/2003 6/1/2003 7/1/2003 8/1/2003 9/1/2003 10/1/2003 11/1/2003 0 1 2 3 4 5 6 7 8 5/1/2003 6/1/2003 7/1/2003 8/1/2003 9/1/2003 10/1/2003 11/1/2003 -2 -1 0 1 -2 -1 0 1 O3 [ p p mv] MIPAS 24km ILAS-II V1.4 24km ILAS-II V2 24km D if fe re n ce O 3 [ p p mv] Date
Fig. 28. The time-series of O3at 24 km as measured by ILAS-II
and MIPAS for the SH.
For HNO3, the largest differences were around 25 km with 0.6 ppbv (6.5%) and 0.9 ppbv (9%) for V2 and V1.4, respec-tively (Fig. 17). These differences were comparable to the differences found by Wang et al. (2007) for the ILAS-II V1.4 data with mean differences being less than ±0.7 ppbv and the standard deviations less than ±1 ppbv. It is remarkable that, although the HITRAN 2004 line parameters were used in ILAS-II V2 instead of HITRAN 2000, which was used for ILAS-II V1.4, no large differences were found. These might result from the fact that ILAS-II used not only the 11.3 µm band but also the 7.6 µm region for the retrieval, which com-pensates for the high bias of the 11.3 µm region (Wang et al., 2007).
Finally, for ClONO2, although a positive bias was found in the ILAS-II V1.4 data, a significant improvement in the ILAS-II V2 data was seen (Fig. 18), which might also be due to the inclusion of the transmittance correction. For the ILAS-II V2 data, the differences with the MIPAS data (be-sides at the lowest tangent altitude) were relatively small. The small differences below 30 km were comparable to the differences found by H¨opfner et al. (2007). A diurnal varia-tion of ClONO2due to photochemistry above 30 km should be discussed, as was shown in the context of MIPAS inter-comparison with the ACE-FTS occultation instrument by ap-plication of a chemical transport model (CTM) by H¨opfner et al. (2007). However, in that study, application of the CTM led to an overcorrection of the diurnal effect, such that a def-inite conclusion about the agreement between the two instru-ments in that altitude range remained open since it is not clear whether the remaining difference is due to CTM-model er-rors or the instruments. Thus, we have decided not to use such a correction method for the present study.
4.2 Southern Hemisphere
The ILAS-II V1.4 SH data did not reveal any degraded pro-files as was found for the NH data (Ejiri et al., 2006; Sugita et al., 2006). Since the transmittance correction was not ap-plied to the satellite sunset mode, the differences in VMR between the two algorithm versions were due to the new tangent height registration and the trend correction method for the 100% signal part data (see Appendix A). The for-mer changed the tangent height ranging from −110 m to
−160 m. In such cases, as a lower altitude is assigned for the same measurement spectrum, the resultant VMR gener-ally becomes smaller than that of ILAS-II V1.4. However, as described in Tanaka et al. (2007), the impact of such height changes on retrieved VMR were less than several percent-ages. Therefore, the relatively large differences between the two versions found for H2O and CH4seem to be due to the latter.
For H2O, it can be seen that some negative biases ex-ceed their standard errors in the ILAS-II V2 data (Fig. 19). It should be noted that this analysis included a lot of PSC scenes. Therefore, some negative biases could be possi-ble owing to the non-gaseous contribution correction ap-plied to both the ILAS-II V1.4 and V2 algorithms (Oshchep-kov et al., 2006), since the changes in VMR with regard to the non-gaseous correction is the most sensitive for H2O. Using the simultaneous gas-aerosol retrieval scheme (Os-hchepkov et al., 2006; Yokota et al., 2002), a preliminary result suggested that the ILAS-II V2 data are, on average, 1–2 ppmv larger than the products applied by this scheme for PSC scenes (S. Oshchepkov, personal communication, 2007). We still need to develop an algorithm that will in-clude this scheme as well as a possible improvement of the
data with more validation sources should be made to draw a robust conclusion.
For N2O below 22 km, the mean differences exceed twice their standard errors and thus are considered significant (Fig. 20). The largest differences were around 13 km with 0.06 ppmv (24%) for V2 and 0.05 ppmv (20%) for V1.4. Again at lower altitudes the high bias in the MIPAS N2O data (Strong et al., 2008) can be seen, similar to the NH.
For CH4, the largest differences for ILAS-II V2 were around 17–18 km with 0.26 ppmv (18%) and for V1.4 around 11 km with 0.19 ppmv (11%) (Fig. 21). In the ILAS-II V1.4 validation study, Ejiri et al. (2006) reported that the V1.4 data are somewhat (0.1–0.2 ppmv) larger than HALOE. Thus, V2 had a better agreement with HALOE. It is, therefore, diffi-cult to conclude which version is better based only on these comparison results (i.e., more validation sources are needed). Further, MIPAS CH4 mixing ratios may be biased high by
≈10% below 40 km, as mentioned earlier (M. Engelhardt, personal communication, 2007). The correlation between N2O and CH4 in the SH is also shown in Fig. 27 for ref-erence.
For O3, we have compared the data for different conditions (time periods) in Figs. 22 and 23. A larger negative differ-ence between ILAS-II and MIPAS data was evident in ber than in May–September between 20 and 30 km. In Octo-ber, the largest differences were 0.87 ppmv (22%) at 24 km (Fig. 23). The time-series of O3 values at 24 km (Fig. 28) also reveals such a feature for both the ILAS-II versions.
The largest differences for HNO3occurred for the ILAS-II V2 data at 26 km with 0.64 ppbv (9.6%) and, for ClONO2, differences occurred at 31 km with 0.19 ppbv (32%) (Figs. 24 and 25). Similar to the NH, differences found in the valida-tion studies of MIPAS data (Steck et al., 2007; Wang et al., 2007; H¨opfner et al., 2007) were comparable to the differ-ences found in the present study.
5 Conclusions
Two algorithm versions of ILAS-II data were investigated and compared to MIPAS IMK/IAA data. In this study we have shown that for most cases the ILAS-II V2 data fit better with the other validated data than the V1.4 data. The mean differences between ILAS-II V2 and MIPAS data for both hemispheres were within ±10 to 37%, depending on the gas. They were of the same order of magnitude as in other MI-PAS validation or comparison studies. For both H2O and CH4, a clear improvement from the ILAS-II V1.4 to V2 data was noticed in the NH. There were exceptionally small val-ues in these V1.4 data above 30 km. NH O3also showed an improvement above 40 km in the V2 data. In NH ClONO2 data, an improvement from the V1.4 data with exceptional large values to the V2 data was also obvious. For SH H2O, the agreements were better between ILAS-II V1.4 and
MI-more refined retrieval (Oshchepkov et al., 2006) with a MI-more comprehensive comparison study to decide which version is better, but such particular analysis is beyond the scope of this study. The ILAS-II V1.4 data set (O3, HNO3, N2O, and CH4 for gases) is publicly available through the ILAS-II web site (http://www-ilas2.nies.go.jp). The ILAS-II V2 data set (all gases described in this study) will also be available through it. The authors clearly recommend the use of ILAS-II V2 for further studies, as V1.4 data have some problems, especially in the NH (exceptionally small or large values due to signal distortion). For SH H2O data, further data quality evaluation is necessary.
Appendix A
Processing differences between ILAS-II V1.4 and V2
In this V2 retrieval algorithm, there are several upgrades from V1.4 data (Nakajima et al., 2006a). Here, we only describe points that relate to the retrieval for gases. A further description is found at an ILAS-II web site (http: //www-ilas2.nies.go.jp).
A1 Transmittance correction
This method was applied to correct abnormal transmittance caused by the distortion in the entrance slit due to solar heat energy in the orbit (Sect. 3.3 of Nakajima et al., 2006a). This correction was applied only for NH data, because the effect of transmittance distortion on retrieved gas profiles appar-ently appeared only for sunrise occultation events (see also Sects. 2.1 and 4.1). This is because the degrees of plastic deformation at the atmospheric transmission parts were dif-ferent owing to the difdif-ferent measurement sequences (Yokota et al., unpublished manuscript, available through the ILAS-II web site).
So far, we found that there is a relation between distorted solar disk and slits images obtained by a Sun-Edge Sensor (SES) and output signals obtained by the IR channel. The degree of the distorted solar disk and slits images from the theoretical ones (see Fig. 11 of Nakajima et al., 2006a) was used for estimating the correct transmittance. We have devel-oped a model to correct the output signals from the distortion in the entrance slit by using the following four parameters:
– Degree of vertical movement (in µm) of a lower edge
of the entrance slit for IR, MIR, and VIS channels (L)
– Degree of vertical movement (in µm) of an upper edge
of that (U)
– Slit alignment offset relative to the secondary
(spec-trometer) slit positions (A)
– Element numbers (range) of SES used for transmittance
residual calculation (R)
Among these parameters, A was fixed at −10 µm accord-ing to the laboratory experiment. A schematic of the slit alignment is shown in Fig. 4 of Nakajima et al. (2006a). The size of the entrance slit is 2.4 mm in width and 0.2 mm in height. These three remaining parameters were determined on a daily basis by comparing the modeling of transmittance measured by ILAS-II and the reference transmittance calcu-lated by using gas profiles from other satellite sensors.
First, the theoretical solar disk image was created for SES wavelength (1050 nm) using the theoretical limb-darkening effect and aerosol extinction coefficient at 780 nm data for each scene. Also, smeared sun-edge shape, which occurred owing to the effect of instrument function, was considered.
Second, ILAS-II correlative measurements were searched for other satellite sensors data; HALOE and MIPAS. As a re-sult, 177 matching events were picked up from MIPAS (from 7 April to 13 October 2003) and from HALOE (in May, 2003). By using gas mixing ratio profiles from these data products, reference transmittance spectra of the ILAS-II IR channel were calculated. Assuming this reference transmit-tance as true value, the three parameters (L, U, and R) were iteratively solved to minimize the root-sum-square residuals between the corrected transmittance spectra of the IR chan-nel’s element numbers between 1 and 8 and those calculated by the reference ones. For the residual calculation, the alti-tude range between 20 and 40 km was used.
Third, to apply the determined parameters for whole mea-surement period of ILAS-II (from January to October 2003), time variations of parameters L and U are linearly interpo-lated into time. Time variation of parameter R was fit with a third-order polynomial with time.
A2 Tangent height (TH) registration
The ILAS-II V1.4 data had difficulty in determining the TH, especially below 30 km, due to SES signal distortion and PSC occurrences (Tanaka et al., 2007). In V1.4, about 200 scenes were excluded in the data set because of the PSC oc-currence. Further, there was some altitude gap between 30 and 31 km, depending on scenes, since V1.4 used a com-bined method of two TH registrations (Tanaka et al., 2007). The abnormal SES signal was also caused by the distortion in the entrance slits due to solar heat energy in orbit, as men-tioned earlier. For V2, we applied a new method using in-formation of the angle of the gimbal mirror to eliminate the difficulties mentioned earlier. The gimbal mirror is arranged to guide incident sun light to the spectrometers and the an-gle of the gimbal mirror is recorded during measurements of ILAS-II. By using the position of the satellite, the earth, and the gimbal mirror angle, we calculated the optical path of IFOV center, then the TH was derived. As a result, the assigned THs in V2 were 180 m (±140 m of 1σ standard de-viation for N=2845) higher than those in V1.4 at TH=20 km in NH, and were 150 m (±130 m for N=2711) lower than in SH.
A3 Trend correction in 100% level signal part
Only in the sunset mode measurements, there were less mea-surement frames above an altitude of 80 km in the atmo-spheric measurement part for a lot of scenes. In addition, the 100% level signal part was partly affected by the plastic deformation of the entrance slits, unlike for the sunrise mode measurements where the atmospheric measurement part was affected, Therefore, a conventional trend correction method for the 100% level signal part data (Yokota et al., 2002) could not be applied for the sunset events. Instead, a brief method was developed and applied in V2; the output signal at TH of 80 km was used for the 100% level.
A4 Other revised items
The effect of solar limb-darkening in the IR channel was cal-culated theoretically and was corrected. The same type of correction had already been applied in the version 5.2 algo-rithm used for the original ILAS instrument (Yokota et al., 2002). The look-up table for calculating absorption cross-section data in the forward calculating procedure was re-constructed by using the HITRAN 2004 database (Rothman et al., 2005) instead of the HITRAN 2000 database (Roth-man et al., 2003), which was used for the old algorithm ver-sion. The instrument function was refined using laboratory test data which were obtained prior to the satellite launch. Also, the effect of the cross-talk between the detector ele-ments was changed to 5% (in V1.4, a value of 2.5% was in-correctly used). The retrieved gas profiles were re-evaluated by considering systematic residuals found in the measured transmittance spectra (Appendix of Nakajima et al., 2006b). Consequently, internal errors were calculated from the final residuals of convergence in the non-linear least squares spec-tral fitting. These errors were estimated from the second re-trieval results after subtracting estimated spectral biases. As a result, retrieved profiles were slightly changed but the in-ternal error values were reduced from the first to the second retrievals, which is comparable to repeatability (Yokota et al., unpublished manuscript, available through the ILAS-II web site) applied in the V1.4 data. Although other minor revi-sions were made, they can be also found at the ILAS-II web site.
Acknowledgements. The ILAS-II project was funded by the
Ministry of the Environment, Japan (MOE). A part of this research was supported by the Global Environment Research Fund (GERF) provided by the MOE. M. Engelhardt and S. Oshchepkov kindly showed us their comparison results prior to publication.
Edited by: M. van Roozendael
References
Bernath, P. F., McElroy, C. T., Abrams, M. C., Boone, C. D., But-ler, M., Camy-Peyret, C., Carleer, M., Clerbaux, C., Coheur, P.-F., Colin, R., DeCola, P., DeMazi`ere, M., Drummond, J. R., Dufour, D., Evans, W. F. J., Fast, H., Fussen, D., Gilbert, K., Jennings, D. E., Llewellyn, E. J., Lowe, R. P., Mahieu, E., Mc-Connell, J. C., McHugh, M., McLeod, S. D., Michaud, R., Mid-winter, C., Nassar, R., Nichitiu, F., Nowlan, C., Rinsland, C. P., Rochon, Y. J., Rowlands, N., Semeniuk, K., Simon, P., Skel-ton, R., Sloan, J. J., Soucy, M.-A., Strong, K., Tremblay, P., Turnbull, D., Walker, K. A., Walkty, I., Wardle, D. A., Wehrle, V., Zander, R., and Zou, J.: Atmospheric Chemistry Experiment (ACE): Mission overview, Geophys. Res. Lett., 32, L15S01, doi: 10.1029/2005GL022386, 2005.
Bracher, A., Bovensmann, H., Bramstedt, K., Burrows, J. P., von Clarmann, T., Eichmann, K.-U., Fischer, H., Funke, B., Gil-L´opez, S., Glatthor, N., Grabowski, U., H¨opfner, M., Kaufmann, M., Kellmann, S., Kiefer, M., Koukouli, M. E., Linden, A., L´opez-Puertas, M., Mengistu Tsidu, G., Milz, M., No¨el, S., Ro-hen, G., Rozanov, A., Rozanov, V. V., von Savigny, C., Sinnhu-ber, M., Skupin, J., Steck, T., Stiller, G. P., Wang, D.-Y., We-ber, M., and Wuttke, M. W.: Cross comparisons of O3and NO2
measured by the atmospheric ENVISAT instruments GOMOS, MIPAS, and SCIAMACHY, Adv. Space Res., 36, 855–867, doi: 10.1016/j.asr.2005.04.005, 2005.
Ejiri, M. K., Terao, Y., Sugita, T., Nakajima, H., Yokota, T., Toon, G. C., Sen, B., Wetzel, G., Oelhaf, H., Urban, J., Murtagh, D., Irie, H., Saitoh, N., Tanaka, T., Kanzawa, H., Shiotani, M., Kobayashi, H., and Sasano, Y.: Validation of the Improved Limb Atmospheric Spectrometer-II ILAS-II Version 1.4 nitrous ox-ide and methane profiles, J. Geophys. Res., 111, D22S90, doi: 10.1029/2005JD006449, 2006.
Fischer, H., Birk, M., Blom, C., Carli, B., Carlotti, M., von Clar-mann, T., Delbouille, L., Dudhia, A., Ehhalt, D., EndeClar-mann, M., Flaud, J. M., Gessner, R., Kleinert, A., Koopmann, R., Langen, J., L´opez-Puertas, M., Mosner, P., Nett, H., Oelhaf, H., Perron, G., Remedios, J., Ridolfi, M., Stiller, G., and Zander, R.: MI-PAS: an instrument for atmospheric and climate research, Atmos. Chem. Phys. Discuss., 7, 8795–8893, 2007,
http://www.atmos-chem-phys-discuss.net/7/8795/2007/. Flaud, J.-M., Piccolo, C., Carli, B., Perrin, A., Coudert, L. H., Teffo,
J.-L., and Brown, L. R.: Molecular line parameters for the MI-PAS (Michelson Interferometer for Passive Atmospheric Sound-ing) experiment, Atmos. Oceanic Opt., 16, 172–182, 2003. Funke, B., L´opez-Puertas, M., Stiller, G. P., von Clarmann, T.,
and H¨opfner, M.: A new non-LTE Retrieval Method for Atmo-spheric Parameters From MIPAS–ENVISAT Emission Spectra, Adv. Space Res., 27, 1099–1104, 2001.
Glatthor, N., von Clarmann, T., Fischer, H., Funke, B., Grabowski, U., H¨opfner, M., Kellmann, S., Kiefer, M., Linden, A., Milz, M., Steck, T., Stiller, G. P., Mengistu Tsidu, G., and Wang, D. Y.: Mixing processes during the Antarctic vortex split in Septem-ber/October 2002 as inferred from source gas and ozone distri-butions from ENVISAT-MIPAS, J. Atmos. Sci., 62, 787–800, 2005.
H¨opfner, M., Stiller, G. P., Kuntz, M., von Clarmann, T., Echle, G., Funke, B., Glatthor, N., Hase, F., Kemnitzer, H., and Zorn, S.: The Karlsruhe optimized and precise radiative transfer algorithm.
Sensing of the Atmosphere and Clouds, Beijing, China, 15–17 September 1998, edited by: Wang, J., Wu, B., Ogawa, T., and Guan, Z., Vol. 3501, 186–195, 1998.
H¨opfner, M., von Clarmann, T., Fischer, H., Glatthor, N., Grabowski, U., Kellmann, S., Kiefer, M., Linden, A., Mengistu Tsidu, G., Milz, M., Steck, T., Stiller, G. P., Wang, D.-Y., and Funke, B.: First spaceborne observations of Antarctic strato-spheric ClONO2 recovery: Austral spring 2002, J. Geophys.
Res., 109, D11308, doi:10.1029/2004JD004609, 2004.
H¨opfner, M., von Clarmann, T., Fischer, H., Funke, B., Glatthor, N., Grabowski, U., Kellmann, S., Kiefer, M., Linden, A., Milz, M., Steck, T., Stiller, G. P., Bernath, P., Blom, C. E., Blumenstock, T., Boone, C., Chance, K., Coffey, M. T., Friedl-Vallon, F., Grif-fith, D., Hannigan, J. W., Hase, F., Jones, N., Jucks, K. W., Keim, C., Kleinert, A., Kouker, W., Liu, G. Y., Mahieu, E., Mellqvist, J., Mikuteit, S., Notholt, J., Oelhaf, H., Piesch, C., Reddmann, T., Ruhnke, R., Schneider, M., Strandberg, A., Toon, G., Walker, K. A., Warneke, T., Wetzel, G., Wood, S., and Zander, R.: Vali-dation of MIPAS ClONO2measurements, Atmos. Chem. Phys., 7, 257–281, 2007,
http://www.atmos-chem-phys.net/7/257/2007/.
Irie, H., Sugita, T., Nakajima, H., Yokota, T., Oelhaf, H., Wetzel, G., Toon, G. C., Sen, B., Santee, M. L., Terao, Y., Saitoh, N., Ejiri, M. K., Tanaka, T., Kondo, Y., Kanzawa, H., Kobayashi, H., and Sasano, Y.: Validation of stratospheric nitric acid profiles observed by Improved Limb Atmospheric Spectrometer (ILAS)-II, J. Geophys. Res., 111, D11S03, doi:10.1029/2005JD006115, 2006.
Kanzawa, H., Sugita, T., Nakajima, H., Bodeker, G. E., Oelhaf, H., Stowasser, M., Wetzel, G., Engel, A., Schmidt, U., Levin, I., Toon, G. C., Sen, B., Blavier, J.-F., Aoki, S., Nakazawa, T., Jucks, K. W., Johnson, D. G., Traub, W. A., Camy-Peyret, C., Payan, S., Jeseck, P., Murata, I., Fukunishi, H., von K¨onig, M., Bremer, H., K¨ullmann, H., Park, J. H., Pan, L. L., Yokota, T., Suzuki, M., Shiotani, M., and Sasano, Y.: Validation and data characteristics of nitrous oxide and methane profiles observed by the Improved Limb Atmospheric Spectrometer (ILAS) and processed with the version 5.20 algorithm, J. Geophys. Res., 108, doi:10.1029/2002JD002458, 2003.
Mengistu Tsidu, G., Stiller, G. P., von Clarmann, T., Funke, B., H¨opfner, M., Fischer, H., Glatthor, N., Grabowski, U., Kell-mann, S., Kiefer, M., Linden, A., L´opez-Puertas, M., Milz, M., Steck, T., and Wang, D. Y.: NOy from Michelson
Inter-ferometer for Passive Atmospheric Sounding on Environmental Satellite during the Southern Hemisphere polar vortex split in September/October 2002, J. Geophys. Res., 110, D11301, doi: 10.1029/2004JD005322, 2005.
Michelsen, H. A., Manney, G. L., Gunson, M. R., Rinsland, C. P., and Zander, R.: Correlations of stratospheric abundances of CH4
and N2O derived from ATMOS measurements, Geophys. Res.
Lett., 25, 2777–2780, 1998.
Milz, M., von Clarmann, T., Fischer, H., Glatthor, N., Grabowski, U., H¨opfner, M., Kellmann, S., Kiefer, M., Linden, A., Mengistu Tsidu, G., Steck, T., Stiller, G. P., Funke, B., L´opez-Puertas, M., and Koukouli, M. E.: Water Vapor Distributions Measured with the Michelson Interferometer for Passive Atmospheric Sound-ing on board Envisat (MIPAS/Envisat), J. Geophys. Res., 110, D24307, doi:10.1029/2005JD005973, 2005.
Nakajima, H., Sugita, T., Yokota, T., Kobayashi, H., Sasano, Y.,
Ishigaki, T., Mogi, Y., Araki, N., Waragai, K., Kimura, N., Iwazawa, T., Kuze, A., Tanii, J., Kawasaki, H., Horikawa, M., Togami, T., and Uemura, N.: Characteristics and performance of the Improved Limb Atmospheric Spectrometer-II (ILAS-II) on board the ADEOS-II satellite, J. Geophys. Res., 111, D11S01, doi:10.1029/2005JD006334, 2006a.
Nakajima, H., Sugita, T., Irie, H., Saitoh, N., Kanzawa, H., Oel-haf, H., Wetzel, G., Toon, G. C., Sen, B., Blavier, J.-F., Traub, W. A., Jucks, K., Johnson, D. G., Yokota, T., and Sasano, Y.: Measurements of ClONO2 by the Improved Limb Atmospheric Spectrometer (ILAS) in high-latitude stratosphere: New products using version 6.1 data processing algorithm, J. Geophys. Res., 111, D11S09, doi:10.1029/2005JD006441, 2006b.
Nash, E. R., Newman, P. A., Rosenfield, J. E., and Schoeberl, M. R.: An objective determination of the polar vortex using Ertel’s po-tential vorticity, J. Geophys. Res., 101, 9471–9478, 1996. Oshchepkov, S., Sasano, Y., Yokota, T., Nakajima, H., Uemura, N.,
Saitoh, N., Sugita, T., and Matsuda, H.: ILAS data processing for stratospheric gas and aerosol retrievals with aerosol physical modeling: Methodology and validation of gas retrievals, J. Geo-phys. Res., 111, D02307, doi:10.1029/2005JD006543, 2006. Ridolfi, M., Carli, B., Carlotti, M., von Clarmann, T., Dinelli, B.,
Dudhia, A., Flaud, J.-M., H¨opfner, M., Morris, P. E., Raspollini, P., Stiller, G., and Wells, R. J.: Optimized Forward and Re-trieval Scheme for MIPAS Near-Real-Time Data Processing, Appl. Opt., 39, 1323–1340, 2000.
Rothman, L. S., Barbe, A., Benner, D. C., Brown, L. R., Camy-Peyret, C., Carleer, M. R., Chance, K., Clerbaux, C., Dana, V., Devi, V. M., Fayt, A., Flaud, J.-M., Gamache, R. R., Goldman, A., Jacquemart, D., Jucks, K. W., Lafferty, W. J., Mandin, J.-Y., Massie, S. T., Nemtchinov, V., Newnham, D. A., Perrin, A., Rinsland, C. P., Schroeder, J., Smith, K. M., Smith, M. A. H., Tang, K., Toth, R. A., Auwera, J. V., Varanasi, P., and Yoshino, K.: The HITRAN Molecular Spectroscopic Database: Edition of 2000 Including Updates through 2001, HITRAN Special Issue: J. Quant. Spectrosc. Radiat. Transfer, 82, 5–44, 2003.
Rothman, L. S., Jacquemart, D., Barbe, A., Benner, D. C., Birk, M., Brown, L. R., Carleer, M. R., Chackerian Jr., C., Chance, K., Coudert, L., Dana, V., Devi, V. M., Flaud, J.-M., Gamache, R. R., Goldman, A., Hartmann, J.-M., Jucks, K. W., Maki, A. G., Mandin, J.-Y., Massie, S. T., Orphal, J., Perrin, A., Rinsland, C. P., Smith, M. A. H., Tennyson, J., Tolchenov, R. N., Toth, R. A., Auwera, J. V., Varanasi, P., and Wagner, G.: The HITRAN 2004 Molecular Spectroscopic Database, HITRAN Special Is-sue: J. Quant. Spectrosc. Radiat. Transfer, 96, 139–204, 2005. Steck, T., von Clarmann, T., Fischer, H., Funke, B., Glatthor, N.,
Grabowski, U., H¨opfner, M., Kellmann, S., Kiefer, M., Linden, A., Milz, M., Stiller, G. P., Wang, D. Y., Alaart, M., Blumen-stock, T., von der Gathen, P., Hansen, G., Hase, F., Hochschild, G., G.Kopp, Kyr¨o, E., Oelhaf, H., Raffalski, U., Redondas Mar-rero, A., Remsberg, E., Russell III, J., Stebel, K., Steinbrecht, W., Wetzel, G., Yela, M., and Zhang, G.: Bias determination and precision validation of ozone profiles from MIPAS-Envisat retrieved with the IMK-IAA processor, Atmos. Chem. Phys., 7, 3639–3662, 2007,
http://www.atmos-chem-phys.net/7/3639/2007/.
Stiller, G. P. (Ed.): The Karlsruhe Optimized and Precise Radiative Transfer Algorithm (KOPRA), Forschungszentrum Karlsruhe, Wissenschaftliche Berichte, FZKA 6487, 2000.
Stiller, G. P., H¨opfner, M., Kuntz, M., von Clarmann, T., Echle, G., Fischer, H., Funke, B., Glatthor, N., Hase, F., Kemnitzer, H., and Zorn, S.: The Karlsruhe optimized and precise radiative transfer algorithm. Part I: Requirements, justification, and model error estimation, in: Optical Remote Sensing of the Atmosphere and Clouds, Beijing, China, 15–17 September 1998, edited by: Wang, J., Wu, B., Ogawa, T., and Guan, Z., Vol. 3501, 257–268, 1998.
Stiller, G. P., Mengistu Tsidu, G., von Clarmann, T., Glatthor, N., H¨opfner, M., Kellmann, S., Linden, A., Ruhnke, R., Fischer, H., L´opez-Puertas, M., Funke, B., and Gil-L´opez, S.: An en-hanced HNO3 second maximum in the Antarctic mid–winter upper stratosphere 2003, J. Geophys. Res., 110, D20303, doi: 10.1029/2005JD006011, 2005.
Strong, K., Wolff, M. A., Kerzenmacher, T. E., Walker, K. A., Bernath, P. F., Blumenstock, T., Boone, C., Catoire, V., Coffey, M., De Mazi`ere, M., Demoulin, P., Duchatelet, P., Dupuy, E., Hannigan, J., H¨opfner, M., Glatthor, N., Griffith, D. W. T., Jin, J. J., Jones, N., Jucks, K., Kuellmann, H., Kuttippurath, J., Lam-bert, A., Mahieu, E., McConnell, J. C., Mellqvist, J., Mikuteit, S., Murtagh, D. P., Notholt, J., Piccolo, C., Robert, C., Schneider, M., Schrems, O., Semeniuk, K., Senten, C., Stiller, G. P., Strand-berg, A., Taylor, J., T´etard, C., Toohey, M., Urban, J., Warneke, T., and Wood, S.: Validation of ACE-FTS N2O measurements, Atmos. Chem. Phys. Discuss, accepted, 2008.
Sugita, T., Nakajima, H., Yokota, T., Kanzawa, H., Gernandt, H., Herber, A., von der Gathen, P., Koenig-Langlo, G., Sato, K., Dorokhov, V., Yushukov, V. A., Murayama, Y., Yamamori, M., Godin-Beekmann, S., Goutail, F., Roscoe, H., Deshler, T., Yela, M., Taalas, P., Kyro, E., Oltmans, S., Johnson, B., Allaart, M., Litynska, Z., Klekociuk, A., Andersen, S. B., Braathen, G., De Backer, H., Randall, C. E., Thomason, L. W., Irie, H., Ejiri, M. K., Saitoh, N., Tanaka, T., Terao, Y., Kobayashi, H., and Sasano, Y.: Ozone profiles in the high-latitude stratosphere and lower mesosphere measured by the Improved Limb Atmo-spheric Spectrometer (ILAS)-II: Comparison with other satellite sensors and ozonesondes, J. Geophys. Res., 111, D11S02, doi: 10.1029/2005JD006439, 2006.
Tanaka, T., Nakajima, H., Sugita, T., Ejiri, M. K., Irie, H. Saitoh, N., Terao, Y., Kawasaki, H., Usami, M., Yokota, T., Kobayashi, H., and Sasano, Y.: Tangent height registration method for the Ver-sion 1.4 data retrieval algorithm of the solar occultation sensor ILAS-II, Appl. Opt., 46, 7196–7201, 2007.
Verronen, P., Kyr¨ol¨a, E., Funke, B., Gil-L´opez, S., Kaufmann, M., L´opez-Puertas, M., von Clarmann, T., Stiller, G., Grabowski, U., and H¨opfner, M.: A Comparison of night-time GOMOS and MI-PAS vertical ozone profiles in the stratosphere and mesosphere, Adv. Space Res., 36, 958–966, 2005.
von Clarmann, T.: Validation of remotely sensed profiles of at-mospheric state variables: strategies and terminology, Atmos. Chem. Phys., 6, 4311–4320, 2006,
http://www.atmos-chem-phys.net/6/4311/2006/.
von Clarmann, T., Chidiezie Chineke, T., Fischer, H., Funke, B., Garc´ıa-Comas, M., Gil-L´opez, S., Glatthor, N., Grabowski, U., H¨opfner, M., Kellmann, S., Kiefer, M., Linden, A., L´opez-Puertas, M., L´opez-Valverde, M. ´A., Mengistu Tsidu, G., Milz, M., Steck, T., and Stiller, G. P.: Remote Sensing of the Middle Atmosphere with MIPAS, in: Remote Sensing of Clouds and the Atmosphere VII, edited by: Sch¨afer, K., Lado-Bordowsky, O., Comer´on, A., and Picard, R. H., SPIE, Bellingham, WA, USA, Vol. 4882, 172–183, 2003a.
von Clarmann, T., Glatthor, N., Grabowski, U., H¨opfner, M., Kell-mann, S., Kiefer, M., Linden, A., Mengistu Tsidu, G., Milz, M., Steck, T., Stiller, G. P., Wang, D. Y., Fischer, H., Funke, B., Gil-L´opez, S., and L´opez-Puertas, M.: Retrieval of temper-ature and tangent altitude pointing from limb emission spectra recorded from space by the Michelson Interferometer for Passive Atmospheric Sounding (MIPAS), J. Geophys. Res., 108, 4736, doi:10.1029/2003JD003602, 2003b.
Wang, D.-Y., Stiller, G. P., von Clarmann, T., Fischer, H., Glatthor, N., Grabowski, U., H¨opfner, M., Kellmann, S., Kiefer, M., Lin-den, A., Mengistu Tsidu, G., Milz, M., Steck, T., Wohnsiedler, S., L´opez-Puertas, M., Funke, B., Gil-L´opez, S., Kaufmann, M., Koukouli, M., Murtagh, D., Lautie, N., Jimenez, C., Jones, A., Eriksson, P., Urban, J., Noe, J., Flochmoen, E., Dupuy, E., Ri-caud, P., Olberg, M., Frisk, U., Russel III, J., and Remsberg, E.: Comparisons of MIPAS/SAT ozone profiles with SMR/ODIN and HALOE/UARS observations, Adv. Space Res., 36, 927–931, 2005.
Wang, D. Y., H¨opfner, M., Mengistu Tsidu, G., Stiller, G. P., von Clarmann, T., Fischer, H., Blumenstock, T., Glatthor, N., Grabowski, U., Hase, F., Kellmann, S., Linden, A., Milz, M., Oelhaf, H., Schneider, M., Steck, T., Wetzel, G., L´opez-Puertas, M., Funke, B., Koukouli, M. E., Nakajima, H., Sugita, T., Irie, H., Urban, J., Murtagh, D., Santee, M. L., Toon, G., Gunson, M. R., Irion, F. W., Boone, C. D., Walker, K., and Bernath, P. F.: Validation of nitric acid retrieved by the IMK-IAA proces-sor from MIPAS/ENVISAT measurements, Atmos. Chem. Phys., 7, 721–738, 2007,
http://www.atmos-chem-phys.net/7/721/2007/.
Wetzel, G., Oelhaf, H., Friedl-Vallon, F., Kleinert, A., Lengel, A., Maucher, G., Nordmeyer, H., Ruhnke, R., Nakajima, H., Sasano, Y., Sugita, T., and Yokota, T.: Intercomparison and val-idation of ILAS-II version 1.4 target parameters with MIPAS-B measurements, J. Geophys. Res., 111, D11S06, doi:10.1029/ 2005JD006287, 2006.
Yokota, T., Nakajima, H., Sugita, T., Tsubaki, H., Itou, Y., Kaji, M., Suzuki, M., Kanzawa, H., Park, J. H., and Sasano, Y.: Im-proved Limb Atmospheric Spectrometer (ILAS) data retrieval al-gorithm for Version 5.20 gas profile products, J. Geophys. Res., 107, 8216, doi:10.1029/2001JD000628, 2002.