HAL Id: hal-00330264
https://hal.archives-ouvertes.fr/hal-00330264
Submitted on 30 Aug 2007HAL is a multi-disciplinary open access
archive for the deposit and dissemination of sci-entific research documents, whether they are pub-lished or not. The documents may come from teaching and research institutions in France or abroad, or from public or private research centers.
L’archive ouverte pluridisciplinaire HAL, est destinée au dépôt et à la diffusion de documents scientifiques de niveau recherche, publiés ou non, émanant des établissements d’enseignement et de recherche français ou étrangers, des laboratoires publics ou privés.
Distribution of inorganic and organic nutrients in the
South Pacific Ocean – evidence for long-term
accumulation of organic matter in nitrogen-depleted
waters
Patrick Raimbault, N. Garcia, F. Cerutti
To cite this version:
Patrick Raimbault, N. Garcia, F. Cerutti. Distribution of inorganic and organic nutrients in the South Pacific Ocean – evidence for long-term accumulation of organic matter in nitrogen-depleted waters. Biogeosciences Discussions, European Geosciences Union, 2007, 4 (4), pp.3041-3087. �hal-00330264�
BGD
4, 3041–3087, 2007Nutrient distribution in the South Pacific
Ocean P. Raimbault et al. Title Page Abstract Introduction Conclusions References Tables Figures ◭ ◮ ◭ ◮ Back Close
Full Screen / Esc
Printer-friendly Version Interactive Discussion
EGU
Biogeosciences Discuss., 4, 3041–3087, 2007 www.biogeosciences-discuss.net/4/3041/2007/ © Author(s) 2007. This work is licensed
under a Creative Commons License.
Biogeosciences Discussions
Biogeosciences Discussions is the access reviewed discussion forum of Biogeosciences
Distribution of inorganic and organic
nutrients in the South Pacific Ocean –
evidence for long-term accumulation of
organic matter in nitrogen-depleted
waters
P. Raimbault, N. Garcia, and F. Cerutti
Laboratoire d’Oc ´eanographie et de Biog ´eochimie (UMR 6535 CNRS), Centre d’Oc ´eanologie de Marseille, Universit ´e de la M ´editerran ´ee, Campus de Luminy, 13288 Marseille Cx 09, France
Received: 23 July 2007 – Accepted: 30 July 2007 – Published: 30 August 2007 Correspondence to: P. Raimbault ([email protected])
BGD
4, 3041–3087, 2007Nutrient distribution in the South Pacific
Ocean P. Raimbault et al. Title Page Abstract Introduction Conclusions References Tables Figures ◭ ◮ ◭ ◮ Back Close
Full Screen / Esc
Printer-friendly Version Interactive Discussion
EGU
Abstract
The BIOSOPE cruise of the RV Atalante was devoted to study the biogeochemical properties in the South Pacific between the Marquesas Islands (141◦W–8◦S) and the Chilean upwelling (73◦W–34◦S). The 8000 km cruise had the opportunity to encounter different trophic situations, and especially strong oligotrophic conditions in the
Cen-5
tral South Pacific Gyre (SPG, between 123◦W and 101◦W). In this isolated region, nitrate was undetectable between surface and 160–180 m, while regenerated nitro-gen (nitrite and ammonium) only revealed some traces (<20 nmoles l−1), even in the
subsurface maximum. Integrated nitrate over the photic layer, which reached 165 m, was close to zero. In spite of this severe nitrogen-depletion, phosphate was always
10
present at significant concentrations (≈0.1 µmoles l−1), while silicate maintained at low
but classical oceanic levels (≈1 µmoles l−1). In contrast, the Marquesas region (MAR) at west and Chilean upwelling (UPW) at east were characterized by large nutrient con-tents one hundred to one thousand fold higher than in the SPG. Distribution of surface chlorophyll concentration reflected this gradient of nitrate availability. The lowest value
15
(0.023 nmoles l−1) was measured in the centre of the SPG, where integrated chloro-phyll over the photic layer was very weak (≈10 mg m−2), since a great part (up to 50%)
of the deep chlorophyll maximum (DCM) was located below the 1% light. But, because of the relative high concentration encountered in the DCM (0.2µg l−1), chlorophyll a
content over the photic layer varied much less (by a factor 2 to 5) than the nitrate
20
content. In contrast to chlorophyll a, integrated content of particulate organic matter (POM) remained more or less constant along the investigated area (500 mmoles m−2, 60 mmoles m−2and 3.5 mmoles m−2for particulate organic carbon, particulate organic
nitrogen and particulate organic phosphorus, respectively), except in the upwelling where values were two fold higher. Extensive comparison has shown that glass fiber
25
GF/F filters efficiency collected particulate chlorophyll, while a significant fraction of POM (up to 50%) passed trough this filter and was retained by 0.2µm Teflon mem-brane. The most striking feature was the large accumulation of dissolved organic
BGD
4, 3041–3087, 2007Nutrient distribution in the South Pacific
Ocean P. Raimbault et al. Title Page Abstract Introduction Conclusions References Tables Figures ◭ ◮ ◭ ◮ Back Close
Full Screen / Esc
Printer-friendly Version Interactive Discussion
EGU
matter (DOM) in the SPG relative to surrounding waters, especially dissolved organic carbon (DOC) where concentrations were at levels rarely measured in oceanic waters (>100 µmoles l−1). Due to this large pool of DOM over the whole photic layer of the
SPG, integrated values followed an opposite geographical pattern than this of inorganic nutrients with a large accumulation within the centre of the SPG. While suspended
par-5
ticulate matter in the mixed layer had C/N ratio largely conform to Redfield stoichiome-try (C/N≈6.6), marked deviations were observed in this excess DOM (C/N≈16 to 23). The existence of C-rich dissolved organic matter is recognized as a feature typical of oligotrophic waters, requiring the over consumption of carbon. Thus, in spite of strong nitrate-depletion leading to low chlorophyll biomass, the closed ecosystem of the SPG
10
can produce a large amount of carbon. The implications of this finding are discussed, the conclusion being that, due to the lack of seasonal vertical mixing and weak lateral advection, the dissolved organic carbon biologically produced can be accumulated and stored in the photic layer for a very long period.
1 Introduction
15
The warm oligotrophic regions of the open ocean are subject to smaller seasonal tem-perature variations than temperate waters, and they are permanently underlain by a strong thermocline. Therefore they are regarded as the least variable and the least productive surface waters of the sea. But, by representing 60% of the global ocean’s area, the subtropical open-ocean ecosystems are the largest coherent biomes of our
20
planet and the biogeochemical processes they support have global consequences (Karl, 2002). Then a comprehensive evaluation of both inorganic and organic nutrient pools is important to achieve an understanding of the production and fate of organic matter in these large oceanic areas. But, rates of reported for oligotrophic waters are subject to large errors (McCarthy, 1980) due to the inability of conventional nutrients
25
analysis to measure the extremely low concentrations that exist over the vast areas of open ocean. Over the last 15 years, international programs have greatly advanced
BGD
4, 3041–3087, 2007Nutrient distribution in the South Pacific
Ocean P. Raimbault et al. Title Page Abstract Introduction Conclusions References Tables Figures ◭ ◮ ◭ ◮ Back Close
Full Screen / Esc
Printer-friendly Version Interactive Discussion
EGU
our understanding of these vast marine ecosystems. But the South Pacific, comprising the South Pacific Gyre, remains is one of the least studied major areas of the Ocean (Daneri and Quinones, 2001). This region has been described as the most oligotrophic zone in the world ocean (Dandonneau et al., 2006) detected on satellite imagery by the lowest surface chlorophyll concentration (Claustre and Maritorena, 2003) and
con-5
firmed by the discovery of the clearest oceanic water of the world (Morel et al., 2007). The BIOSOPE (BIOgeochemistry and Optics South Pacific Experiment) cruise pro-vided the first spatially extensive experiment in the South east Pacific. The 8000 km transect, stretching from the Marquesas Islands to the Chilean coast and crossing the centre of South Pacific Gyre, is an ideal area to study organic and inorganic nutrients
10
along an extreme trophic gradient. The main objective of this work is to describe inor-ganic and orinor-ganic distribution related to different environmental conditions and through the comparison of different environments covered by the BIOSOPE cruise. Since the ambient concentration is often under detection limit of conventional analytical proce-dure (Brzezinski, 1985; Garside, 1985; Sahlsten, 1987; Raimbault et al., 1999)
sensi-15
tive procedures have to been used to detect some trace of nutrients (Garside, 1982; Raimbault et al., 1990; Holmes et al., 1999). In this paper we describe spatial and ver-tical distributions of inorganic and organic nutrients in the South Pacific with a special attention to the very oligotrophic South Pacific Gyre. All pools of carbon, nitrogen and phosphorus relevant to production in the upper layer are analyzed drawing a first broad
20
data base for this unexplored oceanic region.
2 Materials and methods
Data were gathered during the BIOSOPE cruise carried out on board the R/V Atalante in October–November 2004 in the southeast Pacific Ocean along a transect between the Marquesas archipelago and the Chilean coasts (from 146.36◦W–15.24◦S to and
25
72.49◦W–34.7◦S, Fig. 1). Twenty four short-term (8 h) stations were studied each day
BGD
4, 3041–3087, 2007Nutrient distribution in the South Pacific
Ocean P. Raimbault et al. Title Page Abstract Introduction Conclusions References Tables Figures ◭ ◮ ◭ ◮ Back Close
Full Screen / Esc
Printer-friendly Version Interactive Discussion
EGU
long fixed stations (over 2–5 days), representing different trophic regimes sites: MAR = Marquesas archipelago (141.3◦W; 8.4◦S); HLN = High Nutrient Low Chlorophyll area
east of the Marquesas islands (136.8◦W; 9◦S); GYR = centre of the South pacific gyre 114◦W, 26◦S); EGY = eastern border of the gyre (91.4◦W, 31.8◦S), UPW and UPX situated in the area of Chilean upwelling (73◦W–34◦S and 72.4◦W–34.5◦S). Station
5
from the gyre has been selected from ocean color images as having the lowest surface chlorophyll concentration in the world ocean. High vertical resolution environmental data were achieved between 0 and 500 m using a conductivity temperature-depth-oxygen profiler (CTDO, Seabird 911 plus) with a rosette supported 12-liters Niskin bottles equipped with silicon rubber. Sampling depths for on board and land-laboratory
10
analysis have been chose according the depth of the maximum chlorophyll, to correctly sample the photic layer.
2.1 Inorganic nutrients
Nutrient samples for nitrate, nitrite, phosphates and silicate determination were col-lected at each station. For each depth level, samples were taken both in 20 ml
polyethy-15
lene flasks and 250 ml polycarbonate flasks. Samples from 20 ml polyethylene flasks were immediately poisoned with mercuric chloride (1µg ml−1) according to Kirkwood
(1992) and stored until analysis at laboratory. Ambient nitrate, nitrite and phosphate concentrations were immediately measured in the 250 ml flasks by directly pumping with the Technicon AutoAnalyzer®. Nitrate and nitrate concentrations in the
nanomo-20
lar range (lower detection limit = 3 nmoles l−1) were obtained from a sensitive method
according to Raimbault et al. (1990). Nitrate at submicromolar levels (detection limit 0.05µmoles l−1) and phosphate (detection limit 0.02µmoles l−1) were measured
ac-cording to Armstrong et al. (1967). Ammonium concentrations (40 ml collected in a 50 ml Schott glass flask) were measured using the sensitive method of Holmes et
25
al. (1999) having a detection limit of 5 nmoles l−1.
BGD
4, 3041–3087, 2007Nutrient distribution in the South Pacific
Ocean P. Raimbault et al. Title Page Abstract Introduction Conclusions References Tables Figures ◭ ◮ ◭ ◮ Back Close
Full Screen / Esc
Printer-friendly Version Interactive Discussion
EGU
were determined at laboratory (Tr ´eguer and LeCorre, 1975) on poisoned samples four months after sampling. To ensure reproducibility in nutrient measurements between analyses, an unique type of in-house standards was used, which was regularly com-pared to commercial products (OSIL). Precision was also tested, through the participa-tion in the European inter-calibraparticipa-tion exercise QUASIMEME (http://www.quasimeme. 5
marlab.ac.uk/).
2.2 Phytoplanktonic biomass
250 ml of seawater were filtered on 25 mm Whatmann GF/F filter immediately after sampling, and placed in a glass tube containing 5 ml of pure methanol as described by Raimbault et al. (2004). After 20–30 min of extraction, fluorescence of the extract was
10
determined on a Turner Fluorometer 110 equipped with the Welschmeyer’s kit to avoid chlorophyllb interference (Welschmeyer, 1994). Since monochromatic fluorescence method can not separate divinyl chlorophyll from chlorophyll a, results are given in term of total chlorophyll a concentrations (Tchla), e.g. the sum of chlorophyll a and divinyl chlorophylla. The blank “methanol + filter” was close to zero offering a very low
15
detection limit around 0.01µg l−1. Calibration was made with pure Sigma chlorophylla
standard.
2.3 Organic nutrients
Samples for particulate organic carbon (POC), particulate organic nitrogen (PON) and particulate organic phosphorus (POP) were filtered on 0.2µm Teflon membrane. The
20
hydrophobic Teflon membranes were first wetted with ethanol (1ml) just before filtra-tion and rinsed with milliQ water. According to the quantity of particulate matter 580 to 1200 ml were filtered. After filtration, filters were immediately wetted with 100µl of H2SO4 (0.5N) to removed inorganic carbon. Then filters were stored in 25 ml Schott
glass until chemical analysis at laboratory. Blank filters were prepared with each set of
25
BGD
4, 3041–3087, 2007Nutrient distribution in the South Pacific
Ocean P. Raimbault et al. Title Page Abstract Introduction Conclusions References Tables Figures ◭ ◮ ◭ ◮ Back Close
Full Screen / Esc
Printer-friendly Version Interactive Discussion
EGU
and rinsed with 600 ml of<0.2 µm seawater. Determination of POC, PON and POP were performed simultaneously on the same samples by a wet-oxidation procedure according to Raimbault et al. (1999a). Results on filter blank are given on Table 1. Values were a little higher than those given Raimbault et al. (1999a) but remain three to ten fold lower than the particulate matter collected on filters. In parallel, particulate
5
carbon (PC) and particulate nitrogen (PN) collected on Whatman GF/F filters were ob-tained from dual isotopic13C/15N experiments (see Raimbault and Garcia, 2007). In this case, filters were not acidified and PC and PN were measured by high combustion (900◦C) on a CN Integra mass spectrometer. Samples for total organic matter determi-nation were collected directly to the Niskin bottles in a 50 ml Glass Schott, previously
10
treated as proposed by Raimbault et al. (1999b). Samples were immediately acidi-fied with 100µl H2SO4 0.5 N and stored until analytical determination at laboratory.
Before oxidation, samples were bubbled with high purity oxygen/nitrogen gas stream during 15 min. Then a persulfate wet-oxidation was used to digest organic matter in these unfiltered samples according to Raimbault et al. (1999b). The calibration was
15
made in their range of the marine content observed in this study. Total organic nitrogen and total organic phosphorus were calculated as total nitrogen and phosphorus mi-nus dissolved inorganic nitrogen (nitrate+nitrite+ammonium) or phosphate measured on the same samples. Dissolved organic carbon (DOC), dissolved organic nitrogen (DON) and dissolved organic phosphorus (POD) were calculated from these total
or-20
ganic fractions by subtracting values of POC, PON and POP obtained on the>0.2 µm fractions (see above). Analytical accuracy of measurements was close to 5, 0.5 and 0.05µmole l−1 for DOC, DON and DOP, respectively. Deep Sargasso Sea reference
water (45µmolesC l−1
±0.5 SE, Hansell Laboratory, Bermuda biological station for re-search) was used to verify the analytical calibration. All reagents and blank reagent
25
were prepared with fresh water from a Millipore Milli-Q plus®for each set of analysis. Mean values of blank are given in Table 1.
BGD
4, 3041–3087, 2007Nutrient distribution in the South Pacific
Ocean P. Raimbault et al. Title Page Abstract Introduction Conclusions References Tables Figures ◭ ◮ ◭ ◮ Back Close
Full Screen / Esc
Printer-friendly Version Interactive Discussion
EGU
2.4 Natural abundance of particulate15N measurements (δ15N)
Water samples were drawn into 10 l polyethylene bottles, and the contents were im-mediately filtered online onto precombusted whatman GF/F filters, placed in a glass tube and immediately dried at 60◦C. Some samples were also colleted using in situ pump. Then a fraction of the glass fiber filter, corresponding to 10–15 l of seawater,
5
was treated as above. At laboratory, each filter was rolled into a pellet for analysis of the stable isotopic composition of the particulates (δ15N) carried out using a CN Integra tracer-mass. An organic standard (glycin) was used for calibration of PN mea-surements and for tracking the consistency of the Dumas combustion. In addition, two NIST-certified organic15N reference materials (IAEA 310 A δ15N=47‰; IAEA 310 B,
10
δ15N=245‰) were used to assure the accuracy of the isotopic measurements. The values found during these analysis were 47.3±0.27‰ and 243±0.46‰ for AIEA310 an AIEA 310b, respectively. Analytical precision determined with these reference ma-terials is 0.03‰. The reference standard is atmospheric N2 gas (15N/14N=0.003663: δ15N=0‰).
15
The depth of the euphotic zone (Ze), representing the depth where the irradiance is reduced to 1% of its surface value, was computed using the in situ TChla concentration profiles (see Ras et al., 20071) according the model developed by Morel and Maritorena (2001). Data shown throughout the paper are limited to the 0–300 m water column.
1
Ras, J., Claustre, H., and Uitz, J.: Spatial variability of phytoplankton pigment distribu-tions in the subtropical South pacific Ocean: a comparison between in situ and modelled data, Biogeosciences Discuss., in preparation, 2007.
BGD
4, 3041–3087, 2007Nutrient distribution in the South Pacific
Ocean P. Raimbault et al. Title Page Abstract Introduction Conclusions References Tables Figures ◭ ◮ ◭ ◮ Back Close
Full Screen / Esc
Printer-friendly Version Interactive Discussion
EGU
3 Results
3.1 Hydrological background
General distribution of temperature and salinity were presented and described in Claus-tre et al. (2007)2and in Ras et al. (2007)1. Briefly, surface temperature showed a gen-eral decreasing trend from the Marquesas (27.8◦C) site to the Chilean coasts (18◦C).
5
Surface temperature remained higher than 25◦C until 125◦W and higher than 20◦C until 100◦W. The 15◦C isotherm remained below 250 m until 100◦W, and then rapidly became shallower to reach surface along the chilean coast. Salinity pattern (Fig. 2) generally followed this of temperature with a decreasing from west (37.75) to east (34.5), but a maximum (>36.5) and a minimum (<34.25) were noted around 130◦W
10
and 90◦W, respectively. These specific waters masses are referred to as South Pa-cific Tropical Waters (SPTW) and Eastern South PaPa-cific Intermediate Water (ESPIW). The waters surrounding the Marquesas Islands (8◦–141◦W) were under the influence
of the South Equatorial current and constituted the southern border of High Nutrients Low Chlorophyll (HNL) waters of the equatorial upwelling region (Andri ´e et al., 1992).
15
The salinity ranged from 35.5–35.7 and the surface temperature reached 27.9◦C. The
Peru-Chile current, delimited by isohaline of 34.3, was associated with fresher waters, especially between 78◦W and 75◦W (salinity around 34.1).
3.2 Inorganic nutrients distribution
The distribution of major inorganic nutrients (nitrate, phosphate and silicate) is shown
20
in Fig. 2. In contrast to temperature, the deep nutrient isolines sunk from west to east until 110◦W. Thus, surface and deep concentrations for all nutrients tended to be symmetrically distributed around the center of the investigated area, with lowest
2
Claustre, H., Sciandra, A., and Vaulot, D.: Introduction to the special section: bio-optical and biogeochemical conditions in the South east Pacific late 2004 – the BIOSOPE cruise, Biogeosciences Discuss., in preparation, 2007.
BGD
4, 3041–3087, 2007Nutrient distribution in the South Pacific
Ocean P. Raimbault et al. Title Page Abstract Introduction Conclusions References Tables Figures ◭ ◮ ◭ ◮ Back Close
Full Screen / Esc
Printer-friendly Version Interactive Discussion
EGU
concentrations found in the central region (110◦W). Westward to 135◦W, the
Marque-sas region, located at the southern limit of the equatorial pacific, was characterized by rich superficial waters with nitrate concentrations higher than 1µmoles l−1. The
2µmoles l−1 isoline, indicating the start of the nitracline, was located at 55 m depth.
Phosphate was also present at significant concentrations ranged between 0.3 and
5
0.5µmoles l−1. At the east of the Marquesas island (135◦W to 130◦W), nitrate was still
detectable in surface but we observed a strong nitrate gradient with concentration de-creasing from 1 to 0.05µmoles l−1. Phosphate concentrations in surface were close to
0.2µmoles l−1. Here, nutricline was a little deeper, reaching 60–70 m. The central part
of the investigated area (South Pacific Gyre = SPG; 125◦W to 100◦W) was marked
10
by a very poor-nutrient water. Surface nitrate concentration was always lower than 0.010µmoles l−1and often undetectable in the 100 m upper layer, until 160 m between
120◦W and 110◦W. The 0.01µmoles l−1isoline became to be shallowed eastward from
108◦W and raised the surface at 96◦W, which can be considered as the eastern limit of the SPG. As for nitrate, surface concentrations of phosphate were minimal in the
15
SPG (≈0.1 µmoles l−1). But, in spite of complete nitrate-depletion, surface waters was
phosphate-repleted on the whole transect. More westward, surface nutrient concentra-tions increased rapidly reaching maximum value in the Chilean upwelling region. The isoline 5µmoles l−1 nitrate out cropped the surface at 76◦W which can be considered
as the western limit of the upwelling. The silicate distribution showed the same general
20
pattern as the one for nitrate, although superficial concentrations along the transect were less variable, ranging from 1 to 2µmoles l−1, and up to 10µmoles l−1 in the
up-welling. Concentrations were lowest in the SPG, but always close to 1µmoles l−1.
Thus, as for phosphate, complete silicate-depletion was never observed.
Regenerated forms of nitrogen, such as nitrite and ammonium (Fig. 2) showed
partic-25
ular distribution patterns characterized by the presence of subsurface maxima located at each extremity of the transect. Nitrite was generally no detectable or present at very low levels in surface (<0.05 µmoles l−1), except in the upwelling region where
max-BGD
4, 3041–3087, 2007Nutrient distribution in the South Pacific
Ocean P. Raimbault et al. Title Page Abstract Introduction Conclusions References Tables Figures ◭ ◮ ◭ ◮ Back Close
Full Screen / Esc
Printer-friendly Version Interactive Discussion
EGU
imum was located around 120 m depth in the west part, with concentrations reaching 0.5µmoles l−1. This subsurface maximum disappeared in the SPG (between 120◦W
and 105◦W) and only some traces of nitrite (<0.05 µmoles l−1) were detected far below
the euphotic zone (200 m), associated with the isoline 0.5µmoles l−1 nitrate. Then, a
second maximum, located around 150 m depth, took place from 100◦W. But, in
con-5
trast to the western maximum, nitrite concentration rarely reached 0.5µmoles l−1 and
remained close to 0.25µmoles l−1, except in surface upwelling waters. Whatever the
depth of the nitracline (depth where nitrate ranged between 0.01 and 0.05µmole l−1),
the primary nitrite maximum was about 10 to 20 m deeper than the top of the nitracline. Ammonium concentrations followed the same general trend. Highest
concentra-10
tions (up to 0.5µmoles l−1) were located at subsurface in the Marquesas zone, but the
maximum was shallower than the nitrite maximum (100 m instead of 150 m). High surface concentrations (>0.3 µmoles l−1) were also measured in this region. The
SPG was characterized by no detectable ammonium concentration in the most part of the superficial layer. A very weak and narrow maximum, with trace concentrations
15
of ammonium (0.010µmoles l−1), can be detected around 180 m, more or less
as-sociated with the narrow nitrite maximum. The western ammonium maximum was also located just above the nitrite maximum. Concentrations ranged from 0.25 to 0.3µmoles l−1. The eastern border of the SPG was also characterized by a deep
am-monium maximum (80–100 m), with values lower than those observed in the western
20
region (<0.25 µmoles l−1). The upwelling area was marked by surface concentrations
>0.25 µmoles l−1. Then, concentrations of both regenerated nitrogen forms followed
similar trend than macronutrients, with “hot spots” in the west and in the east of the investigated transect. The SPG was entirely N-depleted, indicating low activity of nitro-gen renitro-generation or a tight coupling between renitro-generation and uptake by phytoplankton
25
BGD
4, 3041–3087, 2007Nutrient distribution in the South Pacific
Ocean P. Raimbault et al. Title Page Abstract Introduction Conclusions References Tables Figures ◭ ◮ ◭ ◮ Back Close
Full Screen / Esc
Printer-friendly Version Interactive Discussion
EGU
3.3 Biomass distribution
Vertical distributions of biomass are shown in Fig. 3 in terms of total chlorophyll a, (TChl a), particulate organic carbon (POC), particulate organic nitrogen (PON) and particulate organic phosphorus (POP). In situ chlorophylla, in accordance with ocean color imagery, showed considerable variations across the South pacific. TChla
distri-5
bution and levels are quite equivalent to those found by Ras et al. (2007)1using HPLC procedure, with the extremities of the transect revealing the highest biomass located in surface, while very low chlorophyll levels were measured at the center of the SPG. The lowest concentration (0.023µg l−1) was found in surface at 114◦W, value close to
the lowest also measured at this site (0.017µg l−1) by Ras et al. (2007)1. By contrast,
10
in the vicinity off the Marquesas Islands surface Tchla was ten fold higher (0.3 µg l−1), value a little higher than generally observed in the subequatorial area at other peri-ods of the years (Signorini at al., 1999). In the upwelling of Chile, surface Tchla was much higher (up to 3µg l−1). The SPG was also characterized by a deep chlorophyll
maximum (DCM) located at 160 and 180 m between 120◦W and 100◦W. A
progres-15
sive rising of the DCM was observed eastward and westward, which returned toward the surface at the Chilean upwelling, but was restricted to the 50 m depth in the Mar-quesas area. While the DCM was generally found just above the depth of 1% light penetration in the Marquesas area as well as eastward of 110◦W, the entire DCM was far below the limit of the photic zone in the SPG. Within this DCM, chlorophyll
concen-20
trations comprised in a narrow range (0.15 to 0.20µg l−1) whatever the depth; and no
significant relationship was found between the depth of the DMC and its chlorophyll concentration.
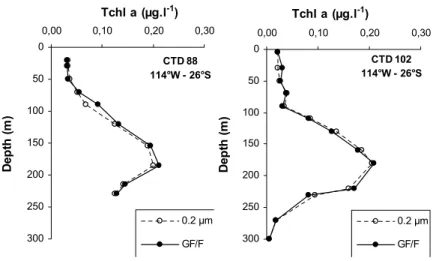
Some previous works have suspected the inefficiency of GF/F filters to collect all the chlorophyll particles, especially in very oligotrophic waters (Dickson and Wheeler,
25
1993). The present investigation in one of the most oligotrophic areas of the world offers the possibility to verify the GF/F efficiency. Two comparison profiles performed in the most oligotrophic site (114◦W and 26◦S) clearly demonstrated than precombusted
BGD
4, 3041–3087, 2007Nutrient distribution in the South Pacific
Ocean P. Raimbault et al. Title Page Abstract Introduction Conclusions References Tables Figures ◭ ◮ ◭ ◮ Back Close
Full Screen / Esc
Printer-friendly Version Interactive Discussion
EGU
GF/F filters are as efficient as 0.2 µm Teflon membrane (Fig. 4) for the determination of chlorophyll concentrations, even in very poor oceanic waters dominated by small pico-phytoplankton (Grob et al., 2007). This observation contradicts Dickson and Wheeler’s results and confirms those of Chavez et al. (1995) that GF/F filter presents adequate properties to collect TChla in open oligotrophic ocean.
5
Biomass in terms of particulate carbon, particulate nitrogen and particulate phos-phorus collected on 0.2µm membranes (Fig. 3) showed very different patterns than chlorophyll. Marquesas and upwelling areas appeared again as the richest regions with superficial concentrations of POC, PON and POP higher than 6, 1 and 0.05µmoles l−1,
respectively. The SPG revealed very low values over the whole water column (POC
10
<4 µmoles l−1, PON<0.5 µmoles l−1, POP<0.02 µmoles l−1) with no pronounced
sub-surface maximum as observed for chlorophyll. The eastward part of the SPG (between 110◦W and 90◦W) appeared richer than the western part, with POC, PON and POP higher than 5, 0.5 and 0.025µmoles l−1, respectively. While surface concentrations
were higher near Marquesas Islands and in the upwelling region than in the SPG,
dif-15
ferences were less than twofold, however, compared with the tenfold and thousandfold difference in surface TChla and nitrate concentrations, respectively. Depth distribu-tions of POC, PON and POP were uniform over the photic zone, lacked pronounced subsurface maxima, but shown a characteristic decrease at the bottom of the euphotic zone. Particulate carbon and particulate nitrogen collected on GF/F filters described
20
the same geographical pattern (Fig. 3). Maximum biomass was found in surface up-welling waters and in the vicinity of Marquesas regions, while a homogeneous vertical distribution was observed in the SPG.
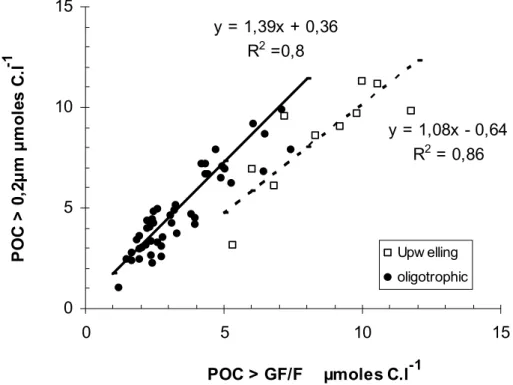
The difference between >0.2 µm and >GF/F estimates was compared by calculating the geometric mean models II regression, which take into account the measurements
25
errors in both variables. Results obtained from upwelling waters appeared significantly different from others (Fig. 5) and were treated separately. On average, >0.2 µm POC and PON were 1.38, 1.24 times higher than the corresponding GF/F estimates (Ta-ble 2). In some cases, the underestimation could reach 50% in the SPG. For N-repleted
BGD
4, 3041–3087, 2007Nutrient distribution in the South Pacific
Ocean P. Raimbault et al. Title Page Abstract Introduction Conclusions References Tables Figures ◭ ◮ ◭ ◮ Back Close
Full Screen / Esc
Printer-friendly Version Interactive Discussion
EGU
water from the upwelling, the linear regression slope were not significantly different from 1, indicating no significant biomass lower than GF/F.
Pooling all the data, the relationship between POC versus PON and POC versus POP were close to the Redfield ratio for the>0.2 µm fraction as well as for the GF/F fraction (Table 2).
5
However, intercepts of the regression equations for 0.2µm and GF/F compari-son show that <GF/F particles have C/N ratio a little higher than the Redfield value (0.36/0.04=9). Consequently, <GF/F particulate matter was essentially rich-carbon and no-containing chlorophyll particles. Using the rates of photosynthesis and nitrogen uptake (Raimbault and Garcia, 2007), we can calculate the residence time of PC and
10
PN collected on GF/F filters in the photic zone (Fig. 6a) as proposed by Copin-Mont ´egut and Copin-Mont ´egut (1978). Average residence times less than 10 days were found in the Marquesas Island and around 4–5 days in the upwelling, while values increased to more than 30 days in the SPG. It would be noted that turn over time of carbon appeared 10 to 15% higher than those of nitrogen. Using POM vs TChla relationships (Table 2),
15
the turnover time of photosynthetic particles, which contained chlorophyll, can be esti-mated (Fig. 6b). In this case, residence times were close to 1 day in the upwelling, 2 to 3 days in the Marquesas sector and ranged from 4 to 6 days in the SPG.
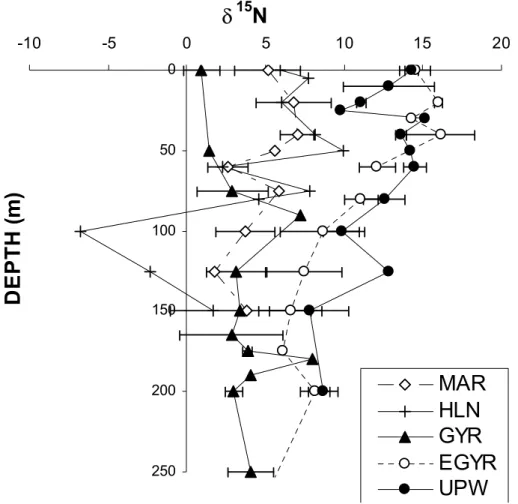
The distribution of natural abundance of15N isotope (δ15N) could provide some in-formation of the origin of this organic matter. The abundance of the rare stable isotope
20
of nitrogen (15N) has therefore been widely employed in studies on the N cycle in the oceans (Wada and Hattori, 1991), since differences in the natural abundance15N:14N ratio (0.3663%) among organic matter pools can be used to constrain the source ma-terials from which they were derived. The total range in theδ15N of suspended particu-late materials collected on GF/F filters varied greatly in the superficial layer but seemed
25
to display coherent patterns with trophic gradient (Fig. 7). The west part of the tran-sect (MAR and HNL sites) showed typical values of 5–6‰ for marine phytoplankton in oceanic regions that are not strongly affected by upwelling or derived N-inputs (Altabet and McCarthy, 1986). This value was close to those ofδ15N-NO3(6.5) reported in the
BGD
4, 3041–3087, 2007Nutrient distribution in the South Pacific
Ocean P. Raimbault et al. Title Page Abstract Introduction Conclusions References Tables Figures ◭ ◮ ◭ ◮ Back Close
Full Screen / Esc
Printer-friendly Version Interactive Discussion
EGU
central Pacific (Liu and Kaplan, 1989). Large negative values were found in deep wa-ter around (140◦W) associated with high nitrite and ammonium concentrations (Fig. 2).
This could be due to biological utilization of regenerated nitrogen generally character-ized by negative isotope fractionation (Hoch et al., 1992), since ammonium excreted by zooplankton is depleted in15N (Checkley and Miller, 1989). The Central South Pacific
5
Gyre was characterized by low positiveδ15N, close to 2‰, which approximates signa-ture of enhanced dinitrogen fixation (Minagawa and Wada, 1986; Dore et al., 2002). The highestδ15N values (up to 15‰) were found in the upwelling area. These values overlapped those generally observed in oceanic waters, indicating the use of nitro-gen source well enriched in 15N isotope. In fact, it is well known thatδ15N in nitrate
10
pool increases when concentration decreases, because of the more rapid utilization of the light isotope14N, which is preferentially assimilated during photosynthesis than the heavy isotope. Consumption of nitrate during the early step of the upwelling, when diatoms grow actively, should be accompanied by significant isotopic fractionation lead-ing to large increase ofδ15N (up to 30‰), when residual nitrate reach 10 to 20% of the
15
initial concentration (Montoya and Mc Carthy, 1995). Then, phytoplankton using this residual15N-enriched nitrate for growth, as occurred in offshore upwelling water sam-pled during this study, could present a heavier nitrogen signature. Another explanation could be the biological use of enriched15N–nitrate coming from the denitrification layer, sinceδ15N in nitrate pool can reach 20‰ during this process (Cline and Kaplan, 1975).
20
3.4 Distribution of dissolved organic nutrients
The vertical sections of dissolved organic matter (DOM) in terms of dissolved or-ganic carbon (DOC), dissolved oror-ganic nitrogen (DON) and dissolved oror-ganic phos-phorus (POD) are shown in Fig. 8. The main feature was the high DOC concentration (>100 µmoles l−1) exhibiting a patchy maximum in the superficial layer (0–150 m) in
25
the SPG (between 125◦W and 100◦W). This DOC concentration was a little higher than this measured in surface waters of the upwelling (around 100µmoles l−1). The
BGD
4, 3041–3087, 2007Nutrient distribution in the South Pacific
Ocean P. Raimbault et al. Title Page Abstract Introduction Conclusions References Tables Figures ◭ ◮ ◭ ◮ Back Close
Full Screen / Esc
Printer-friendly Version Interactive Discussion
EGU
Classical low DOC values (<60 µmoles.l−1) were measured at depth below 70 m in
the Marquesas and upwelling regions, and only below 250–300 m in the central re-gion. The DOC concentrations in deeper waters (>500 m) presented no significant variations (47±5 µmoles l−1) and were consistent with values found in various oceanic regions (Hansell and Carlson, 1998). The lowest value (42.7µmoles l−1) was
mea-5
sured at 3000 m (114◦W–26◦S). DON concentrations were rather uniformly distributed
in the photic layer and any subsurface maximum was observed. The general pattern of DON showed no significant geographical variation with concentration ranging from 5.5 to 6µmoles l−1over the 0–150 m water column, except in the upwelling where
con-centrations reached 9µmoles N l−1 near the surface. Classical low residual
concen-10
trations (<4 µmoles l−1) were measured below 250 m depth. The lowest value (2.7–
3µmoles l−1) was measured below 1200 m. DOP showed a more variable distribution
with two marked maxima (>0.2 µmoles l−1) in the east edge of the SPG and in the
upwelling. Elsewhere, superficial values ranged between 0.10 and 0.15µmoles l−1.
Isolines 0.1 was generally located around 20 m depth except in the upwelling region
15
where it reached 100 m. DOP decreased rapidly below 250 m to become abruptly un-detectable. Contrary to carbon and nitrogen, phosphorus is more quickly liberated from dead material (Menzel and Ryther, 1964; Clark et al., 1999). As a consequence, in the open ocean, the proportion of detrital P in phosphorus pool is low (Faul et al., 2005), and no DOP was measured in deep waters. Due to total depletion of inorganic
nitro-20
gen, DON accounted for almost 100% of nitrogen in surface water of the SPG, while DOP accounted for 20 to 50% of total phosphorus.
Another view of the geographical distribution of major biogeochemical parameters can be given by the pattern of integrated values (Fig. 9). Considering that a great part of organic material was present below the euphotic zone, the choice of the 1%
25
LPD as the limit for the integration might lead to underestimations of areal contents, especially in the SPG. Then integrated values are performed both over the euphotic zone (Ze) and over 1.5 Ze. The distribution of integrated nitrate confirms the main characteristic of the SPG, e.g. a complete depletion of inorganic nitrogen. Integration
BGD
4, 3041–3087, 2007Nutrient distribution in the South Pacific
Ocean P. Raimbault et al. Title Page Abstract Introduction Conclusions References Tables Figures ◭ ◮ ◭ ◮ Back Close
Full Screen / Esc
Printer-friendly Version Interactive Discussion
EGU
over Ze was close to zero between 130 and 100◦W. Even the integration over 1.5 Ze
remained generally lower than values observed in the photic zone of the upwelling as well as in the Marquesas area. Integrated chlorophyll followed the same geographical trend, with very low value in the SPG, where Ze integration was lower than 10 mg m−2.
It would be noted that a great part of chlorophyll (up to 50%) was located below the
5
1% light depth, except in the upwelling and Marquesas regions. Consequently, in the SPG, integrated Tchla over 1.5 Ze was twofold higher than content over Ze. In contrast to nitrate and chlorophyll, integrated particulate organic matter (in terms of POC, PON and POP) did not show a clear geographical gradient. Integrated values over Ze, as well as over 1.5 Ze, remained more or less constant along the transect, except in the
10
upwelling system, where values significantly increased. The ranges were 400–500, 50–75 and 2–4 mmoles m−2 for POC, PON and POP, respectively. In the upwelling, contents increased significantly reaching 900, 180 and 10 mmoles m−2 for POC, PON
and POP, respectively. The difference between Ze and 1.5 Ze integration was only noticeable in the SPG.
15
In opposite, integrated contents of dissolved organic carbon (ΣDOC), dissolved or-ganic, (ΣDON) as well as dissolved organic (ΣDOP), showed lowest values in upwelling and Marquesas regions (5000, 500 and 15 mmoles m−2, for ΣDOC, ΣDON and ΣDOP over the photic zone, respectively). The highest values were measured in the centre of the gyre between 115 and 105◦W, where ΣDOC, ΣDON and ΣDOP over Ze reached
20
15000, 900 and 30 mmoles m−2, respectively. Then integrated content over the photic layer of inorganic and organic dissolved nutrients showed a clear opposite trend in the South Pacific.
4 Discussion
The BIOSOPE transect crossed the central region of the South pacific gyre, while
ex-25
treme stations are influenced either by Marquesas Islands or Chilean upwelling. As initially expected by satellite imagery the Central South Pacific Gyre is a very
olig-BGD
4, 3041–3087, 2007Nutrient distribution in the South Pacific
Ocean P. Raimbault et al. Title Page Abstract Introduction Conclusions References Tables Figures ◭ ◮ ◭ ◮ Back Close
Full Screen / Esc
Printer-friendly Version Interactive Discussion
EGU
otrophic area (Claustre and Maritorena, 2003), characterized by a strong depletion of inorganic nitrogen and very low phytoplanktonic biomass. Since the development of sensitive analytical procedure, it has been shown that nitrate concentration of subtrop-ical surface waters over much of the world ocean including the subtropsubtrop-ical gyres, is of-ten at sub-micromolar concentrations (3 to<50 nmoles l−1). Using a chemiluminescent
5
method Garside (1985) and Eppley et al. (1990) previously found nitrate concentrations <10 nM in the Sargasso Sea and in subtropical Pacific. These concentrations, which would be depleted in a few hours by the ambient assemblages of phytoplankton, were low but not zero. For these authors, these residual concentrations were kept greater than zero due to some physical processes as atmospheric input and night-time
convec-10
tion. We could assume that all of these processes occur at very low rates in the South Pacific Gyre (SPG) leading to a permanent and complete nitrate depletion (nitrate con-tent over the photic was close to 0µmoles m−2). More, top-down wind–driven mixing
of the water column seldom deepens the mixed layer below 100m, and measurable increases of nitrate concentrations in surface waters are certainly improbable over the
15
year in the SPG, since nitracline was located below 160 m.
In the same manner, the very low concentration of nitrite and ammonium, as well as the lack of significant subsurface maximum, as generally found in all stratified system, was unexpected. It has been hypothesized that subsurface ammonium maxima are produced by local imbalances between ammonium regeneration and uptake, caused
20
by active regeneration at the base of the photic zone where ammonium uptake by the phytoplankton is inhibited by low light. In the present case, ammonium concentra-tion below the detecconcentra-tion limit could attest to the lack of regeneraconcentra-tion activity, or a tight coupling between regeneration and ammonium uptake and ammonium oxidation (=ni-trification). Brandhorst (1958) and Wada and Hattori (1971) suggested that nitrite
orig-25
inates from bacterial oxidation of ammonia. Vaccaro and Ryther (1960) first proposed that the appearance of nitrite near the nitracline would be caused by the reduction of nitrate by phytoplankton. Reasoning from laboratory experiment (Raimbault, 1986) ar-gued that increases in nitrite concentration are expected when phytoplankton, starved
BGD
4, 3041–3087, 2007Nutrient distribution in the South Pacific
Ocean P. Raimbault et al. Title Page Abstract Introduction Conclusions References Tables Figures ◭ ◮ ◭ ◮ Back Close
Full Screen / Esc
Printer-friendly Version Interactive Discussion
EGU
of nitrogen, are exposed to both increased concentrations of nitrate and decrease lev-els of temperature and irradiance, as occurred at the base of the photic layer. Then, the primary nitrite maximum generally stands in a light limited regime where nitrate was abundant and can define precisely the deep layer of the euphotic zone in which light becomes a limiting factor of the primary production (Voituriez and Herbland, 1977).
5
Thus, the primary nitrite maximum widely distributed in the ocean (Vaccaro and Ryther, 1960; Olson, 1981) has often been considered as indicator of new production through phytoplankton excretion, or bacterial oxidation of organic matter, as well as a signature of the depth at which light limitation occurs (Ward et al., 1989). In return, the very low concentration of nitrite as observed at the base of the photic layer in the SPG, could
10
reveal a very low diffusion of nitrate as well as the lack of significant new production (nitrate uptake by phytoplankton) both in the DCM and in the nitracline.
In spite of the marked depletion of inorganic nitrogen leading to undetectable concen-tration over the 0–160 m water column, phosphate concenconcen-trations, while being lower than near the Marquesas Islands and Chilean coast, stayed to values>0.1 µmoles l−1
15
in the SPG. The significant amounts of phosphate in the superficial nitrate-depleted layer of this tropical region confirmed previous observations made at 150◦W and 16◦S
(Raimbault et al., 1999c). The reason for the excess of phosphate or, as well as deficit of nitrate (around 2µmoles l−1 when applying the N/P Redfield ratio) is not clear. But
it reflects the general feature of nitrate and phosphate distribution in the world ocean,
20
where nutrient-depleted waters usually contain a small residue of phosphate (Tyrell, 1999). This has led to the biologist concept that nitrate is the most limiting nutrient and that nitrogen dynamics is important for controlling phytoplankton productivity. But the geochemist point of view suggests that phosphate would be the ultimate limiting factor in aquatic systems, due to nitrogen-fixers activity which can use the available
25
atmospheric dinitrogen. This scheme has been experimentally demonstrated in lakes, but not in ocean (Smith, 1983). In return, according to this hypothesis, the residual phosphate found in the South east Pacific could attest to a very low fixation of nitrogen, although available inorganic phosphorus offers favorable conditions for nitrogen-fixers.
BGD
4, 3041–3087, 2007Nutrient distribution in the South Pacific
Ocean P. Raimbault et al. Title Page Abstract Introduction Conclusions References Tables Figures ◭ ◮ ◭ ◮ Back Close
Full Screen / Esc
Printer-friendly Version Interactive Discussion
EGU
In fact lowδ15N in POM confirms that nitrogen fixation is an important process in the SPG, but certainly acting at too low rates (Raimbault and Garcia, 2007) to drive phos-phate depletion. It would be noted that nitrate/phosphos-phate ratio stayed to value less than the Redfield’s constant of 16 (Redfield et al., 1963) until 400–500 m depth, indi-cating that deep reservoir of nutrients was also nitrogen deficient. The eastern Pacific
5
Ocean near the Chilean coast is one of the major areas of denitrification in the world oceans (Codispoti et al., 1976). Deutsch et al. (2001) argue that denitrification inside the oxygen minimum zone of the Peru-Chilean upwelling generates nitrogen-deficient waters which carries a surplus of phosphorus. Due the isolation of the SPG, nutrient input to the euphotic zone appears thus to be mainly through diffusive process, which
10
in this case could bring nitrate and phosphate in a low N/P ratio (around 12–13). This observation suggests that the biological utilization of deep nutrients by phytoplank-ton with a typical N:P requirements of 15.5, would decrease nitrate:phosphate ratios to very low values. Our field data closely fit well such a theoretical removal of nutri-ents (Fig. 10), suggesting that phytoplankton consumption of N-deficient nutrient pools
15
would be probably the cause of such phosphate residual value (≈0.1 µmoles l−1) in the photic layer.
The nitrate/silicate ratio was generally ranged between 1 and 4 over the whole tran-sect except in the SPG, where nitrate depletion leads to ratio close to 0. High ni-trate/silicate ratio (>5 and up to 8) was observed in the low salinity tongue located
20
at 95◦W. In comparison to the Redfield ratio and to the phytoplankton requirement
(Flemming, 1939), these values indicate a deficit of silicate relative to nitrate (when de-tectable) in the 0–300 m superficial layer and especially in the euphotic zone. A strong deficit in silicate was noticeable in the western part near the upwelling zone. Accord-ing to elemental composition of the diatoms, characterized by nitrogen/silica ratio of 1
25
(Brzezinski, 1985), it can be expected that the diatoms uptake the nutrients from sur-rounding waters with a similar ratio. Thus, values of nitrate/silicate higher than 1 may imply a silicate-limitation.
BGD
4, 3041–3087, 2007Nutrient distribution in the South Pacific
Ocean P. Raimbault et al. Title Page Abstract Introduction Conclusions References Tables Figures ◭ ◮ ◭ ◮ Back Close
Full Screen / Esc
Printer-friendly Version Interactive Discussion
EGU
show the expected differences in productivity driving by the nutrient availability. The hy-per oligotrophic centre of the SPG is the clearest water of the world ocean (Morel et al., 2007) and characterized by extremely low surface Tchla concentrations (<0.03 µg l−1).
In this region, primary production was strongly nutrient limited within regard to the ab-sence of terrestrial inputs (Jickells et al., 2005) and the depth of nitracline (around
5
160–180 m). Nevertheless, the decrease in chlorophyll content between upwelling and SPG (about four fold) was much lower than the decrease in nitrate content (hundred to thousand fold). A chlorophyll maximum was always detectable with value never lower than 0.20µg l−1, at least ten fold this measured in the upper layer. The permanent
as-sociation of DCM with the nitracline gives evidence of the importance of the nitracline,
10
which appears as the rich nutrient layer the best lighted in the water column in the SPG. But pooling all the data, any correlation was found between magnitude of DCM and nutrient concentration. This could confirm that this DCM was not a maximum of biomass, but a physiological adaptation of phytoplankton to low light. This observation is confirmed by the distribution of particulate organic matter (POM). Vertical repartition
15
of POM was always more or less homogeneous without subsurface maximum layer. Except in the upwelling waters, the maximum of chlorophyll was never associated with increasing biomass in terms of carbon, nitrogen or phosphorus. Moreover, while sur-face concentrations reflected the oligotrophic conditions with lowest values in the SPG (by a factor 2), the integrated values over the photic zone did not reveal such marked
20
trophic gradient. In fact, the photic layer of the SPG contains a little less POM than the upwelling, but as much as the Marquesas areas. However, all of these oceanic regions were characterized by very different turn-over times for particulate matter, as well as by different nitrogen source as indicated natural abundance of δ15N. The SPG was char-acterized by particulate matter having very long residence time (20 days). However,
25
values found in the upwelling and the Marquesas region (5 to10 days) were close to those noted in the Central north Pacific (Laws et al., 1987) and in the equatorial Pacific (Eppley et al., 1992). The lowδ15N of PON (2‰) suggests a greater role of N2
BGD
4, 3041–3087, 2007Nutrient distribution in the South Pacific
Ocean P. Raimbault et al. Title Page Abstract Introduction Conclusions References Tables Figures ◭ ◮ ◭ ◮ Back Close
Full Screen / Esc
Printer-friendly Version Interactive Discussion
EGU
(Minagawa and Wada, 1986), whereas a higher ratio (5–6‰) indicates a greater role of nitrate in the surrounding regions. Because theδ15N remained very low throughout the photic layer in the SPG, it is clear that 1) vertical mixing does not penetrate the nitracline, and 2) primary production in the superficial layer would be essentially sup-ported by nitrogen regeneration and by N2-fixation (Raimbault and Garcia, 2007), both
5
processes which tend to lowerδ15N value.
Except in the upwelling, POC and PON collected on 0.2µm membranes were higher than those retained on GF/F filters, confirming than the use of GF/F filters tends to greatly underestimate the level of particulate matter, especially in oceanic oligotrophic waters where underestimation can reach 50% (Altabet, 1990; Libby and Wheeler,
10
1997; Raimbault et al., 2000; Fernandez and Raimbault, 2007). But, according to the good efficiency of GF/F filters to collect chlorophyll, we can postulate that the <GF/F organic matter was essentially constituted by non-chlorophyll and carbon-rich particles (POC/PON>6.6).
The last unexpected result was the large dissolved organic matter (DOM)
accumu-15
lation in the vast central region of the SPG, where we consistently observed a DOM excess in surface waters compared to underlying waters. DON and DOP concentra-tions were not different from those generally observed in oceanic waters of the Pacific Ocean (Karl et al., 1993; Raimbault et al., 1999) in spite of very low concentrations of inorganic nutrients. The organic forms of nitrogen and phosphorus appeared much
20
less “diluted” than the inorganic forms in the photic layer of the SPG. Consequently, due the large thickness of the photic layer, integarated values were higher than in surround-ing waters. In contrast, our range of DOC found in the SPG (>100 µmoles l−1)
over-lapped concentrations generally observed in surface oceanic waters and was about 10 to 20% higher than maximal values reported for the North Pacific Gyre (Church
25
et al., 2002). But levels higher than 100µmoles l−1 (up to 140µmoles l−1) have been
previously reported in the North Atlantic (Kepkay and Wells, 1992), while in this case, high DOC concentrations were associated with very high chlorophyll concentrations (>10 µg l−1). The marked geographical gradient suggests that a net in situ source
ex-BGD
4, 3041–3087, 2007Nutrient distribution in the South Pacific
Ocean P. Raimbault et al. Title Page Abstract Introduction Conclusions References Tables Figures ◭ ◮ ◭ ◮ Back Close
Full Screen / Esc
Printer-friendly Version Interactive Discussion
EGU
ists, mainly attributed to biological processes since this DOC accumulation was close to the surface layer and associated with the maximum primary production (Raimbault and Garcia, 2007). This excess, much higher than the total particulate organic con-tent, was greatest in the west edge of the SPG, associated with a high turn over rate of POM. The C:N ratio of the particles little varied along the transect, always ranging
5
between 5 to 7. In contrast, the global relationship between DOC and DON was sig-nificantly higher (DOC=10.14 DON+0.31; r2=0.35; n=250). Excluding old recalcitrant DOM (43µmoles l−1 DOC, and 3µmoles l−1 DON), C/N ratio of the “freshly formed
DOM” (excess DOM in surface water relative to deep water) was around 16–23, which is close to the range (20–23) found in the North Pacific by K ¨ahler and Koeve (2001)
10
and Karl and Tien (1997). In short, DOM with C:N ratio far above the Redfield’s value (low-N DOM or C-rich DOM) was accumulated in surface water with magnitude that increases towards the center of the gyre, e.g. with the degree of N-depletion.
It has been assumed that the bulk of DOC (as well as DON and DOP) has its funda-mental origin in surface ocean waters via such processes as phytoplankton excretion,
15
lysis or solubilization of living and detrital particulate organic matter, and sloppy feeding at various trophic levels. Therefore this DOC concentration is the result of a large ar-ray of production, consumption and transformation processes due to biological activity (Williams, 1975). Phytoplankton is the major producer (Biersmith and Benner, 1998) releasing 5–10% of the total photosynthetic carbon production under rapid growth
con-20
ditions, and considerably more under nutrient limited growth, because carbon fixation may exceed incorporation into cell material (Borsheim and Myklestad, 1997). DOC pro-duction is as well influenced by the phytoplankton community composition (Biddanda and Benner, 1997) and is greatly enhanced by grazing of protists and copepods (Strom et al., 1997). Biological release of DOC and DON during field experiments has been
25
reported for different types of marine waters (Karl et al., 1998; Bronk and Glibert, 1993, 1994; Bronk et al., 1994; Raimbault et al., 1999b; Fernandez and Raimbault, 2007). In a tightly coupled system with a rapid turn over, a fraction of this DOC is labile and will fuel heterotrophic and photo-heterotrophic production. But, on longer time scales,
BGD
4, 3041–3087, 2007Nutrient distribution in the South Pacific
Ocean P. Raimbault et al. Title Page Abstract Introduction Conclusions References Tables Figures ◭ ◮ ◭ ◮ Back Close
Full Screen / Esc
Printer-friendly Version Interactive Discussion
EGU
biological production and accumulation of DOC and DON seem evident in oceanic re-gions (Avril, 2002; Libby and Wheeler, 1997), processes which would be favored by nutrient depletion (K ¨ahler and Koeve, 2001). In seasonal studies of the dynamics of in-organic and in-organic nitrogen, Buttler et al. (1979), Maita and Yanada (1990) and Libby and Wheeler (1997) found an inverse relationship between nitrate concentration and
5
DON in the English channel, the subarctic Pacific water, and in the Equatorial Pacific, respectively. Zweifel et al. (1993) showed that the addition of nutrients to samples from a nutrient-depleted system promoted DOC breakdown, which at the same time means that the lack of nutrients favors its preservation. Cauwet et al. (2002) reported that during nutrients deficiency, bacteria seem to be unable to utilize a carbon-rich
or-10
ganic substrate like carbohydrates. Therefore as suggested by Thingstad et al. (1997) and Tanaka and Rassoulzadegan (2002), this surface accumulation DOC might be an indication of long term malfunctioning microbial loop; it could be related to a bacteria-phytoplankton competition for inorganic nutrient that reduced DOC remineralization in this nutrient-depleted water.
15
According to the well-known diagram of Eppley and Peterson (1979), the annual new production must balance the organic particles flux from the euphotic zone to the deep waters. Then, particulate export in the sea is traditionally considered to vary with new production, increasing with the input of nitrate from deep water that penetrates trough the nitracline. Under ecological conditions where large amounts of DOM are
20
produced in response to inorganic nutrient limitation, such as those described in this study, the traditional particulate matter biological pump may be completed with an ex-port of dissolved matter (Copin-Mont ´egut and Avril, 1993; Carlson et al., 1994), with numerous implications for production sequestration (Toggweiller, 1989). Several stud-ies in oceanic environments have shown DOC accumulation over the productive period
25
in the upper column water where it homogenized. Then, this DOC, accumulated from summer to fall, disappeared from the surface layer during destratification and winter mixing (Copin-Montegut and Avril, 1993; Carlson et al., 1994). As horizontal advection can be neglected in the centre of the SPG and intense seasonal convective mixing is
BGD
4, 3041–3087, 2007Nutrient distribution in the South Pacific
Ocean P. Raimbault et al. Title Page Abstract Introduction Conclusions References Tables Figures ◭ ◮ ◭ ◮ Back Close
Full Screen / Esc
Printer-friendly Version Interactive Discussion
EGU
excluded, the SPG seems to be able to maintain a high DOC concentration and ap-pears like a very large and long-term reservoir of biological carbon. Another way for DOC transfer is the diffusive mode, which much prevails in this permanent stratified water. Assuming that the flux of nutrient (inorganic or inorganic) into or out the mixed layer is linearly related to the gradient (δnutrient/δz, units = µmolm−4) at the bottom
5
of the mixed layer by a vertical diffusion coefficient (Kz; units = m2d−1), we can calcu-late diffusive vertical fluxes (Fnutrients; unitsµmolm−2d−1) using the following equation:
Fnutrient=Kz. δNutrient/δz.
Kz is the diffusion coefficient obtained from the following equation: Kz=0.24 ε/N2, whereε (units, m−2s−3) is the turbulent kinetic energy dissipation and N (units,s−1)
10
is the buoyancy (Br ¨unt-V ¨ais ¨al ¨a) frequency (Oakey, 1982). Values forε as well as for Kz are rarely experimentally available, especially in oceanic waters. But, assuming the only nitrate source for phytoplankton growth comes from deep water by turbulent diffusion, we can consider that the biological nitrate uptake equal to this diffusive flux, as suggested by King and Devol (1979). So, using integrated nitrate uptake rate
mea-15
sured in the SPG (60µmoles m−2d−1; Raimbault and Garcia, 2007) and gradient of
nitrate at the top of the thermocline (75.4µmoles m−4), the Kz value is estimated to
(0.76 m2d−1=0.09 cm2s−1). This value agrees well with previous results from oceanic waters (Eppely et al., 1979; King and Devol; 1979; Lewis et al., 1986) ranging from 0.06 to 0.75 cm2s−1. The diffusive fluxes of inorganic and organic dissolved
nutri-20
ent in the SPG calculated with this Kz value are given in Table 3. Turbulent flux of DOC, DON and DOP are estimated to 134, 5 and 0.3µmoles m−2d−1, respectively.
These DOC and DON fluxes were quite equivalent to the particle flux measured as the same site with drifting sediment traps placed just below the photic zone (12–96µmoles C m−2d−1; 2.8–14µmoles N m−2d−1, J. C. Miquel, personal communication).
Con-25
sidering the mean primary production in SPG (0.1 g m−2d−1; Raimbault and Garcia,
2007), this assessed downward DOC flux represents a low proportion of the total pri-mary production (≈2%), but a large fraction (36%) of the new production as calculated from the integrated nitrate uptake (57.4×6.6=379 µmoles C m−2d−1). Just assuming
BGD
4, 3041–3087, 2007Nutrient distribution in the South Pacific
Ocean P. Raimbault et al. Title Page Abstract Introduction Conclusions References Tables Figures ◭ ◮ ◭ ◮ Back Close
Full Screen / Esc
Printer-friendly Version Interactive Discussion
EGU
these values are valid along the year, we deduce an annual diffusive export of 0.44 g C m−2y−1, value lower than this given by Avril (2002) for the Mediterranean sea
dur-ing the oligotrophic stratified period (1 g C m−2y−1). The global DOC export (vertical mixing + turbulent mixing) is estimated to 1.7 GT/year (Six and Maier-Reimer, 1996), value consistent with the oceanic CO2 missing sink quantified earlier by Siegenthaler
5
and Sarmiento (1993) to about 1.8 GT C y−1. According to Avril (2002) about 10% (170×106T/y−1) of this global DOC export could be due to diffusion processes. The diffusive export of the entire South Pacific gyre representing 1.1% of the global oceanic surface (4.106km2), is estimated to about 2.5×10⁶T C, and could represent about 1.5% of the global DOC diffusive flux. Assuming DOC release rates around 4 to 10%
10
of gross production, which are levels generally given in literature (Mingelbier et al., 1994), and a 2% loss by diffusion (see above), the excess of DOC in the centre of the SPG (10 000 mmoles C m−2=120 g C m−2) would correspond to an accumulation during a period of 41 to 124 years. Therefore our present calculation suggests a non negligible role of the SPG in the global biogeochemical budget of carbon, due to 1)
15
long-term storage in surface waters and 2) significant export to deep water.
5 Conclusion
As initially expected by satellite imagery the South Pacific Gyre (SPG) crossed by the BIOSOPE cruise is a very oligotrophic area, characterized by a strong depletion of inorganic nitrogen and very low phytoplanktonic biomass. The distribution of
hydrolog-20
ical parameters and inorganic nutrients clearly showed that the properties in terms of organic parameters (particulate or dissolved) varied much less than might be expected from nutrients distribution. The most important feature is the large accumulation of dissolved organic matter reflecting a specific functioning of the productivity system as well as the biological CO2pump. The SPG can store and preserve a great quantity of
25
low-N organic material in the photic layer.
BGD
4, 3041–3087, 2007Nutrient distribution in the South Pacific
Ocean P. Raimbault et al. Title Page Abstract Introduction Conclusions References Tables Figures ◭ ◮ ◭ ◮ Back Close
Full Screen / Esc
Printer-friendly Version Interactive Discussion
EGU
oceanic desert”, could be now recognized as home to a dynamic ecosystem exhibiting high accumulation of carbon-rich dissolved organic matter. The concept of new pro-duction as well as Redfield constant seems strongly affected because the dynamics of carbon was not linearly coupled with those of nitrogen. More, a great part of atmo-spheric carbon fixed by photosynthesis can be ultimately accumulated for long time in
5
the surface layer and no immediately exported, assuming no real steady-state for car-bon cycling. Consequently knowledge of both rates of DOC production and chemical composition of this accumulated pool will be necessary before accurate biogeochem-ical and metabolic models can be formulated for this ultra-oligotrophic system of the South Pacific Gyre.
10
Acknowledgements. This is a contribution of the BIOSOPE project of the LEFE-CYBER
pro-gram, funded by the Centre National de la recherche Scientifique (CNRS), the Institut des Sciences de l’Univers (INSU), the Centre National d’Etudes Spatiales (CNES), The European Space Agency (ESA), the National Aeronautics and Space Administration (NASA) and the nat-ural Sciences and Engineering Research Council of Canada (NSERC). This work is fund in part
15
by the French Research and Education Council. The Biosope cruise program was managed by H. Claustre and A. Sciandra. We thank the crew of the R/V Atalante for outstanding shipboard support operations. Data concerning Euphotic Layer Depth was kindly provided by H. Claustre and J. Ras. D. Taillez and C. Bournot are warmly thanked for their efficient help in CTD rosette management and data processing, as well as J. C. Miquel to provide particulate samples from
20
in situ pump.
References
Altabet, M.: Organic C, N and stable isotopic composition of particulate matter collected on glass-fiber and aluminium oxide filters, Limnol. Oceanogr., 35, 902–909, 1990.
Altabet, M. A. and McCarthy, J. J.: Vertical patterns in15N natural abundance in PON from the
25
surface waters of warm-core rings, J. Mar. Res., 44, 203–225, 1986.
Andri ´e, C., Bouloubassi, I., Cornu, H., Fichez, R., Perre, C., and Rougerie, F.: Chemical tracer studies in coral reef interstitial waters (French Polynesia); Implications for endo-upwelling