3rd International Conference on Bio-Based Building Materials
June 26th - 28th 2019
Belfast, UK
ID_ BBBB288
PREDITION OF DEFLECTION IN REINFORCED CONCRETE BEAMS
CONTAINING PLASTIC WASTE
A. Jahami1, J. Khatib*1, O. Baalbaki1, M. Sonebi3
1Department of Civil and Environmental Engineering, Faculty of Engineering, Beirut Arab
University, Beirut, Lebanon
3School of Natural and Built Environment, Queens University of Belfast, Belfast, UK
*Corresponding author; e-mail: j.khatib@bau.edu.lb
Abstract
Serviceability limit state is one of the required criteria that must be met in any analysis and design procedure. All concrete design codes have focused on the calculation methods for these criteria. One of these criteria is the deflection, which depend on the flexural stiffness (EI) of the studied element. Two methods for determining the effective flexural stiffness were studied: Branson’s method that was derived in 1965, and Bischoff’s method that was derived in 2005. Then these methods were used to verify an experimental work conducted for reinforced concrete beams with light weight aggregates. It has been found that the load deflection behavior of reinforced concrete beams with light weight aggregates were different from that with normal weight. A theoretical equation for each beam with lightweight aggregates was derived and compared with the real experimental curve. Finally, conclusions and recommendations were stated.
Keywords:
Deflection prediction, Flexural, Prediction, Reinforced concrete beam, Waste Plastic.
1 INTRODUCTION
Any structural design procedure needs to meet two requirements: The ultimate limit state requirements which is related to sections strength and capacity, and the serviceability limit state that is related to the workability of the section. Several examples of serviceability limit state components are: Deflection, Crack width, and vibration. Deflection is a very important component that must satisfy code limits specially for structures that contain liquids such as water or oil. The main parameters that effects the deflection id the bending stiffness of the element that is related to main components: the moment of inertia (I) and the modules of elasticity (E).
Equation 1 shows the ACI 318 [ACI 2005] equation for determining the modulus of elasticity:
𝐸𝑐= 𝑤𝑐1.5× 0.043 × √𝑓′𝑐 (1)
𝐸𝑐= 4700 × √𝑓′𝑐 (2)
Where “Ec” is the modulus of elasticity, “wc” is concrete
density, and “f’c” is the concrete compressive strength.
Equation 1 is used for light weight concrete whereas equation 2 is used for normal weight concrete.
The post elastic behavior of concrete results in the variation in the modulus of elasticity. The second moment of area is a function of the tensile strength capacity of the concrete. The concrete becomes ineffective once the tensile strength is reached and the tensile stresses will be predominantly resisted by the steel. Therefore, the second moment of area will vary
depending upon the moment where the first crack appeared. The uncracked second moment of area is given by Equation 3 as follows:
𝐼𝑢𝑐𝑟= 1 12𝑏ℎ 3+ 𝑏ℎ (𝑦′−ℎ 2) 2 + (𝑛 − 1)𝐴𝑠(𝑑 − 𝑦′)2 (3)
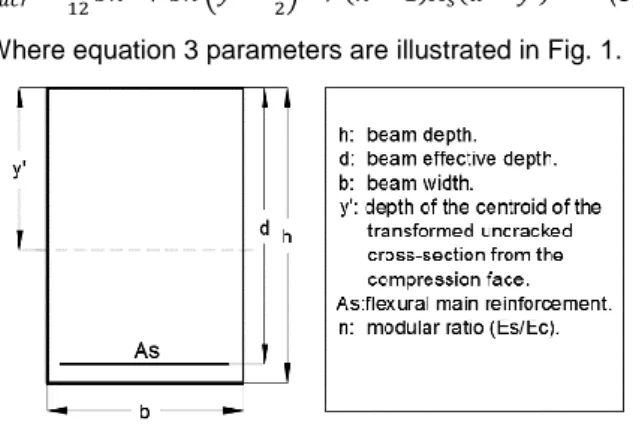
Where equation 3 parameters are illustrated in Fig. 1.
Fig. 1 Transformed area parameters for uncracked beam.
An approximated equation is used for the uncracked moment of inertia. This method neglects the effect of steel reinforcement, hence equation 3 will become: 𝐼𝑔=
1 12𝑏ℎ
3 (4)
As the applied load increases, cracks in the beam will appear and the moment is referred to as the cracking moment (Mcr). Cracks will propagate upwards till they
become fully cracked and the second moment of area will vary and can be calculated using equation (5) as follows: 𝐼𝑐𝑟= 1 12𝑏𝑐 3+ 𝑛𝐴 𝑠(𝑑 − 𝑐)2 (5)
Where equation 3 parameters are illustrated in Fig. 2.
Fig. 2 Transformed area parameters for cracked beam.
As the applied moment increases the value of cracked moment (Mcr), the moment of inertia will decrease
gradually from (Iucr) until reaching (Icr) when the section
id fully cracked. [Branson 1965] suggested an equation in 1965 that represent the value of the effective moment of inertia (Ieff) as the following:
𝐼𝑒𝑓𝑓= (𝑀𝑀𝑐𝑟 𝑎) 3 . 𝐼𝑢𝑛𝑐+ (1 − (𝑀𝑀𝑐𝑟 𝑎) 3 ) . 𝐼𝑐𝑟 (6)
This equation is adopted by ACI 318-05 [ACI 2005] , AASHTO LRFD [ASSHTO 2005], CSA A23.3-04 [CSA 2004], AS 3600 [SAA 1994] and TS 500 [TS 2000] in the immediate deflection calculations of concrete beams.
[Bischoff (2005)] and [Bischoff (2007)] suggested an equation to determine the effective second moment of area. The equation (Equation 7) was based a weighted average of the flexibilities of the uncracked and cracked portions of a reinforced concrete beam:
1 𝐼𝑒𝑓𝑓= [( 𝑀𝑐𝑟 𝑀𝑎) 2 .𝐼1 𝑢𝑛𝑐] + [1 − ( 𝑀𝑐𝑟 𝑀𝑎) 2 ] .𝐼1 𝑐𝑟 (7)
As for (Mcr) it is calculated from equation 8:
𝑀𝑐𝑟= 𝑓𝑟.𝐼𝑔
𝑦𝑡 (8)
where “yt” is the vertical distance of the extreme tension
fibers from the neutral axis.
The modulus of rupture (fr) can be calculated using
Equation (9) suggested by the ACI 318-05 [ACI 2005): 𝑓𝑟= 0.62√𝑓′𝑐 (𝑀𝑃𝑎) (9)
The purpose of this research is to compare the load deflection behavior of light weight reinforced concrete beams with the suggested equations by Branson Bischoff. Also a newly developed equation when waste plastic is suggested.
Experimental data will be taken from [Khatib et al 2019] and will be plotted against both Branson and Bischoff so it can be evaluated. In this paper we are dealing with static loading as the behaviour under dynamic blast loading would be different [Temsah et al 2018a; Temsah et al 2018b]. Also the use of other waste materials to either replace cement or aggregate in concrete will be the subject of future investigations [Baalbaki et al. 2018; Charbaji et al 2018; El-Darwish et al., 1997; El-Kurdi et
al., 2014; Herki and Khatib, 2013; Herki and Khatib,
2016; Khatib et al., 2008; Khatib et al., 2009; Khatib et
al. 2013a; Khatib et al. 2013b; Khatib et al. 2014; Khatib,
2016 ; Khatib et al., 2016; Mangat et al., 2006; Okeyinka
et al., 2015; Sonebi et al., 2016; Wright and Khatib,
2016].
Four concrete mixes were employed to study the flexural characteristics behavior of reinforced concrete beam incorporating plastic waste bottle caps [Khatib et al 2019]. The reference mix (PBC 0) had a proportion (by weight) of 1 : 3 : 3 (cement : fine aggregate : coarse aggregate and no waste plastic was used. In mixes PCB10, PCB15 and PBC 20, the coarse aggregate was partially replaced (by volume) with 10%, 15% and 20% waste plastic bottle caps (PBC) respectively. The caps have 25mm (dia) and 12mm (depth) with a thickness of about 1.5mm. All concrete mixes had the same free water to cement (W/C) ratio of 0.6. The selection of theses mixes was based on a series of trial mixes. Tab. 1 presents the details of the four concrete mixes.
Tab. 1 Details of concrete mixes
Quantity (Kg/m3)
Mix R* % Cement Water Sand Gravel PBC**
PBC 0 0 314 189 943 943 0.0
PBC10 10 314 189 943 848 31
PBC15 15 314 189 943 801 46
PBC20 20 314 189 943 745 61
*% replacement by volume of coarse aggregate with PBC
**Plastic bottle caps
The dimensions of the Reinforced concrete beams were 200mm x 300mm x 1200mm. The main (bottom) reinforcement of all beams was 3 bars mild steel and the top reinforced had two bars. The diameter of the bottom and top reinforcement was 8 mm. Only the content of PBC varied as indicated in Tab. 1. The stirrups had a diameter of 6mm and spaced at 200mm centres. Fig. 3 shows the cross sectional area of the beam and the reinforcing bars.
Fig. 3 Cross section of the beam and reinforcement.
The flexural behavior of reinforced concrete beams was experimentally assessed using the four-point test as described in a previous investigation [Khatib et al. 2015] . Fig. 4 shows the location of the supports and point loads. The load was increased in 4 kN increment and the load at first crack was noted. Then, the loading continued until failure. The mid-span deflection was
recorded at each load increment. The initiation and propagation of cracks were observed throughout the test. Fig. 5 shows the load deflection curve for all concrete beams [Khatib et al 2019].
Fig. 4 Longitudinal section of beam with supports and loads (dimensions in mm).
Fig. 5 Load-Deflection Curve for all samples [Khatib
et al 2019].
2 APPLICATION OF BRANSON AND
BISCHOFF METHODS TO THE
EXPERIMENTAL DATA
Fig. 6 to 9 shows the load deflection curve for all experimental samples compared to the equation suggested by of [Branson 1965] and [Bischoff 2005]. For the beam without plastic caps (PBC0), Both Branson and Bischoff curves match the experimental curve. Whereas for the other beams that contain plastic bottle caps, there was some difference between both Branson and Bischoff curves, and the experimental curve. It can be realized that the beams with plastic caps (PBC10, PBC15 and PBC20) have a softer behavior compared to Branson and Bischoff.
Fig. 6 Application of [Branson 1965] and [Bischoff 2005] for PBC0.
Fig. 7 Application of [Branson 1965] and [Bischoff 2005] for PBC10.
Fig. 8 Application of [Branson 1965] and [Bischoff 2005] for PBC15 0 10 20 30 40 50 60 70 80 90 100 0 20 40 60 80 100 120 Load ( K N ) Deflection (mm) PBC 0 PBC10 PBC15 PBC20 0 20 40 60 80 100 120 0 2 4 6 8 10 Lo ad ( KN ) Mid-span deflection (mm) PBC0 Uncracked Cracked Branson 1965 Bischoff 2005 0 20 40 60 80 100 120 0 2 4 6 8 10 Lo ad ( KN ) Mid-span deflection (mm) PBC10 Uncracked Cracked Branson (1965) Bischoff (2005) 0 20 40 60 80 100 120 0 2 4 6 8 10 Lo ad ( KN ) Mid-span deflection (mm) PBC15 Uncracked Cracked Branson (1965) Bischoff (2005)
Fig. 9 Application of [Branson 1965] and [Bischoff 2005] for PBC20
A modification to Branson’s formula that is adopted by the ACI code was used in the prediction. The power value of the term (Mcr/Ma) was determined and the
effective moment of inertia was replotted based on the average power value of the term (Mcr/Ma). The average
power value was 3.9 for PBC10, 5 for PBC15, and 4.2 for PBC20. Therefore, Branson’s equation becomes: For PBC10 𝐼𝑒𝑓𝑓= ( 𝑀𝑐𝑟 𝑀𝑎) 3.9 . 𝐼𝑢𝑛𝑐+ (1 − ( 𝑀𝑐𝑟 𝑀𝑎) 3.9 ) . 𝐼𝑐𝑟 (10) For PBC15 𝐼𝑒𝑓𝑓= ( 𝑀𝑐𝑟 𝑀𝑎) 5 . 𝐼𝑢𝑛𝑐+ (1 − ( 𝑀𝑐𝑟 𝑀𝑎) 5 ) . 𝐼𝑐𝑟 (11) For PBC20 𝐼𝑒𝑓𝑓= ( 𝑀𝑐𝑟 𝑀𝑎) 4.2 . 𝐼𝑢𝑛𝑐+ (1 − ( 𝑀𝑐𝑟 𝑀𝑎) 4.2 ) . 𝐼𝑐𝑟 (12)
Fig. 10 to 12 show the original experimental curve versus the theoretically derived curve for each beam sample.
Fig. 10 Experimental vs updated formula load deflection curve for PBC10
Fig. 11 Experimental vs updated formula load deflection curve for PBC15
Fig. 12 Experimental vs updated formula load deflection curve for PBC20
3 CONCLUSION
The following conclusions can be made from this study: 1. The methods proposed by Branson (1965) and Bischoff (2005) closely estimate the load deflection behavior of reinforced concrete beams.
2. The method proposed by Bischoff (2005) provides a slightly better correlation with the actual load deflection curves of reinforced concrete beams.
3. The derived formula for the beams that contain plastic caps were different from that derived by Branson. The power used in these equations were all greater than the value used by Branson which is 3.
4 REFERENCE
[AASHTO (2005)] American Association of State Highway and Transportation Officials, “AASHTO LRFD Bridge Design Specifications (SI Units)”, 3 rd Edition, Washington DC, 5.41-5.42 pp. American Concrete I [ACI (2005)] “Building Code Requirements for Structural Concrete (ACI 318-05) and Commentary (ACI R318-05)”, Farmington Hills, Michigan, 112 pp.
Baalbaki, Oussama; Abdallah, Bachar; Elkordi, Adel; Khatib, Jamal, Characterization of Thermal Treated Clay Obtained From Lebanese Local Resources as Supplementary Cementitious Materials. 1st International Conference On Urban Health & Wellbeing Uhwb, 417-422, 2018. 0 20 40 60 80 100 120 0 2 4 6 8 10 Lo ad ( KN ) Mid-span deflection (mm) PBC20 Uncracked Cracked Branson (1965) Bischoff (2005) 0 20 40 60 80 100 120 0 2 4 6 8 10 Lo ad ( KN ) Mid-span deflection (mm) PBC10 Uncracked Cracked updated formula 0 20 40 60 80 100 120 0 2 4 6 8 10 Lo ad ( KN ) Mid-span deflection (mm) PBC15 Uncracked Cracked Updated formula 0 20 40 60 80 100 120 0 2 4 6 8 10 Lo ad ( KN ) Mid-span deflection (mm) PBC20 Uncracked Cracked Updated formula
Bischoff, P. H. (2005), “Reevaluation of Deflection Prediction for Concrete Beams Reinforced with Steel and Fiber Reinforced Polymer Bars”, Journal of Structural Engineering, ASCE, Vol. 131, No. 5, pp. 752-762. Bischoff, P. H. (2007), “Rational Model for Calculating Deflection of Reinforced Concrete Beams and Slabs”, Canadian Journal of Civil Engineering, Vol. 34, No. 8, pp. 992-1002.
Branson, D. E. (1965), “Instantaneous and Time-Dependent Deflections of Simple and Continuous Reinforced Concrete Beams”, HPR Report No. 7, Part 1, pp. 1-78, Alabama Highway Department, Bureau of Public Roads, Alabama (Department of Civil Engineering and Auburn Research Foundation, Auburn University, August 1963).
British Standards Institution, BS (1985), “BS 8110-2: 1985, Structural Use of Concrete – Part 2: Code of Practice for Special Circumstances”, London, pp. 10-14. Canadian Standards Association, CSA (2004), “CSA A23.3-04: Design of Concrete Structures”, Rexdale (Toronto), Ontario, Canada.
Charbaji, M.; Baalbaki, O.; Khatib, J. M.; Elkordi, A., Characterization of Fly Ash Originated From Lebanese Municipal Solid Waste Plant. International Congress on Engineering and Architecture, Turkey. 1565-1576, Nov 2018.
El-Darwish, I.; Kurdi, A.; Mahmoud, H.; Abou El-Kair, H. (1997) Mechanical Properties and Durability of Portland Cement Concrete Incorporating ground Steel Making Slag", Alexandria Engineering Journal, 36 (1), 1-14, January.
El-Kurdi, A.A., Abdel-Hakam, A., El-Gohary, M.M. (2014) Study the effect of silica fume, polypropylene fiber, steel fiber, limestone powder and bentonite on the fire resistance of concrete. International Journal for Research and Analysis in Allied Sciences and Engineering, 1 (1), 13–29, April.
Herki, B.A. ; Khatib, J.M. (2013) Lightweight concrete incorporating waste expanded polystyrene. Advanced Materials Research Journal, 787, 131–137, Trans Tech Publications, Switzerland, ISBN: 978–3–03785–802–8, doi:10.4028/www.scientific.net/AMR.787.131
Herki, B.A. Khatib, J.M. (2016), Valorisation of waste expanded polystyrene in concrete using a novel recycling technique. European Journal of Environmental and Civil Engineering, Taylor & Francis, pp 1384-1402
Khatib, J.M., Mangat, P.S., Wright, L. (2008) Sulphate resistance of blended binders containing FGD waste. Construction Materials Journal – Proceedings of the Institution of Civil Engineers (ICE), Vol. 161, Issue CM3, August 2008, pp. 119–128. ISNN 1747–650X doi: 10.1680/coma.2008.161.3.119
Khatib, J.M., Kayali, O., Siddique, R. (2009) Strength and Dimensional Stability of Cement–Fly Ash– Metakaolin Mortar. American Society of Civil Engineers (ASCE) – Materials in Civil Engineering Journal, 21 (9), 523–528, September, ISSN 0899–1561/2009/9–523– 528, DOI: 10.1061/(ASCE)0899–1561(2009)21:9(523). Khatib, J.M.; Mangat, P.S.; Wright, L. (2013a) Early Age Porosity and Pore Size Distribution of Cement paste with Flue Gas Desulphurisation (FGD) Waste. Journal of Civil Engineering and Management, 19 (5), 622–627, Taylor & Francis, ISSN 1392–3730 & 1822–3605, doi: 10.3846/13923730.2013.793609
Khatib, J.M., Wright, L., Mangat, P.S. (2013b) Effect of fly ash–gypsum blend on porosity and pore size
distribution of cement pastes. Journal of Advances in Applied Ceramics, Structural, Functional and Bioceramics, 112 (4), 197–201, online, ISSN 17436753. Khatib, J.M., Mangat, P.S., Wright, L. (2014) Pore Size Distribution of Cement pastes Containing Fly Ash– Gypsum Blends Cured for 7 Days. Korean Society of Civil Engineering (KSCE) Journal, 18 (4), 1091–1096. doi: 10.1007/s12205–014–0136–8 Online ISSN: 1976– 3808; Print ISSN: 1226–7988
Khatib, J.M., Wright, L., Mangat, P.S. (2016) Mechanical and Physical Properties of Concrete Containing FGD Waste. Magazine of Concrete Research, Article number: MACR–D–15–00092. doi: 10.1680/macr.15.00092, Vol 68, No. 11, pp 550-560. Khatib, J.; Sustainability of Construction Materials. Woodhead Publishing Series in Civil and Structural Engineering, Publisher Woodhead Publishing, August 2016, ISBN 0081003919, 9780081003916, 742 pages. Khatib, J., Jahami, A., Elkordi, A., Baalbaki, O. (2019) Structural performance of reinforced concrete beams containing plastic waste caps. Journal of Engineering Science and Technology Review. (In progress). Khatib, J; Jefimiuk, A,; Khatib, S. (2015), Flexural Behaviour Of Reinforced Concrete Beams Containing Expanded Glass As Lightweight Aggregates, Slovak Journal of Civil Engineering, Volume 23, Issue 4, pp 1-7, Publisher: De Gruyter
Mangat, P.S., Khatib, J.M., Wright, L. (2006) Optimum Utilisation of Flue Gas Desulphurisation (FGD) Waste in Blended Binder for Concrete. Construction Materials Journal – Proceedings of the Institution of Civil Engineers, 1 (2), pp 60–68, August 2006. ISNN 1747– 650X
Okeyinka, O.M., Oloke, D.A., Khatib, J.M. (2015) A review of recycle use of post–consumer waste paper in construction. Proc. of the 1st International Conference on Bio–based Building Materials (ICBBM 2015), Eds. Amziane and Sonebi, 21–24 June 2015, Claremont– Ferrand, France. RILEM, pp. 711–717, ISBN PRO 99: 978–2–35158–154–4
Standards Association of Australia, SAA (1994), “AS 3600: Australian Standard for Concrete Structures”, Sydney, Australia, 146 pp.
Sonebi, M., Ammar, P., Diederich, P. (2016) Sustainability of cement, concrete and cement replacement materials in construction. In: Khatib, J.M. (ed.), Sustainability of Construction Materials. 2nd ed. Elsevier, pp 417–460, ISBN 978–0–08–100995–6 Turkish Standards Institute, TS (2000), “TS 500 - Requirements for Design and Construction of Reinforced Concrete Structures” Ankara, 61 pp. Wright, L.; Khatib, J.M. (2016) Sustainability of desulphurised waste materials in construction. In: Khatib, J.M. (ed.), Sustainability of Construction Materials, 2nd edition. Elsevier, pp. 685–720, ISBN 978–0–08–100995–6
Temsah, Y; Jahami, A.; Khatib, J.M., Sonebi, M. (2018), Numerical Analysis of a Reinforced Concrete Beam under Blast Loading, MATEC Web of
Conferences 149(3):02063, January 2018.DOI: https://doi.org/10.1051/matecconf/201814902063. Y. Temsah, A. Jahami, J. Khatib, M. Sonebi, Numerical Derivation of Iso-Damaged Curve for a Reinforced Concrete Beam Subjected to Blast Loading, MATEC Web of Conferences 149(3):02016, January 2018.DOI: https://doi.org/10.1051/matecconf/201814902016.

![Fig. 6 to 9 shows the load deflection curve for all experimental samples compared to the equation suggested by of [Branson 1965] and [Bischoff 2005]](https://thumb-eu.123doks.com/thumbv2/123doknet/14750849.580084/3.892.471.769.396.652/deflection-experimental-samples-compared-equation-suggested-branson-bischoff.webp)

