HAL Id: hal-01119698
https://hal.archives-ouvertes.fr/hal-01119698
Submitted on 29 Nov 2016
HAL is a multi-disciplinary open access
archive for the deposit and dissemination of
sci-entific research documents, whether they are
pub-lished or not. The documents may come from
teaching and research institutions in France or
abroad, or from public or private research centers.
L’archive ouverte pluridisciplinaire HAL, est
destinée au dépôt et à la diffusion de documents
scientifiques de niveau recherche, publiés ou non,
émanant des établissements d’enseignement et de
recherche français ou étrangers, des laboratoires
publics ou privés.
Differences between the Microbial Communities
Inhabiting the Soil Horizons of a Norway Spruce
Plantation
Stéphane Uroz, Panos Ioannidis, Juliette Lengelle, Aurélie Cébron,
Emmanuelle Morin, Marc Buée, Francis Martin
To cite this version:
Stéphane Uroz, Panos Ioannidis, Juliette Lengelle, Aurélie Cébron, Emmanuelle Morin, et al..
Func-tional Assays and Metagenomic Analyses Reveals Differences between the Microbial Communities
Inhabiting the Soil Horizons of a Norway Spruce Plantation. PLoS ONE, Public Library of Science,
2013, 8 (2), �10.1371/journal.pone.0055929�. �hal-01119698�
Differences between the Microbial Communities
Inhabiting the Soil Horizons of a Norway Spruce
Plantation
Ste´phane Uroz1,2*, Panos Ioannidis1¤, Juliette Lengelle1, Aure´lie Ce´bron3, Emmanuelle Morin1, Marc Bue´e1, Francis Martin1
1 INRA, UMR 1136 INRA, Universite´ de Lorraine ‘‘Interactions Arbres Micro-organismes’’, Centre INRA de Nancy, Champenoux, France, 2 INRA UR 1138 ‘‘Bioge´ochimie des Ecosyste`mes Forestiers’’, Centre INRA de Nancy, Champenoux, France,3 LIMOS, UMR 7137 CNRS, Universite´ de Lorraine, Faculte´ des Sciences, BP70239, Vandoeuvre-les-Nancy cedex, France
Abstract
In temperate ecosystems, acidic forest soils are among the most nutrient-poor terrestrial environments. In this context, the long-term differentiation of the forest soils into horizons may impact the assembly and the functions of the soil microbial communities. To gain a more comprehensive understanding of the ecology and functional potentials of these microbial communities, a suite of analyses including comparative metagenomics was applied on independent soil samples from a spruce plantation (Breuil-Chenue, France). The objectives were to assess whether the decreasing nutrient bioavailability and pH variations that naturally occurs between the organic and mineral horizons affects the soil microbial functional biodiversity. The 14 Gbp of pyrosequencing and Illumina sequences generated in this study revealed complex microbial communities dominated by bacteria. Detailed analyses showed that the organic soil horizon was significantly enriched in sequences related to Bacteria, Chordata, Arthropoda and Ascomycota. On the contrary the mineral horizon was significantly enriched in sequences related to Archaea. Our analyses also highlighted that the microbial communities inhabiting the two soil horizons differed significantly in their functional potentials according to functional assays and MG-RAST analyses, suggesting a functional specialisation of these microbial communities. Consistent with this specialisation, our shotgun metagenomic approach revealed a significant increase in the relative abundance of sequences related glycoside hydrolases in the organic horizon compared to the mineral horizon that was significantly enriched in glycoside transferases. This functional stratification according to the soil horizon was also confirmed by a significant correlation between the functional assays performed in this study and the functional metagenomic analyses. Together, our results suggest that the soil stratification and particularly the soil resource availability impact the functional diversity and to a lesser extent the taxonomic diversity of the bacterial communities.
Citation: Uroz S, Ioannidis P, Lengelle J, Ce´bron A, Morin E, et al. (2013) Functional Assays and Metagenomic Analyses Reveals Differences between the Microbial Communities Inhabiting the Soil Horizons of a Norway Spruce Plantation. PLoS ONE 8(2): e55929. doi:10.1371/journal.pone.0055929
Editor: Jack Anthony Gilbert, Argonne National Laboratory, United States of America Received November 6, 2012; Accepted January 3, 2013; Published February 13, 2013
Copyright: ß 2013 Uroz et al. This is an open-access article distributed under the terms of the Creative Commons Attribution License, which permits unrestricted use, distribution, and reproduction in any medium, provided the original author and source are credited.
Funding: This work was funded by the ‘‘Lorraine Region Council’’, the INRA (Institut National de la Recherche Agronomique) Center of Nancy, the French National Research Agency (ANR Metasoil, Project ANR-08-GENM-025) and the European project ‘ECOFINDER’. The funders had no role in study design, data collection and analysis, decision to publish, or preparation of the manuscript.
Competing Interests: The authors have declared that no competing interests exist. * E-mail: uroz@nancy.inra.fr
¤ Current address: Institute for Genome Sciences, University of Maryland School of Medicine, Baltimore, Maryland, United States of America
Introduction
Soil is a complex environment inhabited by a wide range of eukaryotic, prokaryotic and viral organisms. However, little is known about the diversity, functions and interactions of these organisms. It is well established that soil microorganisms actively participate in nutrient cycling through organic matter degradation [1], nitrogen cycling and mineral weathering, thus providing plants with essential nutrients [2–3]. Most of this knowledge was generated using cultivation-dependent as well as -independent approaches that generally targeted only one type of organism (i.e., fungi or bacteria), consequently yielding only a partial under-standing of the microbial soil assemblage. Notably, many of these studies showed that the functional and taxonomic diversity of soil
microbial communities are strongly impacted by environmental factors such as edaphic characteristics (pH, nutrient availability), climatic modifications and/or biotic interactions [4–7], suggesting that the soil microbial diversity may be considered good indicator of how the ecosystem is functioning.
In the last decade, pyrosequencing and Illumina-based surveys have been performed to follow this indicator and are now commonly used to determine the diversity and the distribution of the microbial communities in different environments, including grassland [8–9], farmland [10] and forest soils [11–15], sea sediments [16–18], and mine biofilms [19]. In addition to these surveys, a recent study has combined DNA and RNA based tag-encoded amplicon pyrosequencing for the first time to analyse the
diversity of the microbial communities as well as the active microorganisms in the upper layers of the soil in a spruce (Picea abies) forest [20]. This approach revealed that a potential gap exists between the presence and the activity of soil microorganisms and showed that low-abundance species could be highly active in the soil. However, although these studies produced a comprehensive view of the microbial communities based on the sequencing of marker genes such as 16S rRNA or nuclear ribosomal internal transcribed spacer (ITS) sequences, none of them examined the potential functions of the microbial communities.
In addition to determining the diversity and distribution of microbial communities in an environment using tag-encoded amplicon pyro- or Illumina-sequencing, direct shotgun sequenc-ing-based analyses provide new methods to explore the functional potentials of these complex communities and to discover novel functions. This approach was recently used to establish a catalogue of the microbial genes present in the human gut [21], or associated with leaf-cutter ants [22] and explore the metagenome of terrestrial and marine environments [14,16,23–25]. Most recently, Fierer et al. [4], Delmont et al. [26] and Mackelprang et al. [27] applied shotgun metagenomics to grassland, agricultural soils and permafrost to characterise the impact of fertilisation, seasonal changes, the vertical distribution and the response to thaw on the soil microbial communities. These shotgun post-analyses were made possible by the development of several bioinformatics tools that can be used to (i) manage the flow of generated data, (ii) compare data with specialised databases (i.e., CAZYmes [28]; MG-RAST [29]; RDP [30]), (iii) extract relevant information and (iv) open new perspectives for our understanding of the soil microbiome.
The main objectives of this study were to determine how the structure and functional abilities of the soil microbial communities are impacted by the soil forest stratification. We hypothesised that the natural decrease of available nutrients between the organic and mineral horizons as well as the difference of pH would impact the distribution of the microbial communities. To test this hypothesis, we considered the Breuil-Chenue long-term observa-tory (LTO), for which we have culture-dependant information related to the functional potentials of the microbial communities [31–33] and culture-independant information related to the distribution of the microbial communities according to their habitat location [7,12,34–35]. In order to obtain the most comprehensive view of the forest soil microbial communities, we applied in this study shotgun pyrosequencing and Illumina-based DNA sequencing to soil core replicates from a temperate and non-amended forest site (Breuil-Chenue, France). The biological replicates were collected under a Norway spruce (Picea abies) stand, considering the organic (Org-S) and mineral (Min-S) soil horizons, two horizons characterised by their different nutrient availability, C quality/quantity and root density. Because of the importance of organic matter degradation in forest soils, we focused our analysis on how carbohydrate-active enzymes (CAZymes) were distributed in these two horizons. The same soil samples were also used to quantify the fungal and bacterial communities and to determine the functional potentials of these microbial communities using enzymatic and metabolic assays.
Materials and Methods Ethics Statement
No specific permits were required for the described field studies. The study location is not privately owned or protected in any way and the field studies did not involve endangered or protected species.
Site Description, Sampling and Soil Characterisation
The Breuil-Chenue long-term observatory (LTO) is located in the Morvan (47u189N, 4u59E, France). The native forest was partially clear-cut and replanted in 1976 with mono-specific tree plantations distributed in 0.1-ha plots of different species, including the Norway spruce (Picea abies). The soil is an Alocrisol that developed on the Pierre qui Vire granite. To avoid horizontal spatial heterogeneity and to focus our analysis on the potential vertical differentiation, a small-scale sampling strategy was applied. Three adjacent soil cores (565620 cm; length 6 width 6 depth, without the litter layer), distant of 20 cm, were sampled in March 2010 under the Norway spruce trees. The separation of the organic layer (0–10 cm) and the mineral layer (10–20 cm) was performed in the lab for each biological replicate (soil core). The soil samples were sieved (2 mm mesh) and homogenised prior to enzymatic and molecular analyses for each replicate, while replicates were pooled for soil analyses.
Enzymatic Assays
To compare the functional potentials of the soil microbial communities inhabiting the organic and mineral horizons, we used a combination of metabolic and enzymatic bioassays. Briefly, 5 g of soil from each soil sample were shaken in 45 ml sterile water on an orbital shaker at 25uC. A 1021
dilution of each soil sample was then used to inoculate Ecoplate microplates (BIOLOGH). The plates were incubated at 25uC, and colour development was measured at 590 nm with a microplate reader (Bio-Rad model 550) after a 48 h incubation period. Furthermore, six enzymatic activities based on a short incubation time were measured using 2,29-azinobis-3-ethylbenzothiazoline-6-sulfonate (ABTS) as a sub-strate for laccase activity and five derivatives of methylumbellifer-one as substrates to measure the acid phosphatase, ß-glucosidase, exochitinase, xylosidase and cellobiohydrolase activities; these methods were adapted from Pritsch et al. [36]. All of the chemicals were purchased from Sigma-Aldrich (France). For the laccase test, a solution of 2 mM ABTS was prepared in sodium acetate buffer at pH 4.5. In each well of a clear flat-bottom 96-well plate (Sarstedt, Newton, NC, USA), 75ml of the diluted soil solution (1:10) was added to 75ml of 2 mM ABTS solution. After incubation at 25uC, measurements were performed at 415 nm. For the microplate assays with the methylumbelliferone substrates, 50ml of the diluted soil solution, 50ml of incubation buffer (Sodium acetate 100 mM, pH 4.5), and 50ml of the substrate solution were added to each well. After incubation, 100ml of stopping buffer (Tris 2.5 M pH 10–11) was added to the reactions. Measurements were carried out using a Victor3microplate reader (Wallac Perkin-Elmer Life Sciences, Villebon-sur-Yvette, France) with an excitation wavelength of 360 nm and an emission wavelength of 450 nm.
DNA Extraction Methods
To obtain the required amount of metagenomic DNA (mgDNA) (30mg per sample) and limit the DNA extraction bias [37–38], mgDNA was extracted from 10 g of each soil sample using two independent DNA extraction procedures. To obtain a comprehensive view and to avoid erroneous conclusions, inde-pendent biological replicates were treated for each soil horizon [39]. The first procedure was based on the MoBio PowerMax Soil DNA isolation kit (MoBio Laboratories, Carlsbad, CA, USA) with the addition of proteinase K (50 mg ml21) and lysosyme (10 mg ml21) in the first step. In the second procedure, mgDNA was extracted from soil samples using a FastDNA Spin Kit for Soil (MP Biomedicals, Solon, OH, USA) with the addition of 20 mg of Polyvinyl-polypyrrolidone (Sigma-Aldrich, France) to each soil
sample before the grinding step. The quantity and quality of the mgDNA were evaluated by agarose gel electrophoresis and with a Nanodrop 1000 spectrophotometer (Thermo Scientific, Wilming-ton, DE, USA). The mgDNA extracted by these two methods were then pooled to obtain 30mg of mgDNA for each biological replicate, resulting in 3 organic mgDNA samples (Org-S; O1 to O3) and 3 mineral mgDNA samples (Min-S; M1 to M3). The soil replicates were sequenced using a half-plate 454 pyrosequencing run (about 500,000 reads per replicate) and one Illumina lane (about 30 million reads per replicate). Pyrosequencing on the Genome Sequencer (GS) FLX Titanium 454 System (Roche) at Beckman Coulter Genomics (Beverly, MA, USA) resulted in ca 6.136106 reads that passed the length and quality criteria. Sequencing on 2 lanes of the HiSeq 2000 (Illumina) was performed by Beckman Coulter Genomics (Danvers, MA, USA) and produced 1936106filter-passed reads.
Real-time PCR Quantification of Total Bacteria and Fungi
The mgDNA was used to quantify the total bacterial and fungal communities using 16S and 18S rRNA gene-specific primers (968F/1401R and Fung5f/FF390r, respectively; [40–41]). The real-time PCR quantifications were performed in triplicate as described in Ce´bron et al. [42] and Thion et al. [43], using an iCycler iQ apparatus associated with optical system interface software (version 2.3; Bio-Rad). Amplification reactions were carried out on 1ml of template mgDNA, standard plasmids (108to 102gene copies?ml21) or water (negative control), in a volume of 20ml using iQ SYBR green Supermix (Bio-Rad). Amplification temperature profiles consisted of: 5 min at 95uC, followed by four steps of 50 cycles, 30 s at 95uC, 30 s at the primer-specific annealing temperatures (56uC and 50uC for 16S and 18S rRNA, respectively), 30 s at 72uC, and 10 s at 80uC to dissociate the primer dimers and capture the fluorescence intensity of the SYBR green. Amplification efficiencies were of 87.2 and 85% for 16S and 18S amplification, respectively. At the end, a melting curve analysis was performed from 50uC to 95uC, with a temperature increase of 0.5uC every 10 s. Melting temperature was 89uC for 16S amplicons for both horizon samples and 85.0uC and 85.5uC for 18S amplicons from mineral and organic horizons, respective-ly. The presence of PCR inhibitors was evaluated by mixing 1ml of environmental DNA with 1ml of 105copies of lambda-standard plasmid and compare to lambda-standard curve as described in Ce´bron et al. [42].
MG-RAST Analysis
Raw sequences for each horizon along with the corresponding quality values were uploaded to the MG-RAST server [29]. For the pyrosequencing sequences, the taxonomic analysis was performed using two databases: Ribosomal Data Project (RDP) (an e-value threshold of 0.01 and a minimum percentage identity of 80%) for the 16S rRNA fragments identified, and SEED (an e-value cut-off of 1e205) for all the other sequences. The default parameters of the MG-RAST were used for the taxonomic and functional assignation of the Illumina sequences. All of the Illumina reads that were shorter than 35 bases or had a median quality score below 20 were removed.
Carbohydrate-active Enzymes: Annotation and Analysis
Raw sequences of the Breuil-Chenue metagenomes (pyrose-quencing reads) were searched for carbohydrate active enzymes (CAZymes) using the CAZY database [28] reference dataset found at the CAT (CAZymes Analysis Toolkit) web service [44]. The assignation was searched against this reference dataset using protein BLAST with an e-value cut-off of 1e205.
Statistical Analyses
The effect of the origin of the soil suspensions on the enzymatic assays was determined by analysis of variance (one factor ANOVA). Quantification data from real-time PCR were com-pared as Log gene copy number between the two soil horizons through a Student-t test. To determine the taxonomic, metabolic and CAZyme differences between the organic and mineral metagenomes extracted from MG-RAST, one-factor (horizon origin) ANOVA at a threshold level of P = 0.05 and a Bonferroni-Dunn test were applied on the relative distribution values after an arcsine transformation. All statistical analyses were performed using the Superanova software (Abacus Concepts, Inc., Berkeley, CA). Taxonomic (based on the genera assigned in MG-RAST; H’T), functional (based on the functional categories assigned in
MG-RAST; H’F) and metabolic diversity (based on the Biolog
profiles; H’m) levels per biological replicate were estimated using
the Shannon index (H’). Mantel tests (10,000 permutations, Pearson correlations) were performed in XLstat2011 (Addinsoft, Paris, France) in order to test correlations between biolog, metagenomic functions and SEED genera, based on Euclidean distances dissimilarity matrices generated from scaled data.
Figure 1. Multifactorial analysis. A. Analysis of the metabolic patterns based on the Biolog EcoplateH results. In this analysis, principal component axis 1 and 2 explain most of the variance in the data cumulatively (F1 = 37.3% and F2 = 21.3%).B. Analysis of the relative proportion of the major functional categories present in the metagenomic data of the organic and mineral soil horizons. In this analysis, principal component axis 1 and 2 explain most of the variance in the data cumulatively (F1 = 72% and F2 = 8.89%). Soil metagenomes are presented as follow: red squares, biological replicates from the organic horizon; blue squares, biological replicates from the mineral horizon.
doi:10.1371/journal.pone.0055929.g001
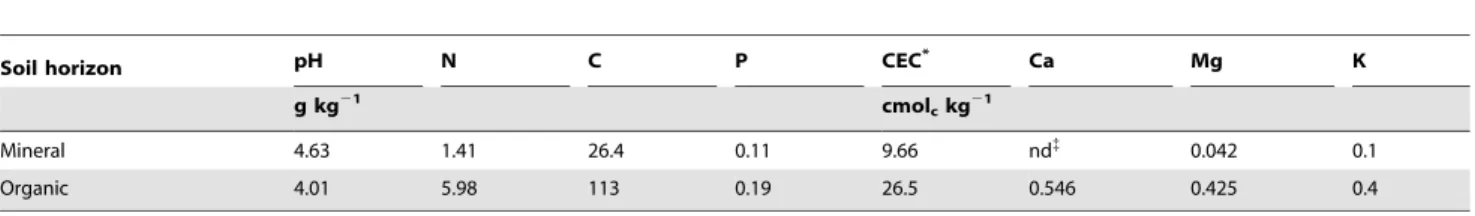
Table 1. Soil characteristics of the Norway spruce plantation of the Breuil-Chenue forest.
Soil horizon pH N C P CEC* Ca Mg K
g kg21
cmolckg21
Mineral 4.63 1.41 26.4 0.11 9.66 nd{
0.042 0.1
Organic 4.01 5.98 113 0.19 26.5 0.546 0.425 0.4
*CEC : Cation exchange capacity. {
nd: non detectable.
Nucleotide Sequence Accession Numbers
The sequences generated in this study have been deposited on the Sequence Read Archive (SRA) service of the GenBank database under the accession numbers SRA055292 (for the Illumina based shotgun soil metagenomic biological replicates), and SRA055323 (for the 454 based shotgun soil metagenomic biological replicates).
Results and Discussion
Soil Characteristics, Enzymatic Activities and Microbial Quantification
Soil analyses revealed that the organic soil horizon was more acidic (pH = 4) than the mineral horizon (pH = 4.6) and was characterised by a high level of organic and inorganic nutrients (Table 1), confirming results obtained in previous studies on the same experimental site [32,45]. Metabolic assays performed using Biolog EcoplatesH on the soil replicates revealed significant differences between the two soil horizons. The organic horizon
samples were characterized by a significantly higher metabolic based Shannon diversity index than the mineral horizon samples (metabolic diversity; Hm-organic= 2.9660.03 and H m-miner-al= 2.4760.08; P = 0.01). Among the 31 carbon sources included
in the Biolog EcoplatesH, 20 substrates related to carbohydrates, amino acids, cellulose and chitin derivatives were significantly more metabolised in the organic horizon (P,0.05) (Table S1). A multivariate analysis confirmed the differentiation of the two soil horizons according to their metabolic profiles (Figure 1A). Although the metabolic capabilities of the communities residing in the organic soil horizon were significantly higher in our experimental conditions than those of the mineral soil horizon, the most intensively metabolised substrates were different between the two horizons. L-asparagine was the most intensively metabolised substrate in the organic horizon, whereas D-mannitol was the most intensively metabolised substrate in the mineral horizon, suggesting a specialisation in response to the nutritional conditions. Similarly, all of the enzymatic assays showed that the laccase, phosphatase, glucosidase, exochitinase, xylosidase and
cellobiohy-Figure 2. Distribution of phylogenetic groups in forest soil organic (ORG-S) and mineral (Min-S) horizons. A. RDP and SEED-bases analysis. The distribution of the reads and contigs generated in this study was performed using all the annotated reads against the SEED database and the identified 16S rRNA fragments against the RDP database. B. Community comparison. The phylogenetic heatmap presented was performed using the Bray-Curtis similarity matrices generated by MG-RAST on the organic (O1,O2 and O3) and the mineral (M1,M2 and M3) metagenomic data.
doi:10.1371/journal.pone.0055929.g002
Table 2. Comparison of the organic (O) and mineral (M) metagenomes at the domain, phylum and class levels.
DOMAIN PHYLUM CLASS
O.M M.O O.M M.O O.M M.O
Bacteria** Archaea*** Proteobacteria** Firmicute** Alpha proteobacteria** Solibacteres*
Eukaryota** Bacteroidetes** Chloroflexi*** Beta proteobacteria** Delta proteobacteria***
Verrucomicrobia** Deinococcus-Thermus*** Gamma proteobacteria*** Epsilon proteobacteria** Euryarchaeota** Sphingobacteria*** Bacilli**
Chordata** Thaumarchaeota*** Cytophagia*** Chloroflexi***
Crenarchaeota*** Opitutae*** Deinococci***
Ascomycota** Chlorobi* Gloeobacteria** Chlorobia*
Thermotogae* Bacteroidia*** Thermomicrobia***
Arthropoda* Aquificae** Flavobacteria*** Archaeoglobi*
Dictyoglomi*** Aquificae**
Fusobacteria** Sordariomycetes*** Thermotogae*** Clostridia** Insecta * Fusobacteria** Dictyoglomia*** Dehalococcoidetes*** Methanococci* Thermoplasmata** Methanobacteria** Methanomicrobia** Thermococci** Thermoprotei*** Halobacteria*** *P,0.05, **P,0.005,
***P,0.0005. Identity was determined using the SEED database of MG-RAST with an e-value cut-off of 1e205.
The relative distributions of the sequences in the different taxonomic levels considered were analyzed by one-factor ANOVA (and a Bonferroni-Dunn test, P,0.05). doi:10.1371/journal.pone.0055929.t002
drolase activities detected in the soil solutions were significantly higher in the organic soil horizon (P,0.05). Interestingly, Snajdr et al. [46] also reported spatial variability of enzyme activities in the upper layers of Quercus petraea forest soil as well as modification of the microbial communities. Taken together, these data suggest that the microbial communities inhabiting the organic horizon are specialised to exploit its relatively rich and complex substrates compared to those of the mineral horizon.
Quantification of the total bacterial and fungal communities using real time PCR demonstrated that significantly more bacteria were detected in the organic horizon (4610969.76108 average gene copy number of 16S rRNA per g of soil) than in the mineral horizon (2610962.46108 average gene copy number of 16S rRNA per g of soil) (P = 0.016). Similarly, significantly more fungi were detected in the organic horizon (4.3610761.16104average copy number of 18S rRNA per g of soil) than in the mineral horizon (9.56106636103average copy number of 18S rRNA per g of soil) (P = 0.0003). Baldrian et al. [20] reported a decrease in the fungal abundance in the organic horizon compared to the litter, and with our present study, this suggests that the fungal abundance decreases from the litter to the mineral horizon. Using 454 sequencing of the fungal ITS region, Jumpponen et al. [47] reported also that community richness and diversity estimators tended to decrease with increasing soil depth. The ratio of the abundance of fungi relative to the abundance of bacteria was very low (Rmineral= 4.561023 and Rorganic= 1.0561022), indicating
that the bacteria were dominant in the ssu rRNA gene pool. Similarly, Will et al. [9] demonstrated that the microbial biomass was greater in the organic horizon than in the mineral horizon. These quantitative differences likely explain the higher enzymatic activities measured in the organic horizon.
Taxonomic Analyses
Metagenomic DNA extracted from each soil replicate was used to assess the structure and diversity of the soil microbial communities inhabiting the two soil horizons. According to the SEED database of the MG-RAST portal, the microbial commu-nities inhabiting the two soil horizons were taxonomically similar (Figure 2A and 2B). This analysis also highlighted that ca. 53% of the pyrosequencing reads had a significant match in the nucleotide databases, which corresponded to a total of 1,064,196 reads from the Min-S samples and 1,134,455 from the Org-S samples. Of these, the vast majority of the matching reads (ca. 94% for each horizon) belonged to bacteria, with a significant higher proportion in the organic horizon (Table 2), supporting the quantitative results obtained by the real time PCR (Table 3). The prevalence of bacterial sequences was also reported in other shotgun metage-nomic surveys that were performed on coral, mussels, swamps and sediments [14,16,48–49]. In these studies, eukaryotic sequences represented between 0.13 to 2% of the total set of assigned sequences.
A comparison of the bacterial communities at the phylum level, based on the clustering of data from Bray-Curtis similarity matrices (MG-RAST), demonstrated that the soil metagenomes were grouped according to their ecological origin (i.e. horizon, Figure 2B). Whatever the soil horizon considered, the five dominant bacterial taxonomic groups were Proteobacteria (45.8360.91% for Min-S and 47.7661.29% for Org-S), Fibro-bacteres/Acidobacteria (16.3760.37% for Min-S and 16.2860.37% for Org-S), Actinobacteria (11.5260.35% for Min-S and 11.4660.36% for Org-S), Firmicutes (5.5760.40% for Min-S and 4.7460.45% for Org-S), and Bacteroidetes/ Chlorobi (3.2860.30% for Min-S and 3.9260.36% for Org-S) Table 3. Summary of pyrosequencing data obtained from the soil horizons.
Mineral Organic
M1 M2 M3 Min- Pool O1 O2 O3 Org-Pool
No. of sequences 591,141 692,571 644,810 582,413 752,773 555,170 618,135 612,119
No. of sequences after QC* 411,805 534,430 511,904 544,597 621,394 433,459 507,994 569,373
Total length of sequences (Mbp) 189 246 225.5 269 290 190 219 288.5
Average length of sequences (bp) 4596119 4606104 440695 490683 466682 4386103 431699 502684
Percentage of non annotated reads
51.8 48.0 48.6 40.4 63.6 40.7 34.2 44.3
MG-RAST-assigned reads (known function with SEED)
198,683 277,809 262,940 324,764 226,080 257,071 334,247 317,057 Archaea 3930 6117 5028 3680 2465 2955 3707 6759 Bacteria 186,957 260,719 247,518 307,746 214,805 243,314 317,110 297,944 Eukaryota 1,270 1,716 1,652 2,901 1,928 2,492 3,008 1,918 Viruses 56 33 43 88 53 89 68 62 Other 6,470 9,224 8,699 10,349 6,829 8,221 10,354 10,374 MG-RAST-assigned reads (RDP) 126 155 134 170 111 213 198 157 Proteobacteria 32 41 36 50 34 79 68 54 Firmicutes 16 23 25 14 9 18 25 28 Actinobacteria 13 9 9 20 8 20 18 15 Acidobacteria 17 29 23 33 15 33 30 20 Bacteroidetes 2 5 3 7 8 28 10 3 Other Bacteria 46 48 38 46 37 35 47 37 *quality control. doi:10.1371/journal.pone.0055929.t003
(Figure 2A). Statistical analyses performed at the phylum or class levels revealed that Proteobacteria (alpha, beta- and gamma-Proteobacteria), Bacteroidetes (Bacteriodia, Chlorobia, Cytopha-gia, Flavobacteria, Sphingobacteria), and Verrumicrobia (Opitu-tae) were significantly enriched in the organic horizon. On the contrary, the mineral horizon appeared significantly enriched in sequences related to the Firmicutes (Bacilli,Clostridia), Chloroflexi (Dehalococcoidetes) and some other phyla (Table 2). Horizon-dependent abundance of certain phyla was also reported in several studies. Considering a grassland soil and replicate samples, Will et al. [9] highlighted that Bacteroidetes, Verrucomicrobia and Proteobacteria were enriched in the organic horizon and Chloroflexi in the mineral horizon, suggesting a specialisation to the relatively rich soil organic horizon. Focusing on the Verrucomicrobia, Bergmann et al. [8] reported that their relative abundance varied across soil profiles. Altogether, these results
suggest a differential distribution of the bacterial communities across the soil profile according to the available nutritive resources of the soil, with communities adapted to easily accessible carbon substrates in the organic horizon (Bacteroidetes, Verrucomicrobia and Proteobacteria) and communities adapted to recalcitrant carbon substrates and inorganic nutrients in the mineral horizon (Firmicutes, Chloroflexi) [8–9]. At the genus level, the four most dominant genera were Candidatus Solibacter (Acidobacteria; 9.2660.35% for Min-S and 8.9460.27% for Org-S), Candidatus Koribacter (Acidobacteria; 7.1060.04% for Min-S and 7.3360.20% for Org-S), Bradyrhizobium (Proteobacteria; 3.5560.09% for Min-S and 3.6360.12% for Org-S) and Burkholderia (Proteobacteria; 3.0160.14% for Min-S and 3.3760.19% for Org-S). Although the taxonomic diversity (H’T index based on the genera identified
through SEED assignment) and the rarefaction analyses were not significantly different between the two soil horizons, significant
Figure 3. Functional analysis of the organic and mineral horizon metagenomes based on the MG-RAST database. The reads from the soil organic and mineral horizons of the forest experimental site of Breuil-Chenue (France) were screened for known functional subsystems. The data presented here corresponds to the hierarchy subsystem 1. All the data have been normalized by the quantity of assigned reads for each environment. A. Pyrosequencing based analysis. The presence of an asterisk indicates a significant difference (p,0.05) between the two soil horizons. The organic horizon appeared significantly enriched in sequences annotated in the carbohydrates (p,0.0001), virulence (p = 0.0256), stress response (p = 0.0013), sulfur metabolism (p = 0.0012), motility and chemotaxis (p,0.0001), phosphorus metabolism (p = 0.0001), iron acquisition and metabolism (p = 0.0002) and secondary metabolism (p = 0.0003) categories. On the contrary mineral horizon appeared significantly enriched in sequences annotated in the clustering-based subsystems (p = 0.0132), amino acids and derivatives (p = 0.0088), protein metabolism (p = 0.0012), membrane transport (p,0.0001) nucleosides and nucleotides (p = 0.0024) and regulation and cell signalling (p = 0.0142) categories.B. Illumina-based analysis. The presence of an asterisk indicates a significant difference (p,0.005) between the two soil horizons. The organic horizon was significantly enriched in sequences annotated in the carbohydrates (p = 0.003), iron acquisition (p = 0.005), motility and chemotaxis (p = 0.0004), phosphorus metabolism (p = 0.002), potassium metabolism (p = 0.0015), secondary metabolism (p = 0.0008), stress response (p = 0.0001) and sulfur metabolism (p = 0.0001). The mineral horizon was characterised by significantly more sequences annotated in the amino acids and derivatives (p = 0.0047), clustering-based subsystems (p = 0.0046), membrane transport (p = 0.0005), nucleosides and nucleotides (p = 0.0008), protein metabolism (p = 0.0005), regulation and cell signalling (p = 0.0045) categories.
doi:10.1371/journal.pone.0055929.g003
Figure 4. Relative distribution of the sequences encoding putative carbohydrate-active enzymes in the organic and mineral soil horizon metagenomes. A one-factor (habitat) ANOVA was applied on the relative distribution values after an arcsine square root transformation for CAZYME category. Presence of an asterisk indicates that the values are significantly different (p,0.05). PL: polysaccharide lyases, GH: glycoside hydrolase, GT: glycosyl transferase, CE: carbohydrate esterases and CBM: carbohydrate-binding modules.
differences were measured in the relative distribution of some bacterial genera (n = 120; Data not shown). Among the most abundant, C. solibacter and Burkholderia were significantly enriched in the mineral horizon and the organic horizon, respectively (Psolibacter= 0.03; PBurkholderia= 0.001). Similarly, Solibacter
(6.7260.29%) and Bradyrhizobium (4.8960.64%) were dominant in the grassland soil metagenomes of the experimental station of Rothamsted [26]. Notably, monogenic (16S rRNA) metagenomic studies performed on the Breuil-Chenue forest site have also showed that these bacterial genera were among the five dominant genera [7,35]. The prevalence of these genera was also highlighted in other soils [4,20,50].
Regions of the 16S rRNA gene sequences were found in our metagenomic dataset and used for confirming the taxonomic distribution. A total of 573 and 667 reads (0.05% of the total reads assigned to bacteria) from the Min-S and Org-S samples, respectively, had a significant match with the 16S rRNA gene sequences in the RDP database. Although the 16S rRNA-based analyses are known to provide more accurate taxonomic information, the limited number of 16S rRNA gene fragments identified here precludes relevant statistical analyses. Low propor-tions (0.01 to 0.20%) of 16S rRNA gene sequences were also reported in other shotgun studies such as in biogas fermenters [51]. Notably, both classifications (RDP and SEED) gave similar results, with the exception that the Verrumicrobia and
Plancto-mycetes were relatively more abundant in the RDP-based classification (Figure 2A). Similarly, Kanokratana et al. [14] and Delmont et al. [26] demonstrated that the taxonomic distribution obtained using only 16S rRNA gene sequences was different from that obtained using all the annotated sequences.
Regarding the other kingdoms, Archaea were significantly more abundant in the mineral horizon (1.8160.23% of the annotated reads) than in the organic horizon (1.3760.25% of the annotated reads) (P = 0.0003) (Table 2). Notably, the Thaumarchaeota (Figure 2B), which are for part known as potential chemolithoau-totrophic ammonia-oxidisers, appeared enriched in the mineral horizon and may play a key role in nutrient cycling in forests with acidic soils [52]. In contrast, the eukaryotic reads were significantly more abundant in the organic horizon (0.8360.08% of the annotated reads) than in the mineral horizon (0.6960.07% of the annotated reads)(P = 0.001). Eukaryotic species diversity was almost the same in the two horizons, with a significant enrichment of sequences related to Chordata, Arthropoda and Ascomycota in the organic horizon (Table 2). The higher proportion of insects’ DNA sequences in the organic horizon supports previous findings, which suggested the important role of the insects and the macrofauna in organic matter decomposition in terrestrial ecosystems [1]. Aside from their direct role in nutrient cycling, many studies have now highlighted their role as drivers of the soil microbial diversity [53]. Concerning the fungi, Lindahl et al. [54] also reported that these communities are vertically structured in the soil. In our study, a total of 0.2% of the annotated reads had a significant match with fungi. Notably, most of the fungal reads belonged to Ascomycota according to the MG-RAST or NCBI databases. A significant enrichment of sequences related to Sordariomycetes was observed in the organic horizon (Table 2). These fungi are ubiquitous and most of the members of this phylogenetic class are considered as potential pathogens, endo-phytes and/or saprobes involved in plant organic matter decomposition and nutrient cycling. However, in this same spruce plantation, two species diversity surveys previously showed that the number of fungal species was relatively high [12,31]. The gap between the eukaryotic data obtained by our shotgun metage-nomic approach and the diversity observed in the same experimental site by other methods illustrates the need to use Table 4. Summary of Illumina data obtained from the soil horizons.
Mineral horizon Organic horizon
M1 M2 M3 O1 O2 O3
Initial number of reads (75 pb)
28,545,299 33,010,890 31,541,438 35,616,572 33,008,852 32,029,180
Number of reads after cleaning*
23,337,406 26,959,526 25,734,496 29,314,843 27,056,862 26,444,433
Kmer length used for assembly
57 51 51 59 59 59
Number of reads used for assembly
24,245 33,861 22,573 65,718 29,737 43,649
Number of contig 628 945 586 81 516 736
Total assembly length (bp) 144,445 184,219 113,897 28,097 125,141 178,790
Minimum contig length (bp) 113 101 101 117 117 117
Maximum contig length (bp) 1 170 1 204 863 1 968 1 004 1 445
Average contig length (bp) 230 195 194 347 243 243
*Raw sequences were cleaned with fastq_quality_filter program of FASTX-Toolkit package version 0.013 (http: //hannonlab.cshl.edu/fastx_toolkit/index.html). doi:10.1371/journal.pone.0055929.t004
Table 5. Pearson correlation (r values), determined via Mantel tests, relating to Euclidean distances dissimilarity matrices generated from scaled biolog, metagenomic functions and taxonomy data.
Mineral Organic Both Metabolic profile, Functional metagenomic 0.95 0.75 0.703** Metabolic profile, Phylogenetic metagenomic 0.98 0.62 0.117 Functional metagenomic, Phylogenetic
metagenomic
0.99 0.98 0.391
**p-value ,0.005.
alternative approaches such as metatranscriptomics targeting polyA RNA [55–56] to study the soil eukaryotic communities. A small fraction of the reads were identified as belonging to viruses (Table 3).
Metabolic and Functional Analyses
Assignation of the reads from each soil horizon using the KEGG Mapper tool of the MG-RAST gave an integrated view of the global metabolism that revealed that most of the metabolic pathways were detected in both soil horizons (Data not shown). Only a few metabolic pathways appeared to be horizon-specific, potentially due to the insufficiency of the sequencing effort or to real biological differences. The functional differentiation of the two soil horizons was confirmed by the functional Shannon diversity index (H’F) calculated for the organic horizon, which was
significantly higher than in the mineral horizon (P = 0.01). Among the functional categories identified by MG-RAST, the five most dominant categories based on the relative abundance of assigned reads were the clustering-based subsystems (functional coupling evidence but unknown function; 15.3460.02% for Min-S and 15.1560.05% for Org-S), carbohydrates (10.4160.02% for Min-S and 10.8360.04% for Org-S), miscellaneous (8.5060.06% for Min-S and 8.4560.05% for Org-S), amino acids and derivatives (8.2560.05% for Min-S and 7.9760.06% for Org-S) and protein metabolism (7.3360.05% for Min-S and 7.0660.05% for Org-S) (Figure 3A). Comparative analysis of the two soil horizons based on the full set of replicates revealed that 8 and 6 functional categories (Level 1 of MG-RAST), which corresponded to 50% of the characterised functional categories of MG-RAST, were significantly more abundant in the organic and mineral horizon, respectively (Figure 3A). The organic horizon was significantly enriched in sequences annotated in the carbohydrates category (p,0.0001). This result could be linked to the relative enrichment of spruce roots in the organic horizon that may structure the microbial communities [57–58]. In contrast, the mineral horizon appeared significantly enriched in sequences annotated in the clustering-based subsystems (p = 0.0132) and amino acids and derivatives (p = 0.0088). A detailed analysis (level 2 of MG-RAST) of the most abundant functional categories related to the carbohydrates in the organic horizon highlighted that the significant differences observed were mainly based on the higher abundance of annotated reads corresponding to glycoside hydrolases (p = 0.045), beta-glucuronide utilisation (p = 0.0002), organic acids (p = 0.0001) and sugar utilisation (p = 0.0002) in the organic horizon compared to the mineral horizon. The same analysis performed in the mineral horizon on the most abundant functional categories related to the amino acids and derivatives showed that the significant differences observed were mainly due to a higher abundance of annotated reads related to histidine metabolism (p = 0.0007) and proline and 4-hydroxyproline metabolism (p = 0.0118) in the mineral horizon compared to the organic horizon. Significantly more ABC transporters related to iron acquisition were observed in the mineral horizon. When compared at the finer level (level 3 of MG-RAST), the most prevalent subsystems were related to carbohydrates (ca 1.860.01% of the annotated reads), cofactors, vitamins, prosthetic groups, and pigments (ca 1.5560.10% of the annotated reads). Based on these analyses, it can be concluded that the microbial communities inhabiting the organic horizon are well adapted to degrade easily accessible carbon substrates such as soluble carbohydrates or polysaccharides and, on the contrary, those inhabiting the mineral horizon are better adapted to degrade amino acid derivatives and proteins resulting from the leaching of by-products of organic matter and litter decomposition.
Carbohydrate-active Enzymes (CAZymes) Screening
Due to the importance of organic matter degradation in forest soils and especially the lignocellulose biomass, we focused our analysis on how carbohydrate-active enzymes (CAZymes) coding sequences were distributed in the organic and mineral horizons. Examining the putative CAZyme genes in the pyrosequencing data revealed that significantly more sequences coding for enzymes related to the glycoside hydrolase (GH: glycoside hydrolase; p,0.0001) were detected in the organic horizon (Figure 4). Notably, the mineral horizon was characterised by significantly more enzymes involved in the transfer (GT: glycosyl transferase; p = 0.001) and binding (CBM: carbohydrate-binding modules; p = 0.031) of the glycosides and their derivatives. A total of 260 CAZyme types were identified in the pyrosequencing data, revealing that the 10 most abundant CAZymes represented about 50% of the CAZymes detected (Table S2). A detailed analysis highlighted that 21 GHs, characterised by their ability to hydrolyse substrates such as pectin, cellulose, hemicellulose xylan and glucans, were significantly more abundant in the organic horizon (Table S3). The differences observed in the distribution of the GT and CBM enzymes were mainly due to differences in the enzymes involved in the fixation to cellulose or peptidoglycan or to the synthesis of long-term energy storage compounds such as trehalose or glycogen. Together, these results confirmed the functional sequence analysis performed on MG-RAST and supported the enzymatic and metabolic assays obtained from the soil solutions. These results are consistent with a specialisation of the microbiome inhabiting the organic horizon to the degradation of complex carbohydrates molecules.
Illumina Contribution to Soil Metagenome Characterisation
The mgDNA samples sequenced by 454 pyrosequencing were also sequenced using the Illumina sequencing. Although the assignment of reads with a size of approximately 75 bp was complex, both the taxonomic and functional analyses were performed using MG-RAST and the SEED database with the default parameters (Table 4). In contrast to the 454 sequences, only 25% of the Illumina sequences had a significant match in the databases, which corresponded to a total of 18.56106reads from the Min-S samples and 29.26106reads from the Org-S samples. Comparative analysis of the two soil horizons based on the replicates also revealed that 8 and 6 functional categories (Level 1 of MG-RAST) were significantly more abundant in the organic and in the mineral horizon (p,0.005), respectively (Figure 3B). Altogether, these results provided a similar view of the taxonomic and functional distribution of the microbial communities using two different sequencing technologies, demonstrating that this distri-bution was not linked to the known sequencing bias related to 454 pyrosequencing [59].
Relationship between Metabolic Potentials, Functional and Taxonomic Diversity
Our metagenomic datasets highlight a significant increase of the metabolic diversity (H’m; O.M, P = 0.01) and functional diversity
(H’F; O.M, P = 0.01) in the organic horizon compared to the
mineral horizon. Although some differences in the taxa distribu-tion were observed for the bacteria, archaea or eukaryotes, the diversity indices were not significantly different, suggesting that the communities were taxonomically quite similar between the two soil horizons and with a similar diversity, but differentiated at the functional level. Notably, Will et al. [9] and Jumpponen et al. [47] reported that the diversity indices decreased with depth in a
grassland soil, suggesting that this diversity was linked to the microbial biomass, which is known to decrease with soil depth. In our study, quantification of the total bacterial and fungal communities using real time PCR confirmed a decrease of the community densities from the organic to the mineral horizon of the soil, but according to the metagenomic analyses the taxonomic diversity was comparable. Moreover, the differentiation of the horizons according to their H’ indices (Hmand HF) was associated
with a significant correlation between these metabolic and functional diversity indices as confirmed by a linear regression analysis (y = 263.007+22.557x, R2= 0.84 and P = 0.01). Interest-ingly, a Mantel test performed on the Biolog and metagenomic data also highlighted that a significant correlation existed between these data, suggesting a good correspondence between the metabolic potentials measured on the soil suspensions and the functional metagenomic categories assigned after sequencing (Table 5). The other comparisons presented a good correlation but were not statistically significant (Table 5).
Conclusions
Our study presents the first metagenomic characterisation of the soil microbiome using a combination of pyrosequencing and Illumina-based technologies. Analysis of the ca 14 Gbp generated from the forest soil experimental site of Breuil-Chenue confirmed the high complexity of the soil environment and highlighted, at least in the assigned sequences, the prevalence of bacteria in our soil samples. Significant horizon-specific enrichment of some taxa was observed and the communities had significantly different functional abilities. Notably, both the Illumina and 454 sequences gave similar conclusions and highlighted the predominance of Acidobacteria and Alphaproteobacteria in the forest soil. The enrichment of some taxa in the organic or mineral horizon supports the hypothesis of a functional specialization and an important ecological role of these taxa in soil functioning. However, many of the horizon-enriched taxa such as Verrucomi-crobia, Bacteriodetes, Chloroflexi or the different phyla of Achaea remain poorly characterized at physiological and functional levels, justifying future research to obtain a comprehensive view of their role. Aside from this relative taxonomic homogeneity, our results suggest that the natural differences existing between the two soil horizons in term of nutrient availability and pH trigger a functional specialisation of the microbial communities. This specialisation was first revealed by the functional assays performed on the soil solutions, was confirmed by the SEED- and CAZymes-based analyses, and showed that the microbial communities inhabiting the organic horizon were significantly enriched for the genes involved in the degradation of soluble carbohydrates and polysaccharides, while those inhabiting the mineral horizon were significantly enriched for the genes involved in the access to carbon derivatives and amino acids. Notably, a Mantel test
highlighted a significant correlation between the metabolic potentials (Biolog) and the metagenomic functions only when the organic and mineral horizons were considered together, confirm-ing the quantitative differences existconfirm-ing between the two soil horizon microbiomes. The next step would be to test if a vertical stratification of gene expression exists in the soil using a metatranscriptomic approach. Together, our results demonstrated that the shotgun metagenomic based approach is a valuable tool for assessing microbial functional diversity. Although we are far from obtaining a complete understanding of the soil microbiome, our approach of combining 454 and Illumina data for soil and functional analysis has permitted us to observe the functional specificities of the soil microbial communities inhabiting the organic and mineral horizons. Together, with the recent results of Fierer et al. [4], our study illustrates how the natural soil microbial communities are influenced by the soil resource availability, the pH and how they may participate in nutrient cycling.
Supporting Information
Table S1 Summary of the enzymatic assays performed on soil solutions from the organic and mineral horizons.
(DOC)
Table S2 Average distribution of the CAZYMES detected in the organic and mineral horizons. The table presents the relative distribution (%) of the sequences assigned in CAZYMES categories (GT, CBM, GH, PL and CE).
(XLSX)
Table S3 CAZYME categories presenting significant differences between the two soil horizons. The table presents the relative distribution (%) of the sequences assigned in CAZYMES categories (GT, CBM, GH, PL and CE). The potential function of each CAZYME category is presented.
(XLSX)
Acknowledgments
The UMR1136 INRA ‘Interactions arbres microorganisms’ is supported by the Labex ‘ARBRE’. We thank Drs J. Ranger, P. Frey-Klett and L.C. Kelly for helpful discussions. The English language was reviewed by American Journal Experts. We would like to thank the reviewers, and especially Reviewer 1 for his assiduous implication in the improvement of our manuscript.
Author Contributions
Conceived and designed the experiments: MB FM SU. Performed the experiments: SU MB. Analyzed the data: SU PI AC MB JL EM. Contributed reagents/materials/analysis tools: PI AC. Wrote the paper: SU MB FM AC PI.
References
1. Ha¨ttenschwiler S, Tiunov AV, Scheu S (2005) Biodiversity and litter decomposition in terrestrial ecosystems. An Rev of Ecol Evol and System 36: 191–218.
2. Courty PE, Bue´e M, Diedhiou AG, Frey-Klett P, Le Tacon F, et al. (2010) The role of ectomycorrhizal communities in forest ecosystem processes: new perspectives and emerging concepts. Soil Biol and Biochem 42: 679–698. 3. Uroz S, Calvaruso C, Turpault M-P, Frey-Klett P (2009) The microbial
weathering of soil minerals: Ecology, actors and mechanisms. Trends in Microbiol 17: 378–387.
4. Fierer N, Lauber CL, Ramirez KS, Zaneveld J, Bradford MA, et al. (2011) Comparative metagenomic, phylogenetic and physiological analyses of soil microbial communities across nitrogen gradients. ISMEJ doi: 10.1038/ ismej.2011.159.
5. Pennanen T, Liski J, Ba˚a˚th E, Kitunen VV, Uotila J, et al. (1999) Structure of the microbial communities in coniferous forest soils in relation to site fertility and stand development stage. Microb Ecol 38: 168–179.
6. Rousk J, Ba˚a˚th E, Brookes PC, Lauber CL, Lozupone C, et al. (2010) Soil bacterial and fungal communities across a pH gradient in an arable soil. ISME J 10: 1340–1351.
7. Uroz S, Oger PM, Morin E, Frey-Klett P (2012) Distinct ectomycorrhizospheres share similar bacterial communities composition as revealed by pyrosequencing-based analysis of 16S rRNA genes. Appl Environ Microbiol 78: 3020–3024. 8. Bergmann GT, Bates ST, Eilers KG, Lauber CL, Caporaso JG, et al. (2011) The
under-recognized dominance of Verrucomicrobia in soil bacterial communities. Soil Biol and Biochem 43: 1450–1455.
9. Will C, Thu¨rmer A, Wollherr A, Nacke H, Herold N, et al. (2010). Horizon-specific bacterial community composition of German grassland soils, as revealed
by pyrosequencing-based analysis of 16S rRNA genes. Appl Environ Microbiol 76: 6751–6759.
10. Roesch LF, Fulthorpe RR, Riva A, Casella G, Hadwin AK, et al. (2007). Pyrosequencing enumerates and contrasts soil microbial diversity. ISME J 1: 283–290.
11. Bartram AK, Lynch MD, Stearns JC, Moreno-Hagelsieb G, Neufeld JD (2011) Generation of multi-million 16S rRNA gene libraries from complex microbial communities by assembling paired-end Illumina reads. Appl Environ Microbiol 77: 3846–3852.
12. Bue´e M, Reich M, Murat C, Morin E, Nilsson RH, et al. (2009) 454-pyrosequencing analyses of forest soil reveal an unexpectedly high fungal diversity. New Phytol 184: 449–456.
13. Fulthorpe RR, Roesch LF, Riva A, Triplett EW (2008) Distantly sampled soils carry few species in common. ISME J 2: 901–910.
14. Kanokratana P, Uengwetwanit T, Rattanachomsri U, Bunterngsook B, Nimchua T, et al. (2010) Insights into the Phylogeny and Metabolic Potential of a Primary Tropical Peat Swamp Forest Microbial Community by Metagenomic Analysis. Microb Ecol 61: 518–528.
15. Wallander H, Johansson U, Sterkenburg E, Brandstro¨m DM, Lindahl BD (2011) Production of ectomycorrhizal mycelium peaks during canopy closure in Norway spruce forests. New Phytologist 187: 1124–1134.
16. Biddle JF, Fitz-Gibbon S, Schuster SC, Brenchley JE, House CH (2008). Metagenomic signatures of the Peru Margin subseafloor biosphere show a genetically distinct environment. Proc Natl Acad of Sci USA 105: 10583–10588. 17. Hallam SJ, Putnam N, Preston CM, Detter JC, Rokhsar D, et al. (2004). Reverse methanogenesis: testing the hypothesis with environmental genomics. Science 305: 1457–1462.
18. Quaiser A, Zivanovic Y, Moreira D, Lo´pez-Garcı´a P (2011). Comparative metagenomics of bathypelagic plankton and bottom sediment from the Sea of Marmara. ISME J 5: 285–304.
19. Tyson GW, Chapman J, Hugenholtz P, Allen EE, Ram RJ, et al. (2004). Community structure and metabolism through reconstruction of microbial genomes from the environment. Nature 428: 37–43.
20. Baldrian P, Kolarˇı´k M, Stursova´ M, Kopecky´ J, Vala´sˇkova´ V, et al. (2011) Active and total microbial communities in forest soil are largely different and highly stratified during decomposition. ISME J doi: 10.1038/ismej.2011.95. 21. Qin J, Li R, Raes J, Arumugam M, Burgdorf KS, et al. (2010) A human gut
microbial gene catalogue established by metagenomic sequencing. Nature 464: 59–65.
22. Suen G, Scott JJ, Aylward FO, Adams SM, Tringe SG, et al. (2011) An insect herbivore metagenome with high plant biomass-degrading capacity. PLoS Genetic 6. pii: e1001129.
23. Albertsen M, Hansen LB, Saunders AM, Nielsen PH, Lehmann NK (2011) A metagenome of a full-scale microbial community carrying out enhanced biological phosphorus removal. ISMEJ doi: 10.1038/ismej.2011.176. 24. Simon C, Wiezer A, Strittmatter AW, Daniel R (2009) Phylogenetic diversity
and metabolic potential revealed in a glacier ice metagenome. Appl Environ Microbiol 75: 7519–7526.
25. Xie W, Wang F, Guo L, Chen Z, Sievert SM, et al. (2011) Comparative metagenomics of microbial communities inhabiting deep-sea hydrothermal vent chimneys with contrasting chemistries. ISME J 5: 414–426.
26. Delmont TO, Prestat E, Keegan KP, Faubladier M, Robe P, et al. (2012) Structure, fluctuation and magnitude of a natural grassland soil metagenome. ISMEJ. doi: 10.1038/ismej.2011.197.
27. Mackelprang R, Waldrop MP, DeAngelis KM, David MM, Chavarria KL, et al. (2011) Metagenomic analysis of a permafrost microbial community reveals a rapid response to thaw. Nature 480: 368–371.
28. Cantarel BL, Coutinho PM, Rancurel C, Bernard T, Lombard V, et al. (2009). The Carbohydrate-Active EnZymes database (CAZy): an expert resource for Glycogenomics. Nucl Ac Res 37: D233–238.
29. Meyer F, Paarmann D, D’Souza M, Olson R, Glass EM, et al. (2008). The metagenomics RAST server - a public resource for the automatic phylogenetic and functional analysis of metagenomes. BMC Bioinformatics. 9: 386. 30. Cole JR, Chai B, Marsh TL, Farris RJ, Wang Q, et al. (2003). Ribosomal
Database Project. The Ribosomal Database Project (RDP-II): previewing a new autoaligner that allows regular updates and the new prokaryotic taxonomy. Nucl Ac Res 31: 442–443.
31. Bue´e M, Maurice JP, Zeller B, Andrianarisoa S, Ranger J, et al. (2011) Influence of tree species on richness and diversity of epigeous fungal communities in a French temperate forest stand. Fung Ecol 4 : 22–31.
32. Calvaruso C, Turpault M-P, Leclerc E, Frey-Klett P (2007) Impact of ectomycorrhizosphere on the functional diversity of soil bacterial and fungal communities from a forest stand in relation to nutrient mobilization processes. Microb Ecol 54: 567–577.
33. Calvaruso C, Turpault MP, Leclerc E, Ranger J, Garbaye J, et al. (2010) Influence of forest trees on the distribution of mineral weathering-associated bacterial communities of the Scleroderma citrinum mycorrhizosphere. Appl Environ Microbiol 76 : 4780–4787.
34. Lepleux C, Turpault MP, Oger P, Frey-Klett P, Uroz S (2012) Correlation of the abundance of betaproteobacteria on mineral surfaces with mineral weathering in forest soils. Appl Environ Microbiol 78: 7114–7119.
35. Uroz S, Bue´e M, Murat C, Frey-Klett P, Martin F (2010) Pyrosequencing reveals a contrasted bacterial diversity between oak rhizosphere and surrounding soil. Environ Microbiol Rep 2: 281–288.
36. Pritsch K, Raidl S, Marksteiner E, Blaschke H, Agerer R, et al. (2004) A rapid and highly sensitive method for measuring enzyme activities in single mycorrhizal tips using 4-methylumbelliferone-labelled fluorogenic substrates in a microplate system. J of Microbiol Meth 58: 233–241.
37. Feinstein LM, Sul WJ, Blackwood CB (2009) Assessment of bias associated with incomplete extraction of microbial DNA from soil. Appl Environ Microbiol 75: 5428–5433.
38. Delmont TO, Robe P, Cecillon S, Clark IM, Constancias F, et al. (2011) Accessing the soil metagenome for studies of microbial diversity. Appl Environ Microbiol 77: 1315–1324.
39. Prosser JI (2010) Replicate or lie. Environ Microbiol 12: 1806–1810. 40. Felske A, Akkermans ADL, De Vos WM (1998) Quantification of 16S rRNAs in
complex bacterial communities by multiple competitive reverse transcription-PCR in temperature gradient gel electrophoresis fingerprints. Appl Environ Microbiol 64: 4581–4587.
41. Lueders T, Pommerenke B, Friedrich MW (2004) Stable-isotope probing of microorganisms thriving at thermodynamic limits: syntrophic propionate oxidation in flooded soil. Appl Environ Microbiol 70: 5778–5786.
42. Ce´bron A, Norini MP, Beguiristain T, Leyval C (2008). Real-Time PCR quantification of PAH-ring hydroxylating dioxygenase (PAH-RHDa) genes from Gram positive and Gram negative bacteria in soil and sediment samples. J of Microbiol Meth 73: 148–59.
43. Thion C, Ce´bron A, Beguiristain T, Leyval C (2012) PAH biotransformation and sorption by Fusarium solani and Arthrobacter oxydans isolated from a polluted soil in axenic cultures and mixed co-cultures. Intern Bioter and Biodegrad 68: 28–35.
44. Park BH, Karpinets TV, Syed MH, Leuze MR, Uberbacher EC (2010). CAZymes Analysis Toolkit (CAT): web service for searching and analyzing carbohydrate-active enzymes in a newly sequenced organism using CAZy database. Glycobiology 20: 1574–1584.
45. Mareschal L, Bonnaud P, Turpault M-P, Ranger J (2010) Impact of common European tree species on the chemical and physicochemical properties of fine earth: an unusual pattern. Europ J of Soil Sci 61: 14–23.
46. Snajdr J, Valaskova V, Merhautova V, Herinkova J, Cajthaml T, et al. (2008). Spatial variability of enzyme activities and microbial biomass in the upper layers of Quercus petraea forest soil. Soil Biol and Biochem 40: 2068–2075.
47. Jumpponen A, Jones KL, Blair J (2010) Vertical distribution of fungal communities in tallgrass prairie soil. Mycologia 102: 1027–1041.
48. Littman R, Willis BL, Bourne DG (2011) Metagenomic analysis of the coral holobiont during a natural bleaching event on the Great Barrier Reef. Environ Microbiol Rep 3: 651–660.
49. Pfister CA, Meyer F, Antonopoulos DA (2010) Metagenomic profiling of a microbial assemblage associated with the California mussel: a node in networks of carbon and nitrogen cycling. Plos One 5: e10518.
50. Jones RT, Robeson MS, Lauber CL, Hamady M, Knight R, et al. (2009) A comprehensive survey of soil acidobacterial diversity using pyrosequencing and clone library analyses. ISME J 3: 442–453.
51. Jaenicke S, Ander C, Bekel T, Bisdorf R, Dro¨ge M, et al. (2011) Comparative and joint analysis of two metagenomic datasets from a biogas fermenter obtained by 454-pyrosequencing. PLoS One. 6: e14519.
52. Hatzenpichler R (2012) Diversity, physiology and niche differentiation of ammonia-oxidizing archaea. Appl Environ Microbiol doi: 10.1128/ AEM.01960–12.
53. Wardle DA (2006) The influence of biotic interactions on soil biodiversity. Ecol Lett 9: 870–886.
54. Lindahl BD, Ihrmark K, Boberg J, Trumbore SE, Ho¨gberg P, et al. (2007) Spatial separation of litter decomposition and mycorrhizal nitrogen uptake in a boreal forest. New Phytol 173: 611–620.
55. Bailly J, Fraissinet-Tachet L, Verner M-C, Debaud J-C, Lemaire M, et al. (2007) Soil eukaryotic functional diversity, a metatranscriptomic approach. ISME J 1: 632–642.
56. Damon C, Lehembre F, Oger-Desfeux C, Luis P, Ranger J, et al. (2012) Metatranscriptomics Reveals the Diversity of Genes Expressed by Eukaryotes in Forest Soils. PLoS ONE 7: e28967. doi: 10.1371/journal.pone.0028967. 57. Schmid I, Kazda M (2002) Root distribution of Norway spruce in monospecific
and mixed stands on different soils. Forest Ecol and Manag 159: 37–47. 58. Sandnes A, Eldhuset T, Wollebæk G (2005) Organic acids in root exudates and
soil solution of Norway spruce and silver birch. Soil Biol and Biochem 37: 259– 269.
59. Gilles A, Megle´cz E, Pech N, Ferreira S, Malausa T, et al (2011) Accuracy and quality assessment of 454 GS-FLX Titanium pyrosequencing. BMC Genomics 12: 245.