HAL Id: hal-00480160
https://hal.archives-ouvertes.fr/hal-00480160
Submitted on 3 May 2010
HAL is a multi-disciplinary open access
archive for the deposit and dissemination of
sci-entific research documents, whether they are
pub-lished or not. The documents may come from
teaching and research institutions in France or
abroad, or from public or private research centers.
L’archive ouverte pluridisciplinaire HAL, est
destinée au dépôt et à la diffusion de documents
scientifiques de niveau recherche, publiés ou non,
émanant des établissements d’enseignement et de
recherche français ou étrangers, des laboratoires
publics ou privés.
violet-irradiated mouse skin inflammatory and
precancerous stages: instrumentation, spectral feature
extraction/selection and classification (k-NN, LDA and
SVM)
Gilberto Díaz-Ayil, Marine Amouroux, Walter Blondel, Geneviève
Bourg-Heckly, Agnès Leroux, François Guillemin, Yves Granjon
To cite this version:
Gilberto Díaz-Ayil, Marine Amouroux, Walter Blondel, Geneviève Bourg-Heckly, Agnès Leroux, et al..
Bimodal spectroscopic evaluation of ultra violet-irradiated mouse skin inflammatory and
precancer-ous stages: instrumentation, spectral feature extraction/selection and classification (k-NN, LDA and
SVM). European Physical Journal: Applied Physics, EDP Sciences, 2009, 47 (1), pp.1-12.
�10.1051/ep-jap/2009032�. �hal-00480160�
(will be inserted by the editor)
Bimodal spectroscopic evaluation of ultra violet-irradiated
mouse skin inflammatory and pre-cancerous stages:
instrumentation, spectral feature extraction/selection and
classification (k-NN, LDA and SVM)
G. Díaz-Ayil1, M. Amouroux1, W.C.P.M. Blondel1, G. Bourg-Heckly2, A. Leroux3, F. Guillemin1,3 and Y. Granjon1
1 Centre de Recherche en Automatique de Nancy, Nancy-University, CRAN UMR 7039 CNRS-Nancy University, 2 avenue de la
Forêt de Haye, 54516 Vandoeuvre-les-Nancy, France
2 Laboratoire de Biophysique Moléculaire, Cellulaire et Tissulaire, BioMoCeTi UMR 7033 CNRS-Université Pierre et Marie Curie
Paris 6, Genopole Campus 1, 5 rue Henri Desbruères, 91030 Evry cedex, France
3 Centre Alexis Vautrin, 6 avenue de Bourgogne, 54511 Vandoeuvre-lès-Nancy cedex, France
Received: date / Revised version: date
Abstract. This paper deals with the development and application of in vivo spatially-resolved bimodal spectroscopy (AutoFluorescence AF and Diffuse Reflectance DR), to discriminate various stages of skin precancer in a pre-clinical model (UV-irradiated mouse): Compensatory Hyperplasia CH, Atypical Hyperplasia AH and Dysplasia D. A programmable instrumentation was developed for acquiring AF emission spectra using 7 excitation wavelengths: 360, 368, 390, 400, 410, 420 and 430 nm, and DR spectra in the 390-720 nm wavelength range. After various steps of intensity spectra preprocessing (filtering, spectral correction and intensity normalization), several sets of spectral characteristics were extracted and selected based on their discrimination power statistically tested for every pair-wise comparison of histological classes. Data reduction with Principal Components Analysis (PCA) was performed and 3 classification methods were implemented (k-NN, LDA and SVM), in order to compare diagnostic performance of each method. Diagnostic performance was studied and assessed in terms of Sensibility (Se) and Specificity (Sp) as a function of the selected features, of the combinations of 3 different inter-fibres distances and of the numbers of principal components, such that: Se and Sp ≈ 100% when discriminating CH vs. others; Sp ≈ 100% and Se > 95% when discriminating Healthy vs. AH or D; Sp ≈ 74% and Se ≈ 63% for AH vs. D.
Keywords: spectral data classification, in vivo spectroscopy, autofluorescence, diffuse reflectance.
PACS. 87.64.-t Spectroscopic and microscopic techniques in biophysics and medical physics – 87.80.-y Biophysical techniques (research methods) – 07.60.-j Optical instruments and equipment
1 Introduction
Because outdoor activities and esthetic considerations (such as skin tanning) are of growing interest in west-ern countries, fair-skinned populations have been more and more exposed to sun light in the past decades. Since solar ultra-violet (UV) radiation is the main environmen-tal cause of skin cancer, the incidence of the three ma-jor forms of skin cancer (melanoma, squamous cell carci-noma (SCC) and basal cell carcicarci-noma) is growing. Even though most deaths are attributable to melanoma, SCC is the most common life-threatening cancer type [1]. In dermatology, diagnosis is based on direct visualisation of the lesion. Because such observation depends on per-sonal experience of the physician, lesions may be falsely considered benign, may not undergo biopsy, and there-fore may not be subjected to the reference diagnostic gold
standard i.e. histo-pathology [2]. Currently, full diagno-sis of suspicious skin lesions implies excision-biopsy of the lesion followed by anatomo-pathological examina-tion. Such a diagnosis process is invasive and thus im-plies pain, increased morbidity and substantial damage to nearby healthy skin (esthetic inconvenience). More-over the sensitivity of this method is limited because only a few tissue samples can be biopsied in a suspicious area. Noninvasive methods such as MRI, ultrasounds and spec-troscopy have the potential to eliminate these problems and also to permit the monitoring of treatment effects [3]. Optical methods (imaging and spectroscopy) in the UV -Visible - Near-Infra-Red spectral range are of particular interest because they are harmless (using the non-ionizing part of the electromagnetic spectrum) and sensitive to morphologic and functional modifications of biological
tissues occuring during early stages of cancer develop-ment [4]. Furthermore to improve inter-observer agree-ment and diagnosis’accuracy (sensitivity and specificity), optical spectroscopy can be useful by providing physi-cians with more objective criteria. Spectroscopy methods are based on interactions of light with biological tissues. During the past twenty years, Diffuse Reflectance (DR) and AutoFluorescence (AF) spectroscopies have been the most investigated spectroscopy modalities [4]. DR spec-troscopy is based on elastic scattering of photons within biological tissues. Elastic scattering is caused by vari-ations in the refractive index of small particles in the medium, resulting in dispersion of light in all directions, without loss of energy, i.e. no wavelength shift between incident and reflected light. Different types and sizes of scattering centers can be found within the tissue: col-lagen fibers, cellular membranes and subcellular struc-tures (nuclei, mitochondria) [5]. AF spectroscopy is based on the analysis of fluorescence emission by endogenous molecules, i.e. materials that are natural constituents of biological tissues (intra or extra-cellular metabolic prod-ucts). Such endogenous fluorophores are usually excited in the 300-450 spectral range. These molecules are related to the stucture arrangement of cells and tissues (such as collagen, elastin, etc.) and to the cellular metabolism (such as NAD(P)H, flavins, etc.). As a result, different morpho-functional conditions of the skin related to pathologic al-terations such as cancer development can be character-ized using either AF, DR or both [5]. As shown in previ-ous works [6–8], combining both modalities (DR and AF) provides a more accurate diagnosis (increased sensitivity and specificity). A typical optical spectroscopy set-up in-cludes a light source, an optical fiber bundle (including excitation and collection fibers) put in gentle contact with the skin and a spectrometer. Optical fibers allow spec-troscopy to be used not only on skin but also on less acces-sible anatomical sites such as hollow inner organs (blad-der, oesophagus, cervix, etc.) Most optical fibre bundles are currently used with different Collection-to-Excitation Fibre Separations (CEFS) and with various geometrical configurations in order to optimize signal collection [9, 10] and to probe tissues at various depths. Systems for DR spectroscopy (380-950 nm or 300-800 nm) associated to AF excitations between 300 and 500 nm have been built and used in several studies [11–13]. They were composed of an arc-lamp and a monochromator in order to get a large number of fluorescence excitation wavelengths and wide spectral range for diffuse reflectance. These systems used 7 to 46-fibre bundles and highly sensitive multi-track acquisition devices (intensified CCD). The spectroscopic set of acquired data consists in AF and DR spectra whose shape and intensity vary as a function of tissue structure and CEFS. Such a set of spectra represents a large amount of data to be reduced and analyzed. Various methods of processing spectral data were previously described. They ususally include three steps: i) features extraction: although full spectra can be directly processed, most of the time, specific spectral features (such as areas, peak intensities, ratios, etc.) are extracted; ii) spectral data set
reduction based on factorial analysis mostly using Prin-cipal Component Analysis (PCA); iii) classification based on different types of supervised and non-supervised al-gorithms, the latter allowing to calculate sensitivity (Se) and Specificity (Sp), both being diagnostic parameters of clinical interest, with reference to histological classes. The choice of the method will influence the obtained values of sensitivity and specificity.
The aim of the current work is to assess bimodal spec-troscopy’s accuracy in classifying UV- irradiated mouse skin samples into four histological precancerous classes. The objectives are threefold: i) develop a bimodal spec-troscopy instrumentation for in vivo acquisition of AF and DR spectra from mouse skin. Since the measurement pro-tocol lasted for several months, calibration and normal-ization procedures were developed to account for the sys-tem thoughput variations (light source intensity, acquisi-tion set-up) over the 30-week period of time; ii) extract an extended set of “a priori”spectral data, then select the most discriminative ones with reference to each pair-wise discrimination; iii) investigate whether improvements in classification performance could be obtained using dif-ferent linear classification methods (namely k-Nearest Neighbor, Linear Discriminant Analysis or Support Vec-tor Machine).
2 Materials and Methods
2.1 Bimodal multi-excitation spectroscopy set-up
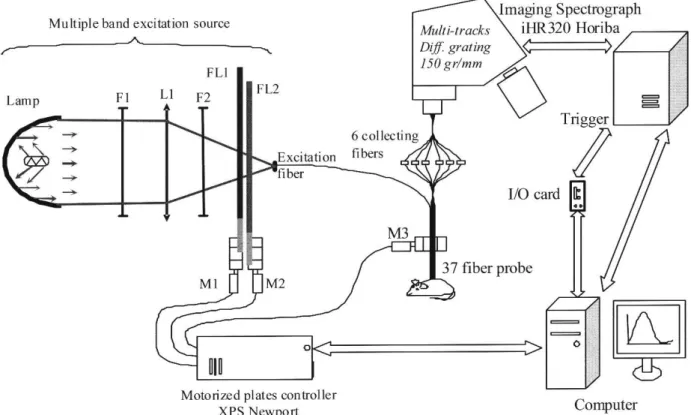
Figure 1 presents a scheme of the developed multi-ex-citation-collection spatially resolved spectroscopic sys-tem. Source light injected in the excitation fibre (Fexc) comes from a short-arc 300W Xenon lamp with a parabolic mirror (Eurosep, France). The lamp emits mainly in the 300-800 nm spectral range. An anti-caloric filter (F1) pro-tects optical components from heating by infra-red wave-lengths. Light from the lamp is focused at the entrance of the optical excitation fiber (Fexc) using the convex lens L1. A bandpass filter F2 is used to limit the excitation spectral range to 350-450 nm in order to avoid at best the transmis-sion of light interfering with the endogenous fluorescence emission, mainly emit in the 450-700 nm range. The set-up consists in a dynamically-tunable excitation fluorescence system: center wavelength and Full Width at Half Max-imum (FWHM) can be set thanks to the combination of linearly variable high-pass (FL1) and low-pass (FL2) fil-ters. Both filters are fixed on translation stages (UMR 8.51, Newport) controlled by a motorized micrometric posi-tioning system (actuators LTA-HS, 0.1 µm precision and XPS controller, Newport) used to tune excitation peaks (between 350 and 460 nm) as well as illumination band-widths (FWHM between 15 and 25 nm) in a precise and repeatable way. For diffuse reflectance, three illumina-tion spectral bands were selected: 365-545, 450-640 and 550-740 nm. We used a 37-optical fibre bundle (available CEFS are between 250 and 1500 µm). Up to 13 spectra can be acquired simultaneously thanks to a multi-track imag-ing spectrograph equipped with a UV back-illuminated
Fig. 1. Scheme of the bimodal spectroscopy device developed. Short arc lamp (300W Xenon), F1: anticaloric filter, L1: convex lens, F2: bandpass filter, FL1 and FL2: high-pass and low-pass linearly variable filters, Fexc: exciting optical fibre, M1, M2 and M3: motorized micrometric positioning actuators used for linear displacement.
CCD (iHR 320, Horiba Jobin Yvon, France) and an emis-sion filter-wheel with various filters used to reject the backscattered excitation light. For our application, we se-lected 3 different CEFS: 271, 536 and 834 µm so as to probe the tissue at various depths; as mentionned by Katika et
al. [14] for instance, a 250 µm-CEFS provides information
from a 100 µm-depth in the skin at 442 nm. Integration times were 500 ms and 50 ms for AF and DR respectively. Spectra were all acquired using a diffraction grating (150 lines/mm) blazed at 600 nm.
A dedicated software was developed using Visual C++ 6.0 (Microsoft corporation) in order to control the transla-tion stage displacements (for excitatransla-tion peaks and bands tuning) and to synchronize the excitation system with the iHR320 spectrometer acquisition using external trigger-ing.
The system automatically switches from each acquisition wavelength to the following one. Such a combination of procedures can be repeated as many times as required. For each excitation, 3 spectra were acquired and averaged in order to improve signal-to-noise ratio.
2.2 Skin cancer animal model and experimental protocol
The device being described in the current paper was developed in order to diagnose pre-cancerous stages of Squamous Cell Carcinomas (SCC) which is the most letal
form of non melanoma skin cancers. Skin tumours are in-duced by UV-irradiation of SKH1 mice (albino and hair-less). We chose this way of inducing tumours (also called ‘spontaneous’ tumours) in order to remain as close to hu-man etiology as possible. Twenty-eight mice were divided into three groups: group I included 8 sham-irradiated mice (control group), group II included 10 mice irradi-ated for 1 month (50 mJ/cm2 weekly dose) and group
III included 10 mice irradiated for 6 months (50 mJ/cm2
once a week for the first 15 weeks then twice a week for the rest of the irradiation protocol). Mice were anesthe-sized with a mix of Ketamine and Xylazine during spec-troscopic measurements. During the 30-week protocol, 2 mice a week were regularly euthanized and back skin was sampled. Each piece of skin was further fixed in 10% formaldehyde solution and 5 µm-slices were stained with standard Hematoxylin and Eosin (to evaluate epidermis features) and specific Weigert staining (to evaluate der-mal elastic fibers). Then, based on histo-pathological cri-teria, main precancerous mouse skin stages characteristics were identified and skin samples were further classified in each of the four following classes: Healthy (H), Com-pensatoty Hyperplasia (CH), Atypical Hyperplasia (AH) and Dysplasia (D). Such a classification was made thanks to a pathologist evaluation of epidermis and dermis fea-tures: epidermis thickness, presence of mitosis in upper layers of epidermis, hyperkeratosis, nucleoted upper lay-ers, heterogenous chromatin, cell layer disorganization,
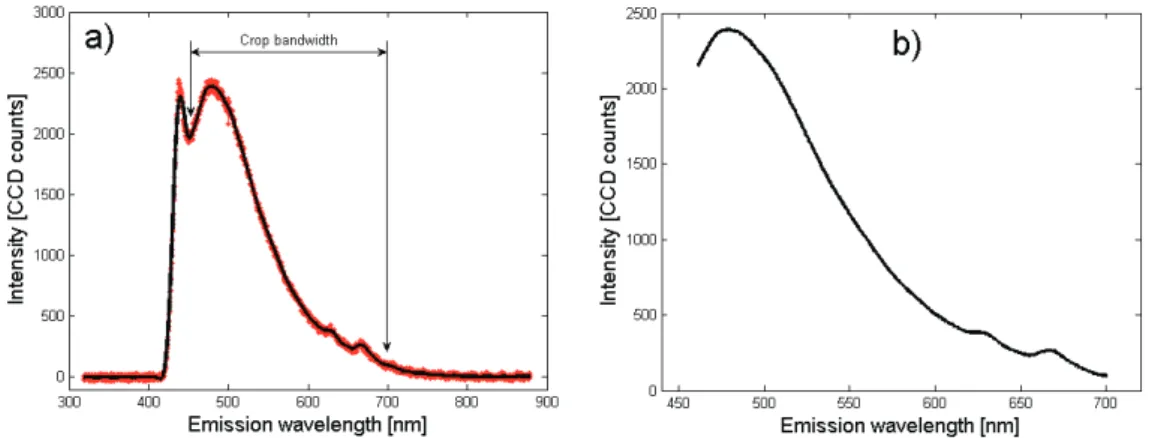
Fig. 2. Crop bandwidth, mean and filtered AF-410 nm emission. a) mean spectra (red), filtered spectra (black); b) crop bandwidth.
parakeratosis, dyskeratosis and elastosis.
Finally , the histological set of data used in the present contribution consisted of 84 healthy, 47 compensatory hyperplastic, 64 atypical hyperplastic and 57 dysplastic hyperplastic skin samples.
Colocalized AF and DR spectra were acquired on twelve spots of each mouse’s back skin : six spots along the back-bone on each side (left and right). Seven excitation wave-lengths (360, 368, 380, 390, 400, 410, 420 and 430 nm) were used for AF spectroscopy and three illumination bands (365-545, 450-640 and 550-740 nm) were used for DR spectroscopy. Three Collection to Excitation Fibers Separations (CEFS) were used: 271, 536 and 834 µm.
2.3 Spectral Data Processing
2.3.1 Preprocessing (filtering, spectral correction, normalization)
After building 3D-matrices made of three (number of CEFS) 2D-matrices of 30 intensity spectra each (7 excita-tions for AF and 3 DR illumination bands, n=3 for each), a 6-step preprocessing was performed on raw AutoFluo-rescence (AF) spectra:
1. High amplitude narrow peak artefacts suppression: a 4 nm-width (15 points) sliding window was applied over the entire intensity spectra. Artefacts are detected based on a variance variation of more than 400% be-tween successive windows. Then parasitic points are suppressed based on a 30 time-averaging with the pre-vious data point.
2. The raw spectral intensity curves acquired are affected by a random measurement noise characterized by a Gaussian distribution. In order to improve the signal signal-to-noise ratio [15,7] 3 acquisitions in a raw were systematically performed then averaged (n=3, maxi-mum number compatible with acquisition time); by this way noise amplitude was reduced by 40%. 3. Residual high frequency was removed using a
polyno-mial smooth filtering (Stavizky-Golay) [16]. The win-dow size and order of the filter were determined for
each type of spectra (AF or DR) with reference to their specific shape characteristics. A 22 nm width window (2nd order) was applied to all AF spectra and 15 to 30 nm width window (2nd order) were used for DR depending on the spectra width band. The windows widths and filter order of the implemented filters were defined in particular to smooth “correctly”the infor-mative narrowest parts of the curves while preserv-ing the main shape (for instance porphyrin emission peaks of width 35-40 nm visible in the 620-690 nm band, figure 2a).
4. The curve of a typical AF emission spectrum (fig-ure 2a) acquired can be subdivised in 3 parts, the central part being the useful informative one. The lower wavelengths part may exhibit residual intensi-ties due to the backscattered excitation light (although filtered), and no more AF signals is observed above 700 nm. In order to only keep the useful part of the emis-sion spectra acquired (figure 2b, crop bandwidth for 410 AF), we defined the following crop bandwidths of interest: 410-700nm for AF360 and AF368; 460-700nm for AF390, AF400 and AF410; 463-700nm for AF420; 476-700nm for AF430; and 390-720nm for DR.
5. The various components of the acquisition system i.e. optical probe, fibers, lenses, mirrors, diffraction grat-ings, CCD, have specific spectral responses which af-fect the shape and amplitude of the acquired spec-tra. Therefore a correction of the system throughput is needed and was applied thanks to a calibration lamp (HL 2000-CAL, Ocean Optics). Correction coefficients were calculated by dividing the experimentally mea-sured calibration lamp spectrum (acquired with the same acquisition configurations as the ones that were used during mouse skin measurements) by the refer-ence or calibrated spectrum of the lamp.
6. The excitation source (Lamp Xenon 300W) has a rel-ative power output that decreases with the opera-tion time. As measurement protocol lasted for several weeks, a correction method was implemented to take this diminution into account. Source light intensity variations were taken into account thanks to power measurements at the probe tip every day at start of
the experiment (Powermeter 841PE and detector UV 818-UV, Newport Corp.). Corrections were performed thanks to the division of raw spectra by the excitation light power measured on the same day of experiment. For Diffuse Reflectance (DR) spectra, preprocessing ap-proach was the same as the one used for AF spectra up to step # 4. In this case, once bandwidths of interest were defined, skin spectra were normalized by standard spec-tra acquired on a Lambertian surface (WS-1 Diffuse Re-flection Standard, Ocean Optics) obtained at the shortest CEFS (271 µm).
2.3.2 Spectral features selection and data reduction Based on our own observations of the main intensity and shape variations of acquired spectra and on previously published studies [17–23], we extracted 762 spectral fea-tures from each of the 24 spectra acquired on each skin spot (7 AF + 1 DR at each of the 3 CEFS):
– Areas: under the spectrum between λaand λb(Aλa−λb),
under the the spectrum between λaand λb+ spectral intensity contribution (ATλa−λb), above the spectrum
(AAλa−λb), and normalized areas (ANλa−λb)
– Ratio of intensities at λa and λb (Rλa−λb) and ratio of
areas (Aλa−λb/Aλb−λc)
– Spectral fitting residual (F): a 10th − degre polynomial
curve was fitted on the entire spectra and residual value registered
– Slope between λaand λb(Sλa−λb) and normalized slope
(NSλa−λb)
– Median (Me), mean (M) and standard deviation (SD)
of the entire spectra
All these spectral characteristics for AF and DR are given in detail in Table 1.
A normality Lilliefors test was implemented in order to keep (for next statistical test) only the spectral charac-teristics with normal statistical distribution. Then, a T-Student test was performed between all pairs of histo-logical classes to set 3 groups of spectral features that give a pair-wise discrimination of either 6, 5 or 4 pairs of histological skin classes (Table 2). Spectral features were extracted for each of the 3 CEFS: 271 (D1), 536 (D2) and 834 (D3) µm.
In order to test spatially-resolved bimodal spectroscopy’s accuracy in discriminating either 6, 5 or 4 pairs of histo-logical classes, we combined spectral features as indicated in Table 2: (D1 and D2), (D1 and D3), (D2 and D3) and (D1 and D2 and D3).
Once all the spectral features combinations were estab-lished, data were mean centered and Principal Compo-nent Analysis (PCA) was performed in order to reduce data set to a lower dimension and to provide uncorre-lated data (Principal Components: PCs) for classification. 2.3.3 Classification
The results of three types of linear classification algo-rithm (k-NN, LDA and SVM) were compared. A
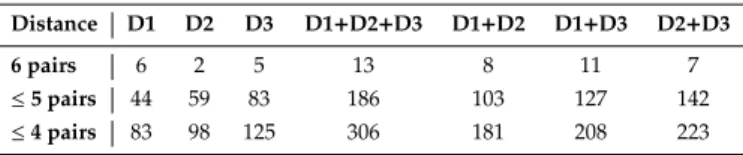
super-Table 2. Number of characteristics finally selected after statis-tical tests using each of the CEFS combinations of spatially-resolved bimodal spectroscopy (each distance D1, D2, D3 and their 4 possible combinations) for spectral features that allowed a pair-wise discrimination of either 6, 5 or 4 pairs of histological skin classes
Distance D1 D2 D3 D1+D2+D3 D1+D2 D1+D3 D2+D3
6 pairs 6 2 5 13 8 11 7
≤ 5 pairs 44 59 83 186 103 127 142
≤ 4 pairs 83 98 125 306 181 208 223
vised classification was performed based on the results of histological analysis. The performance of this classifica-tion was expressed in the form of Sensibility Se (number of well classified pathologic samples) and Specificity Sp (number of well classified healthy samples) calculation. k-Nearest Neighbors (k-NN) is a simple classification method giving good results with normal and non nor-mal populations [24]. Using the Euclidean distance mea-sure, the distances between validation data set and the calibration data set is computed with k neighbors sam-ples number, then each measurement in the validation set is assigned the majority class belonging to its closest k neighbors in the training set. A difficulty for this method is the determination of the appropriate k-value, this is the reason why we proposed to test a wide range of values (typically 1 to 15).
The Linear Discriminant Analysis (LDA) aims at defining a set of axes (so-called linear discriminant functions) that best represent the distances existing between groups of data with reference to their variances. This method max-imizes the ratio of between-class variance to the within-class variance in any particular data set thereby guaran-teeing maximal separability. It requires the data set to be normally distributed [25].
The Support Vector Machines (SVM) applies a transfor-mation to the data (linear or nonlinear) in a greater dimen-sion space, then applies a linear discrimination to separate the data. The objective of SVM is to obtain an optimal sep-arating hyper-plane that maximizes the margin between two classes in a multidimensional data space. SVM was designed to be particularly effective in developing a reli-able classifier from a training set with a small sample size [26–28].
For each of the three classification methods, algorithms to discriminate the 6 pairs of histological classes (H vs. CH, H vs. AH, H vs. D, CH vs. AH, CH vs. D and AH vs. D) were developed. True positives (pathologic skin samples that were correctly classified) and true negatives ("healthy" skin samples that were correctly classified) were used to evaluate sensitivity and specificity of the classification method. In order to test the robustness (generalization ca-pacity), each algorithm was applied on 100 training and validation cycles with random selection of 66% of spectra as training set of data and the 34% left kept as the valida-tion set of data.
k-NN algorithms were performed using several combi-nations of number of neighbors (k) and Principal
Com-Table 1. Spectral characteristics extracted for spectra acquired for each Autofluorescence excitation (e.g. AF-360 for the 360 nm excitation) and for DR spectra. Total area (AT), Normalized Area (AN) Normalized Slope (NS), Slope (S), Ratio (R) Mean (M), Standard Deviation (SD), Median (Me), Fitting Residual (F)
λexc(nm) Spectral characteristics
AF-360 and AT410−700, NS410−445, NS410−700, S410−445, S410−700, R455−595, A410−500/AT500−700, M, SD, Me and F AF-368 AF-390 AT460−700, AT460−545, A460−545, AN460−545, AT615−650, A615−650, AN615−650, AT655−690, A655−690, AN655−690 NS460−700, NS460−545, NS615−650, NS655−690, NS460−470, NS470−595, NS633−670, NS470−633, S460−700, S460−545 S615−650, S655−690, S460−470, S470−595, S633−670, S470−633, R470−595, R470−633, R545−633, R470−670, R450−670 R633−670, A615−650/A655−690, A460−545/A545−700, , M, SD, Me and F AF-400 AT460−700, AT460−550, A460−550, AN460−550, AT615−650, A615−650, AN615−650, AT655−690, A655−690, AN655−690 NS460−700, NS460−550, NS615−650, NS655−690, NS460−475, NS485−595, NS633.5−669, NS485−633.5, S460−700, S460−550 S615−650, S655−690, S460−475, S485−595, S633.5−669, S485−633.5, R485−595, R485−633.5, R550−633.5, R485−669, R550−669 R633.5−669, A615−650/A655−690, A460−550/A550−700, , M, SD, Me and F AF-410 AT460−700, AT460−550, A460−550, AN460−550, AT615−650, A615−650, AN615−650, AT655−690, A655−690, AN655−690 NS460−700, NS460−550, NS615−650, NS655−690, NS460−485, NS492−595, NS633−668, NS492−633, S460−700, S460−550 S615−650, S655−690, S460−485, S492−595, S633−668, S492−633, R492−595, R492−633, R550−633, R492−668, R550−668 R633−668, A615−650/A655−690, A460−550/A550−700, , M, SD, Me and F AF-420 AT463−700, AT463−550, A463−550, AN463−550, AT615−650, A615−650, AN615−650, AT655−690, A655−690, AN655−690 NS463−700, NS463−550, NS615−650, NS655−690, NS463−490, NS505−595, NS633−668, NS505−633, S463−700, S463−550 S615−650, S655−690, S463−490, S505−595, S633−668, S505−633, R505−595, R505−633, R550−633, R505−668, R550−668 R633−668, A615−650/A655−690, A463−550/A550−700, , M, SD, Me and F AF-430 AT476−700, AT476−560, A476−560, AN476−560, AT615−650, A615−650, AN615−650, AT655−690, A655−690, AN655−690 NS476−700, NS476−560, NS615−650, NS655−690, NS476−490, NS507−595, NS633−669, NS507−633, S476−700, S476−560 S615−650, S655−690, S476−490, S507−595, S633−669, S507−633, R507−595, R507−633, R560−633, R507−668, R560−669 R633−669, A615−650/A655−690, A476−560/A560−700, , M, SD, Me and F DR 390-720 AT390−710, AT390−450, AA390−450, AT430−540, AA500−600, AT500−600, NS390−720, NS390−450, NS500−600 NS390−600, NS430−540, NS470−600, NS580−600, NS640−720, NS430−450, S390−720, S390−450, S500−600, S390−600 S430−540, S470−600, S580−600, S640−720, S430−450, R390−720, R390−450, R500−600, R390−600, R430−540, R470−600 R600−580, R680−720, R420−470, R420−550, R420−575, R575−470, R575−550, R540−550, M, SD, Me and F
Table 3. Number of Principal Components (PCs) and nearest neighbors (K) used to evaluate k-Nearest Neighbors classification performance using each of the CEFS combinations of spatially-resolved bimodal spectroscopy (each distance D1, D2, D3 and their 4 possible combinations) for spectral features that allowed a pair-wise discrimination of either 6, 5 or 4 pairs of histological skin classes Distance D1 D2 D3 D1+D2+D3 D1+D2 D1+D3 D2+D3 6 pairs PC=1,2..., 5 PC=1,2 PC=1,2,3,4 PC=1,2..., 9 PC=1,2..., 6 PC=1,2..., 8 PC=1,2..., 5 K=1, 2, ...,15 K=1, 2, ...,15 K=1, 2, ...,15 K=1, 2, ...,15 K=1, 2, ...,15 K=1, 2, ...,15 K=1, 2, ...,15 ≤ 5 pairs PC=1,2..., 19 PC=1,2..., 21 PC=1,2..., 30 PC=1,2..., 53 PC=1,2..., 34 PC=1,2..., 42 PC=1,2..., 43 K=1, 2, ...,15 K=1, 2, ...,15 K=1, 2, ...,15 K=1, 2, ...,15 K=1, 2, ...,15 K=1, 2, ...,15 K=1, 2, ...,15 ≤ 4 pairs PC=1,2..., 23 PC=1,2..., 33 PC=1,2..., 38 PC=1,2..., 70 PC=1,2..., 47 PC=1,2..., 52 PC=1,2..., 60 K=1, 2, ...,15 K=1, 2, ...,15 K=1, 2, ...,15 K=1, 2, ...,15 K=1, 2, ...,15 K=1, 2, ...,15 K=1, 2, ...,15
Table 4. Number of Principal Components (PCs) used to evaluate Linear Discriminating Analysis (LDA) and Support Vector Machine (SVM) each of the CEFS combinations of spatially-resolved bimodal spectroscopy (each distance D1, D2, D3 and their 4 possible combinations) for spectral features that allowed a pair-wise discrimination of either 6, 5 or 4 pairs of histological skin classes
Distance D1 D2 D3 D1+D2+D3 D1+D2 D1+D3 D2+D3 6 pairs PC=1,2..., 5 PC=1,2 PC=1,2,3,4 PC=1,2..., 9 PC=1,2..., 6 PC=1,2..., 8 PC=1,2..., 5 ≤ 5 pairs PC=1,2..., 19 PC=1,2..., 21 PC=1,2..., 30 PC=1,2..., 53 PC=1,2..., 34 PC=1,2..., 42 PC=1,2..., 43 ≤ 4 pairs PC=1,2..., 23 PC=1,2..., 33 PC=1,2..., 38 PC=1,2..., 70 PC=1,2..., 47 PC=1,2..., 52 PC=1,2..., 60
Fig. 3. Receiver Operating Characteristic (ROC) curve. The best global diagnostic performance for the (SE,SP) couple is achieved when the data point is the furthest away from the median line.
ponents (PCs accounting for up to 99% of the information contained in the original set of data) in order to get the optimum results for sensitivity and specificity. Combina-tions of the different numbers of k and PCs retained for each CEFS combinations tested are shown in Table 3. As shown in Table 4, PCs accounting for up to 99% were taken into account for both LDA and SVM algorithms. The best classification accuracy achieved by each of the 378 algorithms tested (21 groups of spectral characteris-tics x 3 methods of classification x 6 pairs of histological classes) i.e. the optimum (Se, Sp) couple is found using a Receiver Operating Characteristic (ROC) test (see Fig. 3) that plots sensitivity as a function of (1 - specificity).
3 Results
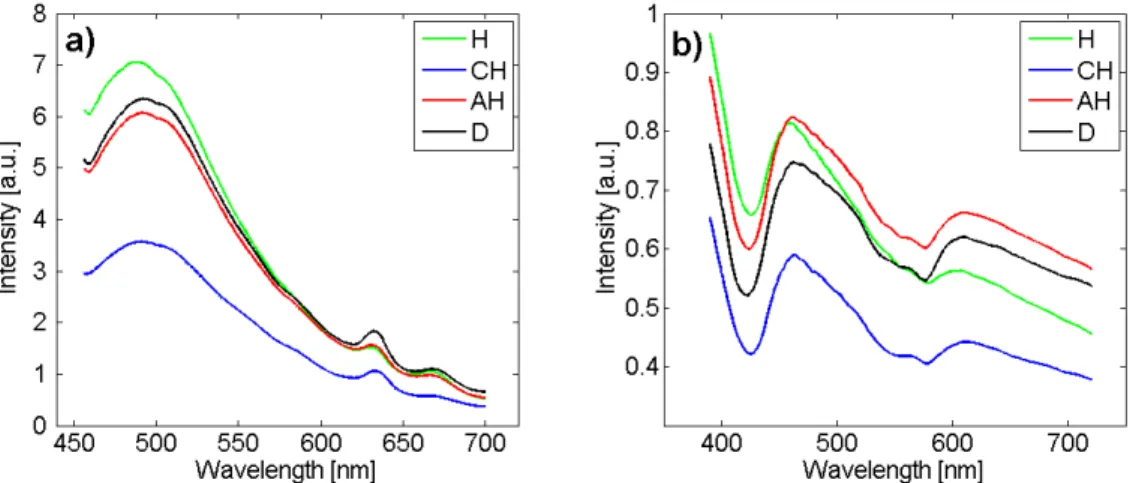
An example of mean AF spectra for a 410 nm-excitation at the shortest CEFS (D1=271 µm) is given in Figure 4a) for each histological class: H (n=84), CH (n=47), AH (n=64) and D (n=56). Significant global intensity differences can be noticed between H, CH and D on one hand and CH on the other hand. Global intensity is the highest for H, a little lower for AH and D (that are close to one an-other) and the lowest for CH. Focusing on the 500 nm main emission peak, AH and D display very close inten-sities (flavins characteristic emission). Typical emission porphyrins double peaks can be observed at 633 and 670 nm. A slight difference between D and AH is observed at the 633-nm emission peak (increased intensity for D). An example of mean DR spectra obtained at the short-est CEFS (D1) is given for each histological class (H, CH, AH and D) in Figure 4b). Same type of observation as for AF can be made: CH displays a significantly decreased
intensity level than H, AH and D. H displays a signifi-cantly decreased intensity compared to both AH and D in the 450-700 nm spectral range, especially for wavelengths longer than 600 nm. It is to be noticed that the global spec-tral shape of H classified tissues is very different from the three others. Conversely, intensity and shape of AH and D mean spectra are very similar. Finally, haemoglobin ab-sorption 577 nm-peak is deeper for CH, AH and D than for H.
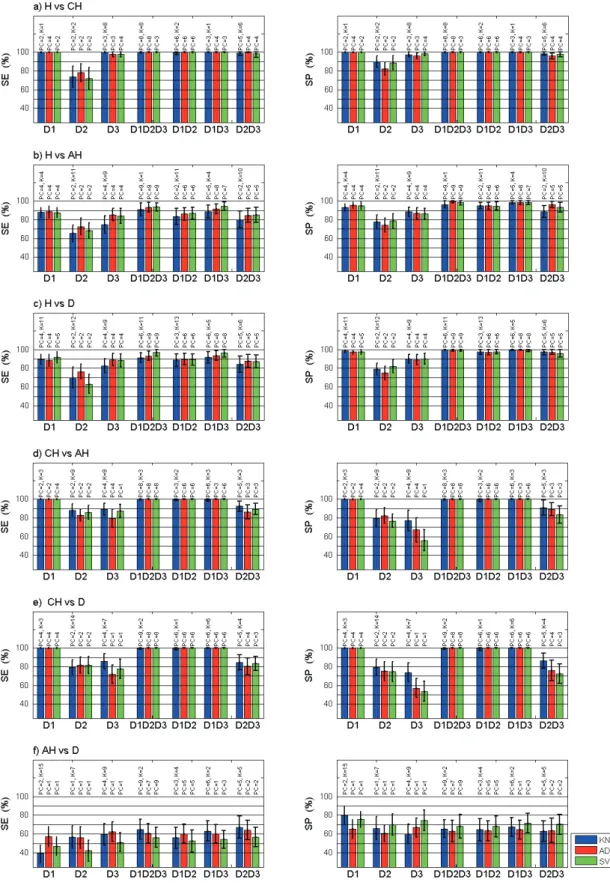
Sensitivity (SE) and specificity (SP) of pair-wise classifi-cation are given in the left and the right columns respec-tively of Figures 5 and 6: a) H vs. CH, b) H vs. AH, c) H vs. D, d) CH vs. AH, e) CH vs. D, f) AH vs. D. Each histogramm displays results for the three classification algorithms (k-NN, LDA and SVM) at each of the possi-ble combinations of CEFS tested: D1 alone, D2 alone, D3 alone, and D1D2D3, D1D2, D1D3, D2D3.
Results in Figure 5 were obtained from a set of 13 char-acteristics that are common to the discrimination of the 6 pairs of histological classes. Results in Figure 6 were obtained using a set of 186 characteristics that are com-mon to the discrimination of at least 5 pairs of histological classes out of the 6 tested.
No increase in discrimination accuracy was obtained us-ing a more extended set of spectral characteristics (306) common to the discrimination of 4 out of 6 pairs of his-tological classes compared to the 186 characteristics pre-viously tested. Thus such results are not showed in the current paper.
Using any of the classification algorithm for D1 and for the D1D2D3 combination, very high sensitivy and speci-ficity levels are obtained (close to 100%) using 13 (D1=6, D2=2 and D3=5) spectral characteristics (Figure 5). When discriminating H vs. AH and D, both sensitivity and speci-ficity increase (Se<90% and Sp close to 100%) when using the D1D2D3 combination. In the latter case, sensitivity is higher using the SVM algorithm than the two others. However, both sensitivity (around 65%) and specificity (<80%) are very low when discriminating AH from D. In that case, it is to be noticed that sensitivity is higher when using the k-NN method than when using the two others; however specificity is higher using D1 and on a global scale, SVM gives the highest results using any of the CEFS combinations.
When considering the 6 pairs of histological classes to dis-criminate, the D1D2D3 combination reaches higher scores except for the discrimination of AH and D. SVM tends to discriminate healthy (H) from any class of pathologic tis-sue (CH, AH and D) slightly better than k-NN and LDA algorithms. k-NN is slightly more efficient for longest CEFS in discriminating pathologic tissues from one an-other than LDA and SVM. Such results are always ob-tained for a large number of PCs, i.e. accounting for more than 99% of the information contained in the original data set.
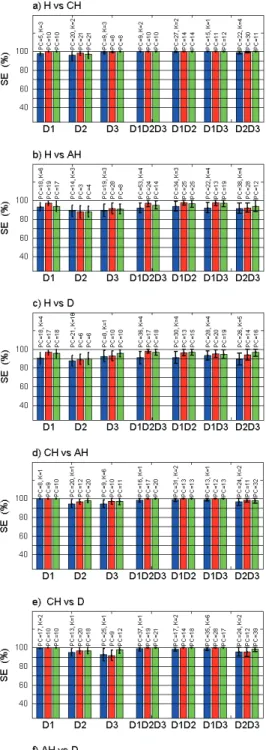
Results using the 186 (D1=44, D2=59 and D3=83) char-acteristics discriminating at least 5 out the 6 pairs of his-tological classes are shown in Figure 6. Same types of results as the ones using 13 (D1=6, D2=2 and D3=5)
char-Fig. 4. Mean preprocessed spectra acquired with the developed spectroscopy set-up at the shortest CEFS (D1 = 271 µm) for each of the four histological classes (H : n=84, CH: n=47, AH: n=64 and D: n=57). a) AF spectra obtained for a 410-nm excitation. b) DR spectra.
acteristics are obtained when discriminating CH from any other histological class: both sensitivity and specificity get very high (close to 100%) using the D1D2D3 combination and any classification algorithm. Results obtained whit extended sets of characteristics (Figure 6) are better than the ones with reduced sets (Figure 5), when considering the use of D2 or D3 alone and when considering the dis-crimination between H from AH and D (Se>95% and Sp close to 100%) using the D1D2D3 combination. In such cases, LDA and SVM give better results than the k-NN algorithm. Compared to results obtained in Figure 5, a global increase in the discrimination accuracy is noticed when discriminating AH from D: sensitivity is the highest when using D1 alone, D2 alone or D3 alone and specificity is the highest when using any of the three combinations of CEFS. The highest sensitivity (65%) is obtained using D1D2D3 with the LDA algorithm. The highest specificity (80%) is obtained using the D2D3 combination using the k-NN method (better than both DA and SVM for any CEFS in this case). Neither sensitivity nor specificity is significantly increased compared to the scores obtained an plotted in Figure 5 but they are more "balanced" at each CEFS alone or in combination. Thus the overall ac-curacy seems better even though it remains low.
The overall classification accuracy is increased especially when discriminating H vs. AH and D, using the D1D2D3 combination and using an extended set of spectral char-acteristics (from 13 to 186). Such best results are obtained for 10 to 20 PCs i.e. accounting for 90 to 95% of the infor-mation contained in the initial set of data.
Finally, sensitivity and specificity are close to 100% for all pairs of histological classes (except for AH vs. D) using the D1D2D3 combination and for spectral characteristics discriminating at least 5 out of the 6 pairs of histological classes. SVM and LDA seem globally a little more per-formant than k-NN. However, when discriminating AH from D, both sensitivity and specificity remain lower than 70 and 80% respectively.
4 Discussion
Our results confirm and extend other works published namely by Diagardjane et al. [19] in AF multi-excitation on chemically-induced mice skin cancers, by chang et al. [6] and Georgakoudi et al. [29] in bimodal and trimodal spectroscopies (AF multi-excitation and DR) on the cervix or by Inaguama et al. [30] in AF mono-excitation at 410 nm on human oral cancer. In these studies the authors men-tioned that haemoglobin absorption peaks (≈ 420, 545 and 575 nm) related to progressive hyperplastic vascular ac-tivity and autofluorescence emissions related to flavins, collagen, NADH and porphyrins (≈ 633 and 672 nm) can be used as biomarkers to differentiate between various precancerous tissue states. More specifically, the presence of increased porphyrin intensity peaks is also associated with hyperplastic modifications implying haemoglobin transformations [31–33], or changes in the cellular envi-ronment [20]. Inaguama et al. [30] also stated that por-phyrin may be continuously excreted by cancerous tis-sue as metabolites, therefore being found not only in ad-vanced cancer but also in early cancer stages.
The spectral characteristics (slopes, ratios, areas, etc.) ex-tracted and selected from our DR spectra are namely re-lated to haemoglobin absorption peaks and those from AF spectra are related to endogenous fluorophores emis-sion spectra of flavins, collagen, NADH and porphyrins. Looking at the averaged and standardized AF emission spectra for excitations at 390, 400, 410, 420 and 430 nm we observed that the overall intensity of the mean spectral curve in the emission band from 450 to 550 nm (related to collagen, NADH and flavins), for healthy classified spec-tra is higher than the one of the three other classes, for CH class is lower than the one of the other three classes, for D is slightly higher than AH ones. In the wavelength band 550 to 700 nm (related to flavins and porphyrins), the overall intensity of the mean spectral curve for CH is higher than the one of the three other classes, for H
Fig. 5. Mean sensitivity (SE) and specificity (SP) using 13 (D1=6, D2=2 and D3=5) characteristics common to the discrimination of the 6 pairs of histological classes: a) H (healthy) vs. CH (Compensatory Hyperplasia), b) H vs. AH (Atypical Hyperplasia), c) H vs. D (Dysplasia), d) CH vs. AH, e) CH vs. D et f) AH vs. D using several combinations of Collection to Excitation Fiber Separation (CEFS): D1=271 µm alone, D2 = 536 µm alone or D3 = 834 µm alone, or D1D2D3 or D1D2 or D1D3 or D2D3 and using each of the three classification algorithms: k-NN (k-Nearest Neighbor), LDA (Linear Discriminant Analysis) et SVM (Support Vector Machine). Error bars: standard deviation. PC and K indicated on top of each histogramm correspond to the number of Principal Components (PC) and of neighbors (K) used to obtain optimum results displayed here.
Fig. 6. Mean sensitivity (SE) and specificity (SP) using 186 (D1=44, D2=59 and D3=83) spectral characteristics common to the discrimination of at least 5 out the 6 pairs of histological classes : a) H (healthy) vs. CH (Compensatory Hyperplasia), b) H vs. AH (Atypical Hyperplasia), c) H vs. D (Dysplasia), d) CH vs. AH, e) CH vs. D et f) AH vs. D using several combinations of Collection to Excitation Fiber Separation (CEFS): D1=271 µm alone, D2 = 536 µm alone or D3 = 834 µm alone, or D1D2D3 or D1D2 or D1D3 or D2D3 and using each of the three classification algorithms: k-NN (k-Nearest Neighbor), LDA (Linear Discriminant Analysis) et SVM (Support Vector Machine). Error bars: standard deviation. PC and K indicated on top of each histogramm correspond to the number of Principal Components (PC) and of neighbors (K) used to obtain optimum results displayed here.
class is lower than the one of the three other classes, for AH class is slightly higher than D ones. For DR spectra acquired at distances D1, D2 and D3, the overall inten-sity of the mean spectral curve for CH classified spectra is lower than AH and D classes, for AH class is higher than CH and D classes, for D class is slightly lower than AH class. The overall intensity of the spectral curve of the class H is very different from the three others: for D1 in the wavelength band 390-450 nm (haemoglobin absorp-tion peak at 420 Nm) it is higher than the 3 others; in the band 450-575 nm it is lower than AH and in the band 575-720 it is lower than AH and D. Towards D2 and D3 the overall intensity of the mean spectral curve decreases for H classified spectra: in wavelength band 390-450 it is lower than AH but of the same amplitude as D; in the band 450-720 nm it is lower than AH and D.
While two valleys related to haemoglobin absorp-tion peaks (545 and 575 nm) are slightly visible for AF spectra acquired at distance D1, these valleys are more clearly visible (increased) for AF spectra acquired at dis-tance D3; furthermore the emission peak intensity at 633 nm (porphyrin) is also increased for AF spectra acquired at distance D3. In DR spectra acquired at distance D3, the haemoglobin absorption peaks are increased com-pared to those acquired at D1. When the distance be-tween excitation-reception fibers increases, the depth of skin probed increases [14], therefore absorption (in DR and AF) and porphyrin emission (in AF) increases (are more visible) for D3.
In a study characterizing early neoplastic changes in DMBA/TPA-induced mouse skin tumor model, using AF multi-excitation in the wavelength band 280-460 nm and LDA classification, Diagardjane et al. [19] obtained good results in discriminating different precancerous states. They defined 5 categories: category I (Healthy), category II (Inflammation and Hyperplasia), category III (Hyper-plasia and Dys(Hyper-plasia), category IV (Moderately Differen-tiated Squamous Cell Carcinoma) and category V (Poorly Differentiated Squamous Cell Carcinoma). Considering classifications for categories I, II and III using excita-tions in the wavelength band 360-420, their results were 62.1% < Se < 69.0% and 82.2% < Sp < 95.6%. In our work we concentrated on a refined classification within corre-sponding categories II and III and obtained higher Se and Sp, while only using NUV-UV excitations wavelengths higher than 360 nm (i.e. wavelengths with lowest or no mutagenic potential, in perspective of clinical implemen-tation). Chang et al. [6] discriminated healthy (Squamous Normal, SN) vs. Low and High Grades of Squamous In-traepithelial cervical Lesions (LGSIL, HGSIL), using AF multi-excitation in the range 330-480 nm and DR spec-troscopies, in combination with PCA and Mahalanobis distance algorithm. Several pairs of discrimination were defined (SN vs. CN, SN vs. LGSIL, SN vs. HGSIL, CN vs. LGSIL and CN vs. HGSIL). Considering classification of discrimination pairs with SN and LHSIL using AF multi-excitation and DR, their results were 53% < Se < 95% and 69% < Sp < 91%. Although our work concerns another type of epithelium, we proposed here a refined
classifica-tion of normal and low grades lesions into 4 subclasses (H, CH) and (AH, D). Our results are globally higher with Se and Sp > 95% and a lowest discriminating capability for AH vs. D with Sp ≈ 74% and Se ≈ 63%.
Our results (Se and Sp ≈ 100% for CH vs. others; Sp ≈ 100% and Se > 95% for H vs. AH or D; Sp ≈ 74% and Se ≈ 63% for AH vs. D are also in good agreement with various works that have used classification techniques like SVM or Artificial Neural Networks (ANN). Lin et al. [26] developed an algorithm based on SVM (linear and non linear), using AF excitations at 405 and 436 nm for discriminating normal and cancerous nasopharyngeal tis-sues. They achieved Se = 94% and Sp = 97% using linear SVM and Se = 95% and Sp = 99% with non linear SVM. PCA can substantially reduce the complexity of an SVM algorithm without sacrificing the performance of the al-gorithm. But when they combined PCA and SVM meth-ods, these algorithms produced the same results. Nayak et al. [34] developed algorithms based on PCA and ANN, using pulsed laser-induced autofluorescence at 325 nm excitation for discriminating normal, premalignant and malignant human oral tissues. They achieved Se = 100% and Sp = 92.9% using linear PCA and Se = 100% and Sp = 96.5% with ANN. Majunder et al. [35] developed an algorithm based on SVM, using AF excitation at 337 nm for discriminating healthy squamous vs. early SCC hu-man oral tissues. They achieved Se = 91% and Sp = 96%. Finally, in order to improve the discrimination efficiency of AH vs. D (lowest discriminating capability with Sp ≈ 74% and Se ≈ 63%), we carried out classification by adding more characteristics which exclusively discriminate AH vs. D to the set of spectral characteristics selected. This ap-proach did not improve significantly the previous results achieved. New methods of nonlinear spectral character-istics selection and nonlinear classification algorithms are to be tested to further investigate increased performance for AH vs. D classification.
5 Conclusion
A simple and tunable instrumentation was developed to acquire both AF and DR spectra in a bimodal approach at several CEFS and applied to monitor healthy to pre-cancerous evolution in vivo of skin mice due to chronic UV-irradiation. Bimodal spectroscopy’s accuracy in dis-criminating four classes of mouse skin histological stages was evaluated. Various sets of spectral characteristics (ex-tracted from the spectral intensity curves) were selected based on statistical discrimination of the pair-wise classes. After data reduction by PCA results obtained with three classification algorithms were compared. Since both sen-sitivity and specificity are very high when discriminating healthy from any type of hyperplastic tissue on one hand and CH from AH and D on the other hand, bimodal spec-troscopy seems a promising tool to help dermatologists and histo-pathologists to increase diagnostic accuracy of skin lesions. However lowest diagnostic accuracy was
achieved when discriminating AH from D using any of the three linear classification algorithm we tested. It is to be noticed that for these 5 pairs of histological classes, spa-tial resolution improves classification accuracy and SVM and LDA give better results than the k-NN algorithm. Further studies need to be done to confirm these results on human patients.
Acknowledgments
This work was supported by the French association Ligue Contre le Cancer (CD 52, 54), Nancy-University, the Re-gion Lorraine and the Programme Alβan, the European Union Programme of High Level Scholarships for Latin America, scholarship No. E05D057651MX.
References
1. M. Takata, Int. J. Clin 10 (2005) 391–397.
2. M. Rajeswari, Lab. Invest. 83(9) (2003) 1279–1283. 3. J. Oh, J. Biomed. Opt. 11(3) (2006) 032034. 4. I. Bigio, Phys. Med. Biol 42 (1997) 803.
5. V. Tuchin, Handbook of Optical Biomedical Diagnostics, 2002.
6. S. Chang, J. Biomed. Opt. 10(2) (2005) 024031. 7. D. Veld, Lasers Surg. Med. 36 (2005) 356. 8. I. Georgakoudi, Gastroenterol. 120 (2001) 1620. 9. U. Utzinger, J. Biomed. Opt. 8(1) (2003) 121. 10. C. Zhu, J. Biomed. Opt. 10(02) (2005) 024032. 11. J. Tunnell, Technol. Cancer Res. Treat. 2 (2003) 505. 12. R. Zangaro, Appl. Opt. 35 (1996) 5211.
13. A. Zuluaga, Appl. Spectrosc. 53 (1999) 302. 14. K. Katika, Appl. Opt. 45(17) (2006) 4174–4183. 15. D. Veld, J. Biomed. Opt. 9(5) (2004) 940–950. 16. N. Marín, J. Biomed. Opt. 11(1) (2006) 014010.
17. E. Péry, Ph.D. thesis, Institut National Polytechnique of Lor-raine (2007).
18. V. Wallace, Phys. Med. Biol. 45 (2000) 735–751. 19. P. Diagardjane, Lasers Surg. Med. 37 (2005) 382. 20. S. Balasubramanian, Carcinogenesis 16 (1995) 2461. 21. B. Murphy, J. Biomed. Opt. 10(6) (2005) 064020. 22. N. Marín, Gyneco. Oncol. 99 (2005) S116–S120. 23. S. Kamath, J. Biomed. Opt. 12(1) (2007) 014028. 24. D. Peña, Análsis de datos multivariantes, 2002. 25. N. H. Timm, Applied multivariate analysis, 2002. 26. W. Lin, J. Biomed. Opt. 9(1) (2004) 180–186.
27. C. Burges, Data Min. Knowl. Discov. 2 (1998) 121–167. 28. V. Vapnik, The Nature of Statistical Learning Theory, 1995. 29. I. Georgakoudi, Am. J. Obstet. Gynecol. 186(3) (2002) 374–
382.
30. M. Inaguma, Cancer 86 (1999) 32201–11. 31. Y. Yang, Lasers Surg. Med. 7 (1987) 528–532. 32. Z. Malik, Cell Differentiation 8 (1979) 223–33. 33. T. Nishisaka, J. Jpn. Soc. Laser Med. 16 (1995) 11–15. 34. G. Nayak, Biopolumers 82 (2006) 152–166.