MÉMOIRE PRÉSENTÉ À
L'UNIVERSITÉ DU QUÉBEC À TROIS-RIVIÈRES
COMME EXIGENCE PARTIELLE
DE LA MAÎTRISE EN SCIENCES DE L'ENVIRONNEMENT
PAR
MYRIAM BEAUCHAMP
VARIABILITÉ SPA TIO-TEMPORELLE DE LA MAGNITUDE ET DE LA PÉRIODE D'OCCURRENCE DES CRUES SAISONNIÈRES HIVERNALES
AU QUÉBEC MÉRIDIONAL
Université du Québec à Trois-Rivières
Service de la bibliothèque
Avertissement
L’auteur de ce mémoire ou de cette thèse a autorisé l’Université du Québec
à Trois-Rivières à diffuser, à des fins non lucratives, une copie de son
mémoire ou de sa thèse.
Cette diffusion n’entraîne pas une renonciation de la part de l’auteur à ses
droits de propriété intellectuelle, incluant le droit d’auteur, sur ce mémoire
ou cette thèse. Notamment, la reproduction ou la publication de la totalité
ou d’une partie importante de ce mémoire ou de cette thèse requiert son
autorisation.
Directeur
Ali A. Assani (ph. D.)
Laboratoire d'hydroclimatologie et de Géomorphologie fluviale et Centre de recherche sur les interactions bassins versants - écosystèmes aquatiques (RIVE)
Département des sciences de l'environnement, section géographie Université du Québec à Trois-Rivières
c.P. 500, Trois-Rivières (Québec) G9A5H7
Membres du comité d'évaluation Jean-Francois Quessy (ph. D.)
Département de mathématiques et d'informatique Université du Québec à Trois-Rivières
C.P. 500, Trois-Rivières (Québec) G9A5H7
Mhamed Mesfioui (ph. D.)
Département de mathématiques et d'informatique Université du Québec à Trois-Rivières
C.P. 500, Trois-Rivières (Québec) G9A5H7
La rédaction de ce mémoire s'est faite conformément à l'article 138.1 du Règlement des études de cycles supérieurs de l'UQTR «rédaction sous forme d'articles scientifiques» permettant de présenter les résultats obtenus dans le cadre d'une maîtrise de recherche' en sciences de l'environnement sous forme d'article scientifique plutôt que sous forme traditionnelle. Ce mémoire divulgue la synthèse de mes travaux portant sur la variabilité spatio-temporelle de la magnitude et de la période d'occurrence des débits maximums journaliers hivernaux au Québec méridional (Canada).
Ce document est divisé en trois chapitres. Le premier consiste en une introduction suivie d'un résumé substantiel du projet de recherche. Le second chapitre est présenté sous la forme d'article scientifique. Cet article a pour titre: «Temporal variability of the magnitude and timing ofwinter maximum daily flows in southern Quebec (Canada)>> et a été soumis à la revue Water Resources Research. Le troisième et dernier chapitre expose les conclusions générales qui ressortent de cette étude. Je suis première auteure (M.B) de cet article suivi de M. Ali A. Assani (A.A).
Conception et idées de recherche : A.A, M.B Formulation des objectifs et hypothèses: M.B, A.A Analyses des données: M.B, A.A
Résultats et Discussion: M.B, A.A Écriture de l'article: M.B, A.A
Je tiens tout d'abord à remercier mon directeur de recherche M. Ali A. Assani, sans qui cette recherche n'aurait jamais été possible. Son incroyable expertise et connaissance en hydro-climatologie m'ont été d'une aide précieuse afin de mener à terme le présent mémoire. Sa patience et sa disponibilité hors du commun ont également rendu ma tâche des plus agréables et des plus enrichissantes.
Un merCI particulier aux professeurs à la maîtrise en SCIences de l'environnement dont j'ai eu la chance de côtoyer tout au long de mon cheminement, MM. Marco Rodriguez et Guy Samson. Leurs précieux conseils m'ont été plus qu'utiles dans la réalisation complexe de ce travail.
Je remercie également l'Université du Québec à Trois-Rivières d'avoir cru en ma candidature et de m'avoir ainsi permis de réaliser un aussi beau projet qui s'inscrit dans mon champ d'intérêt de longue date, soit les changements climatiques.
Merci à mes collègues ainsi que mes employeurs du domaine qUi ont su m'appuyer, m'apporter des connaissances supplémentaires ainsi que la possibilité de poursuivre mes études universitaires tout en mettant en application mes connaissances. Ce fût un réel plaisir de combiner les deux et de vous avoir comme fiers partenaires.
Finalement, un grand merci à ma famille et à mon conjoint qui ont su me supporter dans cette aventure, m'encourageant dans les moments difficiles et me félicitant dans les meilleurs. Tout au long de ces deux années, plusieurs obstacles se sont dressés dans ma vie personnelle et professionnelle et sans leur aide précieuse, je ne déposerais peut-être pas mon mémoire aujourd'hui.
La présente étude a pour sujet la variabilité spatio-temporelle de la magnitude et de la période d'occurrence des débits maximums journaliers en hiver au Québec pour la période de 1934 à 2010. Cette recherche s'intègre dans le vaste domaine des changements climatiques, à savoir si la hausse des températures survenue depuis les années 1970 au Québec a un impact sur les débits maximums en hiver (novembre à mars). Ce qui est admis par de nombreuses études (Yagouti et al. 2006, Boyer et al. 2010) est que de tels changements de climat ont été observés au Québec, notamment par la hausse des précipitations sous forme de pluie, la diminution de la quantité de neige et la hausse des températures, depuis les années 1970. Cependant, aucune étude n'a encore été menée sur l'impact de ces changements climatiques sur les débits hivernaux des rivières québécoises. Toutefois, une étude récente de Assani et al. (2014) a démontré une diminution des niveaux d'eau à la station de Sorel-Tracy, sur le fleuve Saint-Laurent, qui serait due à une baisse de la quantité de neige. Il est donc maintenant justifié de se poser la question à savoir si le débit de différentes rivières, toutes des tributaires du fleuve Saint-Laurent, en font de même.
La magnitude et la période de dix-sept affluents du fleuve, répartis dans trois régions hydroclimatiques, ont été étudiées. Diverses méthodes statistiques ont été utilisées afm d'atteindre cet objectif, telles la méthode de Lombard, la méthode de régionalisation (Anctil et al.), la corrélation de rang de Spearman, l'analyse canonique de corrélation et l'analyse en composante principale.
L'analyse de la variabilité temporelle de la magnitude des débits maximums journaliers de ces 17 affluents au moyen de la méthode de Lombard a révélé une rupture de leurs moyennes survenue durant la décennie 1970. Cette rupture s'est traduite par une hausse relativement importante de la magnitude après cette décennie. Cette hausse résulte de la fonte de neige qui survient fréquemment vers la fin de la saison hivernale après 1970. L'analyse canonique des corrélations a révélé que la magnitude des débits maximums journaliers est significativement corrélée à l'oscillation pacifique décennale alors que la période d'occurrence de ces débits l'est à l'oscillation nord-atlantique.
Mots clés: Débits maximums journaliers, période d'occurrence, Hiver, indices climatiques, Méthode de Lombard, Méthode de Copules, Analyse canonique de corrélations, Québec.
AVANT-PROPOS ... iü
REMERCIEME-NTS ...
iv, ,
RESUME...
vLISTE DES TABLEAUX ET FIGURE ... vüi LISTE DES ABRÉVIATIONS, SIGLES ET ACRONYMES ... ix
CHAPITRE 1 INTRODUCTION ... 1
1.1 Mise en contexte... 1
1.1.1 Les changements climatiques ... 1
1.2 La problématique - Revue de littérature... 3
1.3 Objectifs et hypothèses d'étude ... 4
1.4 Méthodologie ... ... ... 5
1.4.1 Région de l'étude et sélection des données (rivières)... 5
1.4.2 Indices climatiques ... 7
1.4.2.1 Oscillation atlantique multi-décennale ... 8
1.4.2.2 Oscillation arctique... 8
1.4.2.3 Oscillation nord-atlantique ... 9
1.4.2.4 Oscillation pacifique décennale... 9
1.4.2.5 Oscillation australe ... ... ... ... ... 10
1.4.3 Analyse statistique de données ... 10
1.5 Résultats et conclusions... Il CHAPITRE II TEMPORAL V ARIABILITY OF THE MAGNITUDE AND TIMING OF WINTER MAXIMUM DAILY FLOWS IN SOUTHERN QUEBEC (CANADA)... 13
Abstract ... 15
Introduction... 16
Methods... 18
\ Station location and sources of flow data... 18
Statistical analysis ... 19
Hydroclimatic series ... ... ... ... ... ... 19
Analysis of shift in mean values of hydrologic series... 20
Analysis of the temporal variability of the dependence between the magnitude and timing of winter maximum daily flows using the copula method... 22
Analysis of the link between c1imate indices and characteristics (magnitude and timing) of winter maximum daily flows ... 23
Results... 25
Analysis of shi ft in mean values of hydrologic series... 25
Analysis of the timing of winter maximum daily flows ... 25
Analysis of the dependence between the magnitude and date of occurrence ofwinter maximum daily flows... 26
Link between the magnitude and date of occurrence of maximum daily flows. 27 Discussion and conclusions ... 27
References... 29
Tables and Figures ... ... ... ... 33
CHAPITRE III CONCLUSION... 45
Tableau Page
1.1 Rivières analysées... 6 1.2 Indices climatiques... 8
Figure
UQTR NOAA ONA OAM OA OAU OPD ENSO SON JFM SOND DJFM CCA
Université du Québec à Trois-Rivières
National Oceanic and Atmospheric Administration Oscillation nord-atlantique
Oscillation atlantique multi-décennale Oscillation arctique
Oscillation australe
Oscillation pacifique décennale El Nino et Oscillation australe Septembre-Octobre-Novembre Janvier-Février-Mars
Septembre-Octobre-Novembre-Décembre Décembre-Janvier-Février-Mars
INTRODUCTION
1.1 Mise en contexte
1.1.1 Les changements climatiques
La hausse des températures est une des nombreuses conséquences aux
changements climatiques qui sévissent à travers le monde entier depuis la
décennie 1970. Ces changements du climat apportent avec eux de nombreuses et diverses conséquences telle l'amplification des phénomènes hydrologiques extrêmes, comme les sécheresses et les inondations (p. ex., Cloke et al., 2010; Gosling et al., 2011; Kundzewicz et al., 2010). Ainsi, de nombreux travaux sont de plus en plus consacrés à l'analyse de la variabilité interannuelle de ces phénomènes extrêmes dans de nombreux pays (p. ex., Bhutiyani et al., 2008; Burn et Hag Elnur, 2002; Burn et al., 2008; Carson, 2007; Cunderlik et Ouarda, 2009; Dettinger, 2011; Douglas et al., 2000; Fanta et al.,
2001; Hannaford et Marsh, 2008; Jiang et al., 2005; Kundzewicz et al., 2005,
Lindestrom et Bergstrom, 2004; Masih et al., 2011; Petrow et Merz, 2009; Pinter et al., 2006; Robson, 2002; St.George, 2007; Svensson et al., 2005; Villarini et Smith, 2010;
Villarini et al., 2009, 2010, 2011a, 2011b, 2011c; Zimmer et Merz, 2009).
Pour illustrer l'ampleur de ces phénomènes, prenons l'exemple de la République tchèque où, en 2002, on a mesuré le débit le plus élevé de la Vltava (longue rivière située à Prague) depuis les 175 dernières années. Même situation à Dresde en Allemagne, la même année, où les eaux de l'Elbe ont atteint 940 cm, alors que la «barre» des 800 cm n'avait jamais été dépassée entre 1880 et 2001, ce qui en dit long
sur l'ampleur de cette catastrophe hydrologique (Kundzewicz et al., 2008). Ces
phénomènes se déroulent également à l'échelle locale, affectant le climat du Québec. Rappelons ici les inondations de Saint-Jean-sur-Ie-Richelieu en 2011 qui causèrent de
nombreux dégâts et blessés. Bien que le Québec soit choyé de posséder quatre saisons, celles-ci ont également des impacts sur les débits des rivières et leurs régimes hydrologiques. Lorsque le printemps arrive, la quantité de neige présente au sol fond parfois très rapidement, causant des crues printanières de haute intensité. Celles-ci, tout comme les crues estivo-automnales, sont bien documentées au Québec, à l'instar des crues hivernales. Les études réalisées abordent en majorité l'impact de la hausse des températures sur ces deux types de crues (Assani et al., 2010, 2011, Mazouz et al., 2012). Trois principales conclusions ont été tirées de ces études.
• En ce qui concerne la régionalisation hydrologique, ces auteurs ont identifié trois régions hydrologiques pour les crues printanières générées principalement par la fonte de neiges: deux régions en rive sud et une région en rive nord. Quant aux crues estivo-automnales générées exclusivement par la pluie, on a délimité quatre régions hydrologiques: trois en rive sud et une seule en rive nord qui est identique à celle des crues printanières.
• Quant à la variabilité interannuelle des débits de crues dans les différentes régions hydrologiques, Assani et al. (2010) ont observé une hausse significative de la magnitude des crues printanières en rive nord alors qu'aucun changement n'a été observé dans les deux régions hydrologiques de la rive sud. Cette même hausse affecte aussi la magnitude des débits de crues estivo-automnales en rive nord. En rive sud, contrairement aux crues printanières, la magnitude des crues estivo-automnales augmente significativement dans le temps, au sud du 47°N.
• Enfm, en ce qui concerne la relation entre les indices climatiques et les débits de crues, en rive nord, les débits de crues saisonnières sont significativement corrélés à l'oscillation atlantique multi-décennale (OAM) au printemps et à l'oscillation arctique (OA) en été et en automne. En rive sud au nord du 47°N, ils sont corrélés à l'oscillation australe (OAU) durant les deux saisons alors qu'au sud de ce parallèle, ils sont significativement corrélés à l'oscillation arctique au printemps.
Le présent document vise donc à étudier le phénomène de la variabilité spatio-temporelle des débits maximums journaliers en hiver, permettant ainsi de documenter les crues hivernales et leurs impacts.
1.2 La problématique - Revue de littérature
Les phénomènes hydroclimatiques extrêmes tels qu'énumérés plus haut, affectent
non seulement l'économie des régions touchées, mais également le mode de vie des
populations y demeurant. 250 200 150 100 50
o
Economie Losses ,..r -_===Lr----, r==J0
1950s 1960s 1970s 19808 19908 20005o
EconomÎc loss in US $ (billions)~ --1
~
....J 250 200 150 100 50o
Flood Oeaths r-r
.-
l-I .----..c==:L[==:J~ ~_ 1950s 19)Os 1970s 1980s 1990s 2000sOFlood deaths (thousands)
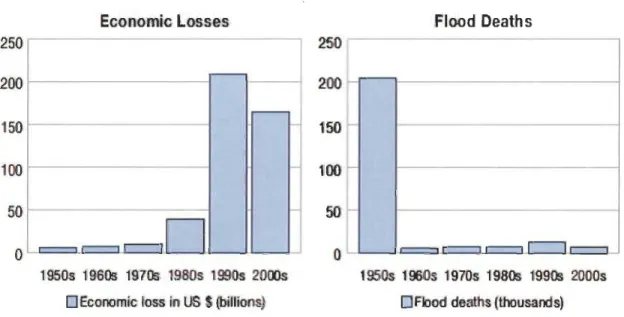
Figure 1.1 Pertes économiques et mortalités (tirée de Jha et al., 2012).
Comme l'illustre la figure 1.1, les pertes financières causées par les inondations
ont augmenté de manière exponentielle durant les deux dernières décennies. Cependant,
le nombre de morts qui leur sont associés a significativement diminué depuis 1950. Il s'ensuit que les inondations constituent de plus en plus un fléau dans l'économie mondiale et ses impacts seraient amplifiés dans le temps en raison du réchauffement climatique. Les phénomènes extrêmes comme les inondations sont de plus en plus fréquents et d'intensité élevée, ce qui justifie, en partie l'exponentiation des coûts.
À cela s'ajoutent les effets indirects à long terme comme les maladies, la nutrition réduite, les possibilités d'éducation et la perte de certains moyens de subsistance.
Cependant, ces. phénomènes sont également plus connus et étudiés, notamment dans les
régions les plus propices à ceux-ci, ce qui permet de les prévenir davantage. Des plans de mesures d'urgence et d'évacuation permettent aujourd'hui de réduire les pertes
humaines en prévoyant ces inondations et en avertissant les populations à temps.
D'après les simulations des modèles climatiques couplés aux modèles
hydrologiques, les impacts du réchauffement climatique au Québec se traduiront
principalement par une hausse de la température et des précipitations sous forme de pluies en hiver (Boyer et al., 2010). Du point de vue hydrologique, ces changements climatiques provoqueront une hausse de la magnitude et de la fréquence des crues hivernales susceptibles d'accélérer l'érosion des berges des rivières, notamment en raison de la fonte des glaces et de leur dérive (Verhaar et al. 2010, 2011). Bien que la hausse de la température fût déjà observée au Québec depuis la décennie 1970 (Hudon, 2005) et que de nombreuses études démontrent l'impact de celle-ci sur la variabilité interannuelle des débits (Assani et al. 2010, Bhutiyani et al. 2008, Burn et al. 2004, Carson et al. 2007), il n'existe encore aucune étude sur les impacts des changements climatiques sur les débits hivernaux au Québec. Rappelons que ces derniers peuvent être générés principalement par la pluie qui peut provoquer ou non une fonte de neige lorsque celle-ci est présente au sol. Contrairement aux crues printanières et
estivo-automnales, les crues hivernales sont générées par des processus complexes.
1.3 Objectifs et hypothèses d'étude
À la lumière de ces considérations, notre projet de recherche poursuit les objectifs suivants:
• Analyser la variabilité spatio-temporelle de la magnitude des débits maximums
journaliers hivernaux au Québec méridional. Cet objectif repose sur
significativement diminué après 1970, en raison de la diminution de la quantité de neige, et ce malgré la hausse de la température et de la quantité de pluies.
• Analyser la variabilité spatio-temporelle de la période d'occurrence des débits maximums journaliers hivernaux au Québec méridional. Cet objectif repose sur l'hypothèse suivante: on s'attend à ce que les débits maximums journaliers hivernaux surviennent tôt dans la saison, après 1970, en raison de la hausse de la température.
• Analyser la relation entre les caractéristiques (magnitude et période d'occurrence) des débits maximums journaliers hivernaux et les indices climatiques au Québec méridional. Cet objectif repose sur l'hypothèse suivante: les deux caractéristiques des débits maximums journaliers hivernaux sont corrélées aux mêmes indices climatiques.
1.4 Méthodologie
1.4.1 Région de l'étude et sélection des données (rivières)
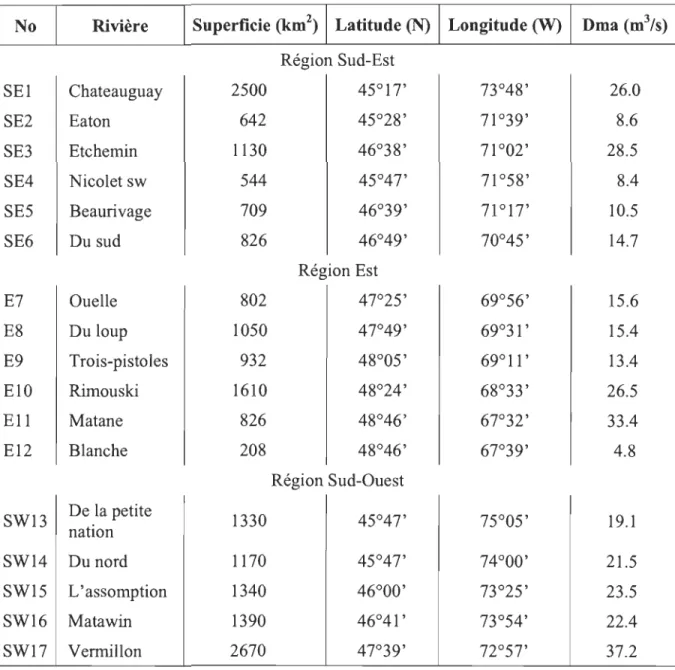
L'étude porte sur 17 rivières réparties sur la rive sud et nord du fleuve St-Laurent, au Québec. Seules les rivières dont les débits sont mesurés de manière continue depuis 1934 et étant peu affectés par les activités anthropiques (pas de barrages) ont été retenues. Les informations détaillées des rivières à l'étude sont présentées au tableau 1.1. Les données des débits journaliers ont été extraites du site Web d'Environnement Canada (http://www.wsc.ec.gc.ca/hydat/H20/index e.cfm consulté en mars 2011).
Tableau 1.1 Rivières analysées
No Rivière Superficie (km2) Latitude (N) Longitude (W) Dma (m3/s) Région Sud-Est SEI Chateauguay 2500 45°17' 73°48' 26.0 SE2 Eaton 642 45°28' 71 °39' 8.6 SE3 Etchemin 1130 46°38' 71 °02' 28.5 SE4 Nicolet sw 544 45°47' 71 °58' 8.4 SE5 Beaurivage 709 46°39' 71°17' 10.5 SE6 Du sud 826 46°49' 70°45' 14.7 Région Est E7 Ouelle 802 47°25' 69°56' 15.6 E8 Du loup 1050 47°49' 69°31 ' 15.4 E9 Trois-pistoles 932 48°05' 69°11 ' 13.4 E10 Rimouski 1610 48°24' 68°33' 26.5 E11 Matane 826 48°46' 67°32' 33.4 E12 Blanche 208 48°46' 67°39' 4.8 Région Sud-Ouest SW13 De la petite 1330 45°47' 75°05' 19.1 nation SW14 Du nord 1170 45°47' 74°00' 21.5 SW15 L'assomption 1340 46°00' 73°25' 23.5 SW16 Matawin 1390 46°41 ' 73°54' 22.4 SW17 Vermillon 2670 47°39' 72°57' 37.2
1.4.2 Indices climatiques
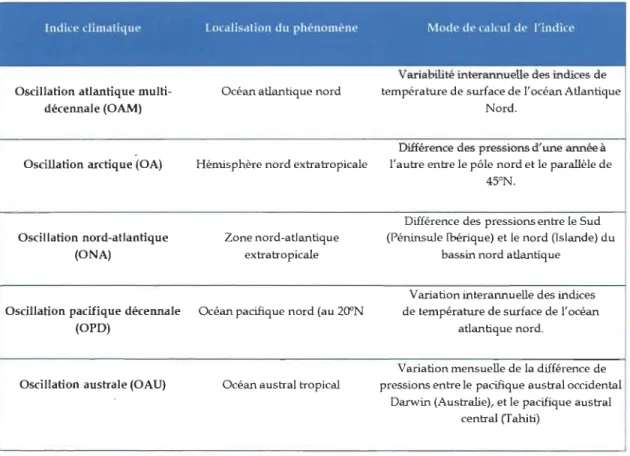
Les données des indices climatiques ont été extraites du site web de la NOAA http://www.cdc.noaa.gov/Climatelndices/List consulté le 23 mars 2012). Cinq indices climatiques ont été retenus en raison de leur influence déjà démontrée sur la variabilité interannuelle en Amérique du Nord, au Canada et au Québec (p. ex. Anctil and Coulibaly, 2004; Assani et al., 2006, 2008, 2010; Coulibaly and Burn, 2004, 2005; Déry and Wood, 2004, 2005; McCabe et al., 2004). Il s'agit des indices suivant: l'oscillation atlantique multi-décennale (OAM) , l'oscillation arctique (OA), l'oscillation nord-atlantique (ONA), l'oscillation australe (OAU) et l'oscillation pacifique décennale (OPD).
L'influence qu'ont les indices climatiques sur les débits maximums hivernaux n'est pas négligeable. En effet, ces indices vont interagir quant à la quantité de pluie et de neige tombée et ils vont aussi influencer la date de fonte de la neige au sol. Ces trois variables vont ainsi avoir un impact sur les crues hivernales, selon l'augmentation ou la diminution des précipitations sous forme liquide ou solide ou encore la fonte potentiellement précipitée de la neige à la fin de l'hiver.
Tableau 1.2 Indices climatiques
Indke dimdtique Localisdlion du phénomène Mode dl' cdkul dl' l'indke
Variabilité interannuelle des indices de Oscillation atlantique multi- Océan atlantique nord température de surface de l'océan Atlantique
décennale (OAM) Nord.
Différence des pressions d'une année à Oscillation arctique (OA) Hémisphère nord extra tropicale l'autre entre le pôle nord et le parallèle de
45°N.
Différence des pressions entre le Sud Oscillation nord-atlantique Zone nord-atlantique (Péninsule Ibérique) et le nord (Islande) du
(ONA) extratropicale bassin nord atlantique
Variation interannuelle des indices Oscillation pacifique décennale Océan pacifique nord (au 20"N de température de surface de l'océan
(OPD) atlantique nord.
Variation mensuelle de la différence de Oscillation australe (OAU) Océan austral tropical pressions entre le pacifique austral occidental
Darwin (Australie), et le pacifique austral central (Tahiti)
1.4.2.1 Oscillation atlantique multi-décennale
L'oscillation atlantique multi-décennale (OAM) est une variation de la température de surface de la mer qui s'étend sur plusieurs décennies, de 40 à 80 ans, observée dans le Nord de l'Océan Atlantique en soustrayant la variation linéaire due au réchauffement climatique. L'OAM est calculée en soustrayant de la température de surface de la mer la composante due à l'effet de l'augmentation des gaz à effet de serre sur l'atmosphère (NOAA, 2013).
1.4.2.2 Oscillation arctique
L'oscillation arctique (OA) est un mode à grande échelle de la variabilité du climat, également dénommé le mode annulaire de l'hémisphère Nord. L'AO est un
modèle de climat caractérisé par des vents circulant dans le sens anti-horaire autour de
l'Arctique, à environ 55° de latitude Nord. Lorsque l'AO est en phase positive, un anneau
de vents circulant autour du pôle Nord intervient pour limiter l'air plus froid dans toutes les régions polaires. Cette ceinture des vents s'affaiblit et est plus déformée dans la phase négative de l'AO, qui permet une pénétration plus facile de froid vers le sud et a augmenté l'activité cyclonique dans les latitudes moyennes (NOAA, 2013).
1.4.2.3 Oscillation nord-atlantique
L'oscillation nord-atlantique (ONA) est définie par la variation de la pression atmosphérique au-dessus du bassin nord-atlantique. Il est exprimé par un indice fondé sur la différence de pressions entre le sud (péninsule Ibérique) et le nord (Islande) du bassin atlantique nord. En pratique, on considère les pressions mesurées à la station de Ponta Delgada (Açores) et à Stykkisholmur ou à Reykjavik (Islande). Les causes climatiques de cette oscillation ne sont pas encore élucidées. Mais selon Leroux (2000), cette variabilité de pression dans l'Atlantique nord est liée aux activités des anticyclones mobiles polaires qui sont des cellules de masses d'air froid qui descendent du pôle nord. Les conséquences climatiques de cette oscillation ont surtout été analysées sur le continent européen bien que leur impact sur le temps en Amérique du Nord a été reconnu (Sheridan, 2003). Ainsi, des indices positifs (phase haute) de cette oscillation se traduisent par de forts vents soufflant de l'océan Atlantique vers le continent européen. Le climat y est alors sous influence océanique. En Phase basse (indice négatif), les deux centres sont affaiblis, les vents d'ouest le sont aussi et l'Europe subit les rigueurs du climat continental, particulièrement en hiver (Wanner, 1999). L'influence de cette oscillation s'étendrait même en hémisphère sud (Poveda et Mesa, 1996).
1.4.2.4 Oscillation pacifique décennale
L'oscillation pacifique décennale (OPD) est souvent décrite comme un modèle de type El Nillo d'une longue durée de vie de la variabilité climatique du Pacifique (Zhang
répandues dans le bassin du Pacifique et du climat en Amérique du Nord. En parallèle avec le phénomène ENSO, les phases extrêmes de l'OPD ont été classées comme étant soit chaud ou froid, tel que défmi par les anomalies de température de l'océan dans l'océan Pacifique Nord-est et tropical. Lorsque TSM sont anormalement froides dans le Pacifique Nord intérieur et chaudes le long de la côte du Pacifique, et quand les pressions au niveau de la mer sont inférieures à moyenne au-dessus du Pacifique Nord, l'OPD a une valeur positive. Lorsque les configurations d'anomalies climatiques sont inversées ou au-dessus des pressions de moyenne altitude au-dessus du Pacifique Nord, l'OPD a une valeur négative (ONAA, 2013).
1.4.2.5 Oscillation australe
L'oscillation australe (OA) est un phénomène climatique se traduisant dans l'atmosphère par une variation à intervalles irréguliers (de 3 à 7 ans) du champ de la pression atmosphérique moyenne entre l'ouest et le sud-est du Pacifique tropical. On caractérise généralement ce phénomène par un indice exprimant la différence de pression entre Papeete (à Tahiti) et Darwin (au nord-ouest de l'Australie); cet indice est négatif en période El Nifio, positif pendant la Nina, car du fait du fort couplage existant entre océan et atmosphère, El Nifio et La Nina constituent les deux états extrêmes de l'oscillation australe. L'ensemble de ces phénomènes atmosphériques et océaniques est souvent appelé l'ENSO, abréviation de l'anglais El Nino - Southern Oscillation (NOAA, 2013).
1.4.3 Analyse statistique de données
Deux séries hydrologiques ont été constituées: la série de magnitude des débits maximums journaliers et celle de la période d'occurrence de ces débits. La première série a été constituée par la valeur la plus élevée des débits journaliers mesurés de décembre à mars chaque année pendant la période 1934-2010 pour chacune de 17 rivières étudiées. Quant à la seconde série, elle était constituée par des dates
d'occurrence de ces débits les plus élevés. Les dates d'occurrence ont été converties en jours juliens.
Pour analyser la stationnarité de la série de magnitude, on a appliqué la méthode de Lombard qui permet de déterminer les ruptures brusques ou progressives des moyennes ou des variances ainsi que les dates de ces ruptures. Quant à la période d'occurrence des débits maximums journaliers, on a d'abord calculé la fréquence relative de ces dates de 12 décades de la saison hivernale. Ensuite, on a comparé au moyen de la méthode de Khi-carré les fréquences des dates d'occurrence avant et après 1970 de la première et de la dernière décade de la saison. Ces deux décades constituaient les classes modales des fréquences des dates d'occurrence. Enfin, les séries de la magnitude et de la période d'occurrence de 17 rivières ont été corrélées simultanément aux cinq indices climatiques au moyen de l'analyse canonique de corrélation. Les différentes méthodes statistiques utilisées sont décrites en détail dans le prochain chapitre.
1.5 Résultats et conclusions
En analysant la variabilité interannuelle des débits journaliers hivernaux de 1934 à
2010, nous en sommes parvenus aux principaux résultats tirés des différentes méthodes statistiques effectuées.
1. La magnitude des débits maximums journaliers hivernaux a significativement augmenté, et ce, après 1970, pour la plupart des rivières. Notre première hypothèse étant que les débits maximums journaliers hivernaux ont significativement diminué après 1970 en raison de la diminution de la quantité de neige, et ce malgré la hausse de la température et de la quantité de pluie, est rejetée, puisque malgré la fonte des neiges et la hausse des températures, les débits ont significativement augmenté.
2. En rive sud, au sud du 47°N (région Sud-Est), les débits maximums journaliers hivernaux surviennent fréquemment à la fm de la saison (dernière décade),
alors qu'en rive nord (région Sud-Ouest) et en rive sud au nord du 47°N (région Est), les débits maximums journaliers hivernaux surviennent fréquemment au début de la saison (première décade). Aucune différence significative de la fréquence d'occurrence des débits maximums n'a été observée avant et après 1970 durant la première décade, ce qui signifie que la fréquence des débits maximums journaliers hivernaux induits par la pluie n'a donc pas significativement augmenté après 1970. Cependant, une différence significative de la fréquence d'occurrence des débits maximums a été observée après 1970 durant la dernière décade, ce qui signifie que la fréquence des débits maximums journaliers hivernaux induits par la fonte des neiges a significativement augmenté après 1970 en raison de la fonte précoce. 3. Il fut démontré que cette fonte précoce des neiges serait la principale cause de
la hausse de la magnitude des débits maximums journaliers hivernaux après 1970.
4. Finalement, comme dernier résultat, La magnitude des débits maxunums journaliers en hiver est positivement corrélée à OPD alors que la période d'occurrence de ces débits l'est à ONA. Mentionnons que le premier indice climatique influence la quantité de neige au Québec (Brown, 2010). En phase positive, l'ONA provoque une fonte tardive de la neige dans la saison en raison de la persistance de l'air polaire froid au Québec (cas de cet hiver 2014).
Pour conclure cette étude, il convient de répondre à la question principale posée en début de projet, soit «à l'instar des niveaux d'eau du fleuve Saint-Laurent, les débits hivernaux de ses affluents ont-ils diminué après 1970? ». La réponse est bien entendu, non, les débits hivernaux des rivières étudiées ont plutôt augmenté après 1970. De nombreux aspects sont cependant à considérer dans cette conclusion qui vient réfuter un résultat très récent d'une étude complémentaire à celle-ci, notamment la localisation de l'ensemble des rivières étudiées, la présence de bassins versants pouvant modifier les débits de certaines rivières, de même que la diversité climatique à l'échelle du bassin versant des grands lacs.
TEMPORAL V ARIABILITY OF THE MAGNITUDE AND TIMING OF WINTER MAXIMUM DAIL Y FLOWS IN SOUTHERN QUEBEC (CANADA)
Ce chapitre est présenté sous la fonne d'article scientifique, en anglais, et a été
soumis dans la revue Water Resources Research (Myriam Beauchamp, Ali A. Assani)
sous le titre :« Temporal variability of the magnitude and timing of winter maximum
Temporal variability of the magnitude and timing of winter maximum daily flows in southern Quebec (Canada)
Myriam Beauchamp·, and Ali A. Assani*
• Département des SCiences de l'environnement and Centre de Recherche sur les Interactions Bassins Versants -Écosystèmes aquatiques (RIVE), Université du Québec
à Trois-Rivières, Trois-Rivières, Canada
Corresponding Author
Corresponding author. Tel.: +1 819-376-5011; Fax: +1 819-376-5179; E-mail: Ali.Assani@uqtr.ca.
Abstract
The temporal variability of winter climate in southem Quebec is characterized by increasing temperature and rainfall, but decreasing snowfall. The goal of the study was to analyze the impacts of these changes on the magnitude and timing of winter
maximum daily flows. Hydrologic series for seventeen tributaries of the St. Lawrence
River were analyzed over the period from 1934 to 2010. The most noteworthy result,
obtained using the Lombard method, was to highlight a nearly generalized shift in mean values of the series in the early 1970's. This shift reflects a significant increase in the magnitude of winter maximum daily flows after that decade, interpreted to result primarily from snowmelt, which is increasingly frequent at the end of winter. Indeed, the frequency of the dates of occurrence of win ter maximum daily flows increased significantly during the last winter decade (ten days) after the 1970's for most rivers in southem Quebec. The copula method did not, however, bring out any significant change in the dependence between the timing and magnitude of winter maximum daily flows over time. Finally, canonical correlation analysis revealed that the magnitude of winter maximum daily flows is positively correlated with the Pacific Decadal Oscillation (PDO), while their dates of occurrence are correlated with the North Atlantic Oscillation (NAO).
Keywords: Maximum daily flows, timing, winter, climate indices, Lombard method, copula method, canonical correlation analysis, Quebec.
Introduction
In reglOns with continental temperate climate such as the Province of Quebec, in Canada, winter, which is particularly cold, is the main low-water period due to storage if precipitation as snow on slopes (e.g. Assani and Tardif, 2005; Assani et al., 2012).
However, because temperatures are increasing, winter precipitation as rain is more frequent and the amount of winter snow is decreasing. According to most climate models, increasing rainfall frequency should lead to increased frequency and intensity (magnitude) ofwinter floods as a result ofhigher runoff on slopes (Boyer et al., 201Oa,
20 lOb). According to Verhaar et al. (2010, 2011), the strongest floods will occur more frequently in winter than in spring. Morphologically, one of the main expected impacts of this increase in winter flows is enhanced bank erosion processes and sediment transport for sorne tributaries of the St. Lawrence River in Quebec (Boyer et al., 201 Oa;
2010b; Verhaar et al., 2010, 2011). From an ecological standpoint, aside from higher water temperature, the increase in winter flows should have a significant impact on the life cycle of certain aquatic organisms. For instance, the survival rate of juvenile Atlantic salmon (Sa/ma salar) in streams is primarily influenced by winter flows, which determine the available habitat volume (Cunjak et al., 1998). Consequently, given the CUITent climate warming trend, analyzing the changes that affect winter flood regimes in continental temperate regions is of the utmost important due to the impacts of these changes on aquatic organisms in fluvial ecosystems.
In Quebec, studies looking at the interannual variability of natural streamflow in winter are restricted to the analysis of monthly or seasonal low or mean flows (e.g. Assani et Tardif, 2005; Assani et al., 20 Il a, 20 Il b; 2012, Zhang et al., 2001), no study having to date looked at winter maximum daily flows. However, in a recent study, Assani et al.
(2014) showed that winter maximum daily water levels in the St. Lawrence River have decreased significantly since the 1980's, which they attributed to the decreasing amount of snow highlighted by Brown (2010) in spite of increasing temperatures observed in Quebec since the 1970's (Yagouti et al., 2008). Results of these studies raise the following fundamental question: do winter maximum daily flows decrease over time in
the St. Lawrence River watershed as do winter water levels in the river itself, in spite of increasing temperature and precipitation as rain?
In addition, there is still sorne debate over which c1imate index primarily influences the spatial and temporal variability of winter temperature and precipitation (snow and rain) in Quebec. Sorne workers are of the opinion that the El Nifio/Southem Oscillation
(ENSO) is the main variability factor (e.g., Shabbar, 2006), while others attribute it to
the North Atlantic/Arctic Oscillation (NAO), (e.g., Kingston et al., 2006; Qian et al.,
2008), the Atlantic Multidecadal Oscillation (AMO) (Assani et a/.', 2014), or the Pacific
Decadal Oscillation (PDO) (Brown, 2010). It is important to establish which of these
c1imate indices affects the spatial and temporal variability of these characteristics (timing and magnitude) ofwinter maximum daily flows in Quebec.
Consequently, the three goals of the study are as follows:
1. To compare the interannual variability of the magnitude of maximum daily flows in the three hydroc1imatic regions of southem Quebec, the underlying hypothesis being to test wh ether decreasing amounts of snow resulted in a decrease in maximum daily flows in winter in southem Quebec akin to the observed decrease in water levels in the St. Lawrence River.
2. To compare the interannual variability of the dates of occurrence of the se winter maximum daily flows in the three hydroc1imatic regions of Quebec to determine whether the increased frequency of precipitation as rain has affected
these dates in southem Quebec.
3. To establish which c1imate indices are significantly correlated with the
Methods
Station location and sources of flow data
Southern Quebec can been divided into three homogeneous hydroclimatic regions
(e.g. Assani et al., 201 Oa, 201 Ob; 20 Il), the first two being located on the south shore
(right bank) of the St. Lawrence River to the north (Eastern region) and south
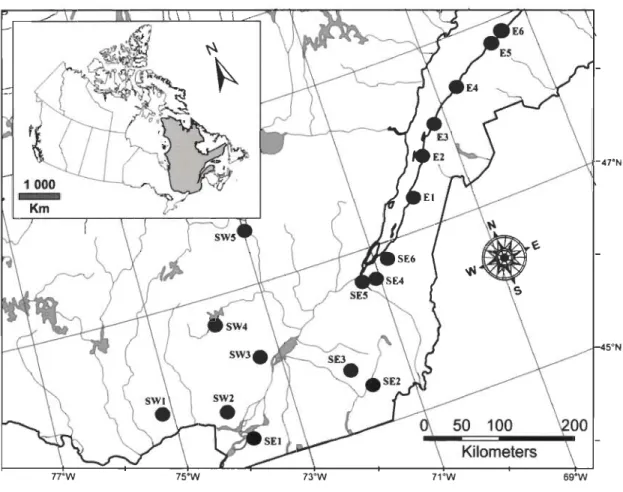
(Southeastern region), respectively, of latitude 47~ (Fig. 1). These two regions are
characterized by a maritime mixed climate. The third region is located on the north shore
(left bank), and its climate is continental. At least five hydrologic stations were selected
in each of these three regions, the choice of these stations resting on (1) the existence of
flow data measured over a relatively long period and (2) the absence of dams or other human activity that might have significantly modified the natural hydrologic regime of
the rivers. Characteristic features of the selected stations are shown in Table 1 and their
location is shown in Figure 1. Winter in Quebec generally extends from December to
March.
Daily flow data were taken from the Environment Canada website
(http://www.wsc.ec.gc.caJapplicationsIH20/index-eng.cfm, viewed in March 2012)
and climate data were taken from the NOAA website
(http://www.cdc.noaa.gov/ClimateIndiceslList, viewed in June 2013). As part of the
study, we selected five climate indices which have been shown to affect the spatial and
temporal variability of hydroclimatic variables in North America in general, and in
Quebec in particular (e.g., Anctil et Coulibaly, 2004; Assani et al., 2010, 2011, 2012;
Mazouz et al., 2012, 2013). These climate indices are the following: AMO (Atlantic
Multi-decadal Oscillation), AO (Arctic Oscillation), NAO (North Atlantic Oscillation),
PDO (pacific Decadal Oscillation), and SOI (Southern Oscillation Index). Climate
indexes for the AMO and PDO were taken from the following website:
http://www.cdc.noaa.gov/ClimateIndiceslList (viewed on 10-06-2013), the NAO from
http://www.cgd.ucar.edu/cas/jhurrell/indices.data.html (viewed on 10-06-2008), the AO
from http://iisao.washington.edu/dataJao/ (viewed on 10-02-2007), and the SOI from
these climate indices (NAO, AO and SOI) after 2006 were taken from the NOAA
website: http://www.esrl.noaa.gov/psd/data/climateindices/list/. Foreachindex.an
annual mean was derived using monthly values from January to December. Data
for aU these indices since 1950 are available on the NOAA website:
http://www.esrl.noaa.gov/psd/data/climateindices/list/. Annual means were calculated over the period from 1918 to 2012.
Statistical analysis Hydroclimatic series
Two streamflow data series were produced for each river: a series of winter maximum
daily flows and a series of dates of occurrence of these flows. The fust series comprises the largest daily flow value measured from December to March for each year from 1934 to 2010. This period aUowed the analysis of the largest number ofrivers over a relatively
long time period (more than 70 years of flow measurements). The second series
comprises the dates of occurrence of maximum daily flows. These dates of occurrence
were first converted to Julian days, with the fust of these set as July 1, and the last, as
June 30, in order to avoid a sharp break in date values from December 31 to January 1.
Then the frequencies per decade (10-day intervals) from December to March of the dates of occurrence of maximum daily flows were calculated for each river over the period
from 1934 to 2010. Thus, the winter season was divided into 12 decades, the fust of
which consisting of the first 10 days of December, and the last, of the last 10 days of
March. This breakdown of the winter season into decades was used because it is the oilly
breakdown that brought out changes in the dates of occurrence of maximum daily flows
over time. Other breakdown approaches and other methods used in the literature (e.g.,
Burn, 2008; Cayan et al., 2001; Cunderlik and Ouarda, 2009; Déry et al., 2009;
Hodgkins et al., 2003; Hodgkins and Dudley, 2006; Magillan and Graber, 1996) did not
For each climate index, four data series were produced: two series of mean values
calculated over three faH months (SON) and three winter months (JFM) , on one hand,
and over four faH months (SOND) and four winter months (DJFM), on the other, with a view to determine which seasonal series of climate indices best correlates with the
hydrologie series.
Analysis of shift in mean values of hydrologie series
In the scientific literature~ analysis of shifts in mean values is usuaHy preceded by a
long-term trend analysis. However, Assani et al. (2014) recently showed that this step is
not important because interpreting the results of a long-term trend analysis is always difficult in hydroclimatology due to the difficulty of determining which factors explain
changes in the long-term trend of a hydroclimatic series. Moreover, from a statistical
standpoint, unlike shifts in means, there is still sorne debate as to which statistical
methods are most appropriate for detecting changes in the long-term trend of
hydroclimatic series (e.g., Onoz and Bayazit, 2012). For this reason, the study only
focuses on shifts in mean values. From a hydrologie al standpoint, interpreting these
shifts in mean and/or variance values is easier than interpreting changes in the long-term trend.
Shifts in mean values were analyzed using the Lombard method (e.g., Assani et al.,
2011, 2012, 2014). This method was chosen because of its demonstrated effectiveness
for detecting shifts and characterizing them to facilitate their hydrological interpretation.
Suppose a series of observations, noted ~, ...
,x:,
whereXi
is the observation taken attime T
=
i. These observations are supposed to be independent. One question of interestis to see whether the mean of this series has changed. If
Ji
i
refers to the theoretical meanwhere { BI (i -
T ) (f)
- f) ) I l = + 1 Z 1 r i B,T
z
-T
I B, if 1 ~ i ~ T, if T, < i ~ T, if T, < i ~ n (1)ln other words, the mean changes gradually from BI to Bz between times TI and Tz . As a special case, one has the usual abrupt-change model when Tz = TI + 1.
ln order to test formally whether the mean in a series is stable or rather follows model (1), one can use the statistical procedure introduced by Lombard (1987). To this end, define ~ as the rank of ~ among X1, ... Xn . Introduce the Wilcoxon score function
rjJ
(u )
= 2u
-
1 and define the rank score of JG byi E
{l,
...
,n}
(2)where
and
(J
2 1 -~=-
lL
n {t/J-
•-
t/J
}2
n ;=1 n + 1
(3)
Lombard' s test statistic is
(4) where
T
z j T_=
IIz.
.LJJ'I.TZj=
T
I+l ;=1 1 (5)At the 95% confidence interval, one concludes that the mean of the series changes
significantly according to a pattern of type (1) whenever
S
n
>
0.0403. This valuecorrespond to the theoretical (critical) values (see Lombard, 1987) defining the significance level at 5% for the test. Note that the equation proposed by Lombard (1987) to detect multiple abrupt changes in the mean of a statistical series was also applied.
This formula confmned results obtained using equation 1. It is important to note that the
assumptions regarding the Lombard method (see Lombard, 1987; Quessy et al., 2011)
are valid for this application. Among these hypotheses, we checked for autocorrelation
between values using the method proposed by Von-Storch and Navarra (1995), among
others.
Analysis of the temporal variability of the dependence between the magnitude and timing of winter maximum daily flows using the copula method
In southern Quebec, winter floods may result from rainfall events and/or snowmelt.
Floods caused by rainfall are frequent in early (December) and mid- (January and February) winter, while those caused by snowmelt occur toward the end of the season
(March). In addition, the intensity of the magnitude of these floods varies as a function
of their timing, being generally greater at the end of the winter season than at the
beginning. Although there is a link between the timing and magnitude of winter daily
floods in Quebec, this link may be changing over time due to a potential increase in
frequency and amount of precipitation as rain resulting from increased winter temperatures. We used the copula method to quantify the temporal evolution of this dependence. This method may be used to analyze the temporal variability of the link
between two variables. The dependence in a random vector (X, Y) is contained in its
corresponding copula function C. Specifically, the celebrated theorem of SkIar (1959)
ensures that there exists a unique C : [0, 1] 2
~
[0, 1] such thatQuessy et al. (2012) developed a testing procedure to identify a change in the copula
(i.e. dependence structure) of a bivariate
series(.x;,ln,···ix
n
,I:).
The idea is based on ~Kendall's tau, which is a nonparametric measure of dependence. Let TJ:T be Kendall's ~
tau measured for the fust T observations and
r;.
+J:n
be Kendall's tau for the remainingn - T observations. The proposed test statistic is
(7)
i.e. a maximum weighted difference between the Kendall's tau. Since
M
n
depends onthe unknown distribution of the observations, the so-called multiplier re-sampling
method is used for the computation of p-values. Specifically, for
n
sufficiently large (n> 50), this method yields independent copies~l
)
, •.~N)
ofM
n
.
Then, a valid p-value for the test is given by the proportion ofA1:z
i)
's larger thanM
n
.
For more details, see Quessy et al. (2012). Usually, one can expect that the series XI, ... , Xn and YI, ... , Yn are subject to changes in the mean and / or variance following, e.g. thesmooth-change model (Lombard, 1987). If such changes are detected, the series must be
stabilized in order to have (approximately) constant means and variances. Finally, a change in the degree of dependence between two series is statistically significant when
M
n
>
V c, where V c is the critical value derived from the multiplier resampling method.As part ofthis study, the copula method was applied to standardized dates of occurrence
and magnitude data for winter maximum daily flows. It should be noted that this method
was applied after removing any statistically significant shift in mean values.
Analysis of the Iink between c/imate indices and characteristics (magnitude and timing) of winter maximum daily flows
Canonical correlation analysis (CCA) was used to analyze the link: between the five climate indices and the two characteristics (magnitude and timing) of winter maximum
daily flows. This statistical method was applied using the approach recently proposed by
Mazouz et al. (2013), because aIl stations can be analyzed simultaneously without
requiring prior regionalization of the hydrological variables.
CCA was described in particular by Afifi and Clark (1996). If one wishes to calculate
the relation between two groups, one of X variables (Xl, X2, ... , Xp) and the other of
Y variables (YI, Y2, ... , Yq), one must calculate the canonical variables V (VI, V2,
... ,Vp) and (Wl, W2, ... , Wq), which are linear combinations of the X variables of the
first group (in this case, the two flow characteristics ) and the Y variables of the second
group (in this case, the c1imatic indices). Then, the canonical variables U and V are
correlated between themselves, that is to say, VI is correlated to Wl, V2 to W2 and so
on, in order to obtain the canonical correlation coefficients. After that, the canonical
variables U and V are correlated to the variables X and Y, so as to obtain what are caIled
structure coefficients. In fact, these coefficients measure the link (the correlation)
between the canonical variables
CU
and V) and the original variables of groups X and Y.Thus, if Xl and X2 are correlated, for example, to VI, YI is correlated to Wl. YI is
therefore correlated to the original variables Xl and X2, since the canonical variables
VI and Wl are correlated. The main purpose of canonical correlation analysis is to
maximize the correlations between the two groups of variables. For our purposes, the
group of independent variables X comprises the five c1imate indices, and the group of dependent variables Y comprises the magnitude and timing of winter maximum daily
flows. AIl these independent and dependent variables were first standardized to remove
any effect of size on the coefficient of correlation values. For magnitude, this
standardization was applied to specific discharge data, thus aIlowing watersheds of
different sizes to be compared. Timing data were converted to Julian days prior to their
standardization. Finally, CCA was applied to a matrix comprising 1292 rows (76 years
of observation x 17 rivers) by 8 columns (river
+
5 c1imate indices+
2 hydrologicvariables). The c1ear statistical advantage of this approach is that CCA can be applied to a matrix comprising a very large number of data (1292) rather than to one comprising
Results
Analysis of shift in mean values ofhydrologic series
Autocorrelation values of order 1 are shown in Figure 2. No autocorrelation coefficient
is statisticaUy significant at the 5% level, which implies that the series are random and
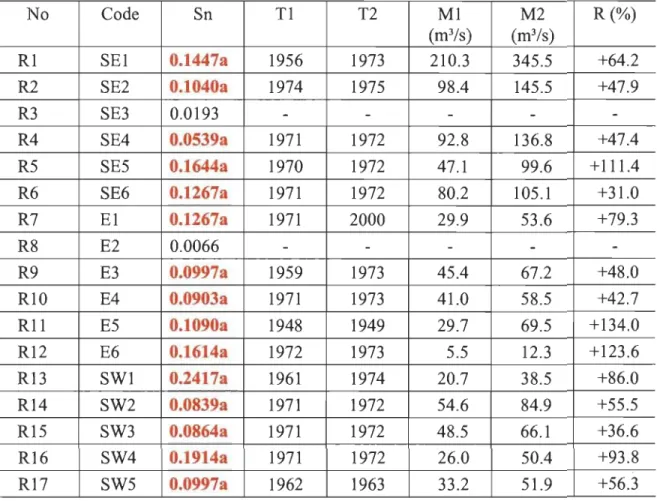
the Lombard method may therefore be used. Results obtained using this method are
shown in Table 2, from which it can be seen that most hydrological series are affected
bya shift in mean values. Only the Nicolet du Sud-Ouest and Du Loup rivers, located on
the south shore, show no shift. For nearly aU rivers, this shift in mean values is abrupt
(aside from the Châteauguay and Trois-Pistoles rivers, which show smoothed shifts). As
for the timing of these shifts, most of them took place during the first half of the 1970' s
decade. Thus, these shifts in mean are synchronous. At the scale of southem Quebec as a
whole, mean values of winter maximum daily flows increased significantly after these
shifts (Fig. 3). This increase in mean values ranged from 31 % (Du Sud river) to 134%
(Matane river), the mean value of winter maximum daily flows for the latter river more
than doubling after the 1970's. The relative increase in mean values (R), however, is not
of function of watershed surface area (Fig. 4), as correlation coefficients calculated
between the two variables are not statisticaUy significant at the 5% level.
Analysis of the timing of winter maximum daily flows
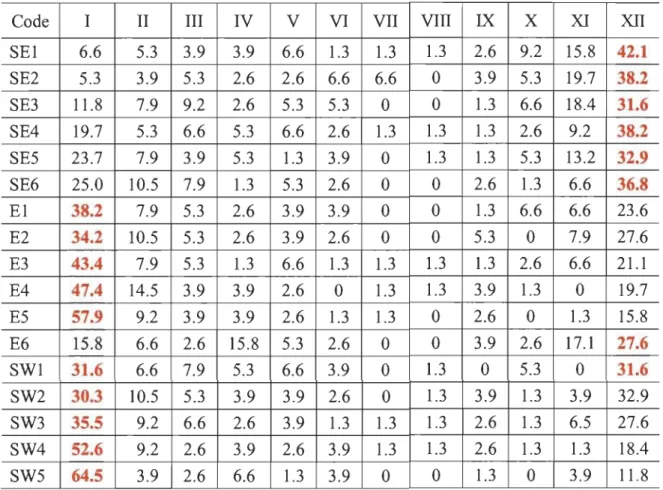
Table 3 shows the relative frequencies of occurrence of maximum daily flows during the
twelve decades of winter in southem Quebec. In general, maximum daily flows can
occur during any winter decade, aside from the frrst two dekads of February for sorne of
the rivers. They do, however, occur more frequently during the frrst decade (Decade 1)
of the season on the north shore and on the south shore north of 4 7°N, and during the
last decade (Decade XII) on thé south shore south of 47°N.
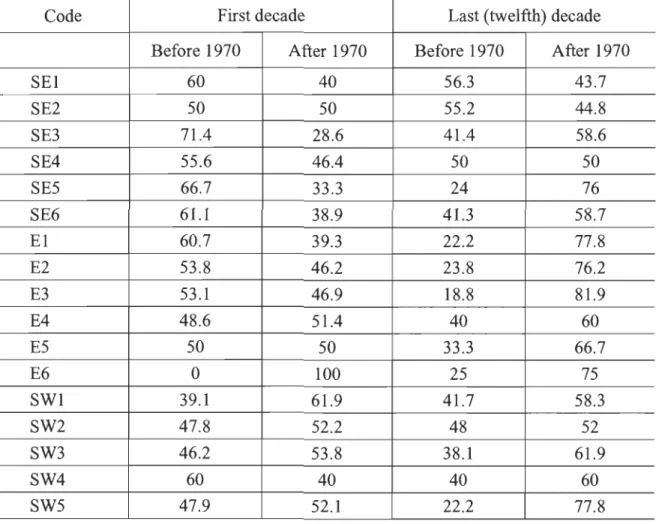
To analyze the temporal variability of the dates of occurrence of winter maximum daily
flows, we compared the frequency of these dates before and after the 1970's decade,
comparison is restricted to the first and last decades, which are the two modal classes of frequency of occurrence. Results of this comparison are shown in Table 4. Application of the Chi-square method did not reveal any statistically significant change in the
frequency of occurrence of maximum daily flows after 1970 for the fIfSt decade. In
contrast, this frequency increased significantly after 1970 for the last decade. This
significant increase in frequency is larger for south shore rivers located north of 47°N and north shore rivers. Since these rivers are characterized by more frequent occurrence of maximum daily flows during the first decade than during the last decade, as mentioned based on data in Table 3, this increase clearly reflects a change in the date of occurrence of maximum daily flows in these two hydroclimatic regions. Thus, after the 1970's, these maximum flows are now much more frequent during the last decade than during the fIfSt.
Analysis of the dependence between the magnitude and date of occurrence of winter maximum daily flows
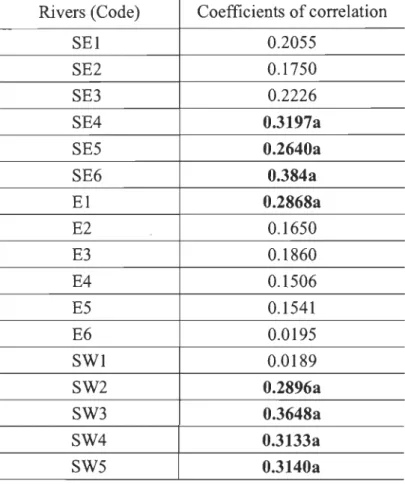
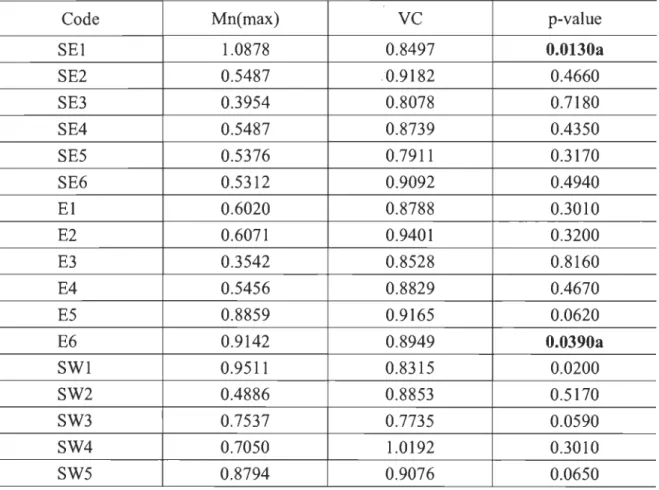
The coefficient of correlation values calculated between the two variables are shown in Table 5. Half of the coefficients of correlation are statistically significant at the 5% levels. Correlation between the two variables is positive, which means that the magnitude of maximum daily flows occurring late in the season is higher than that of flows occurring early in the season. One key point of the analysis was to check whether the changes in mean values of maximum daily flows and in the frequency of the dates of occurrence of these flows affected the evolution of this dependence over time. This evolution was therefore analyzed using the copula method, the results of which are
presented in Table 6. From these, it can be seen that changes are only observed for two
rivers (Châteauguay and Blanche). The case of the Châteauguay river is highlighted in Figure 5. Thus, it appears that for many rivers, the evolution of the dependence of the magnitude and date of occurrence of maximum daily flows did not change significantly
Link between the magnitude and date of occurrence of maximum daily flows
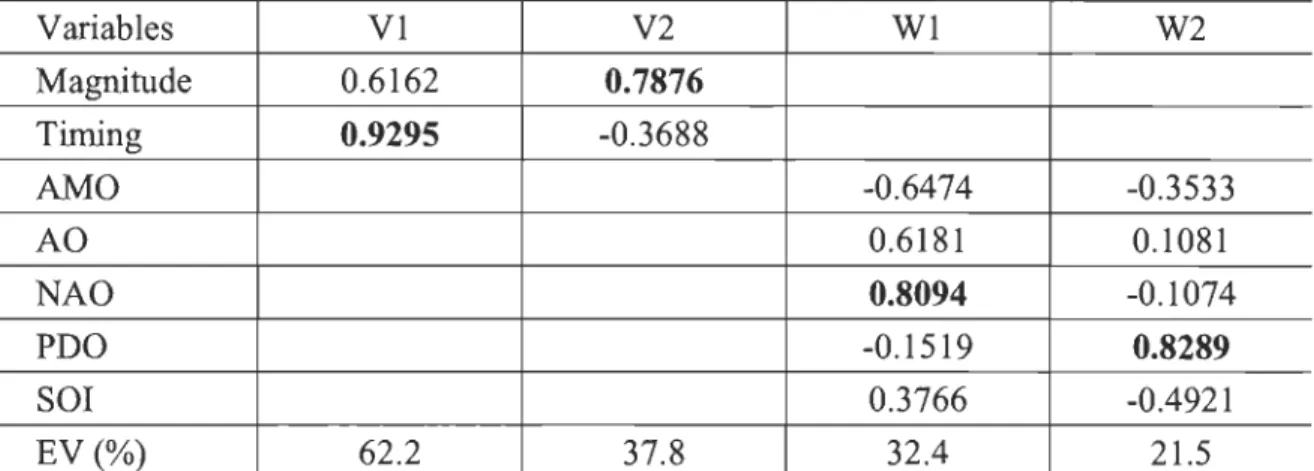
Table 7 shows the coefficients of structure calculated between the two hydrological
variables and the five climate indices. While the two hydrological variables were
correlated with the five faU (SON and SOND) and five winter (JFM and DJFM) climate indices, the best correlation obtained was for winter climate indices calculated over four months (DJFM). As far as hydrological variables are concemed, the date of occurrence is strongly correlated with VI, and the magnitude, with V2. For climate indices, winter NAO is correlated with Wl and winter PDO, with W2. Consequently, NAO is posi#vely correlated with the dates of occurrence of the magnitude of maximum daily flows, this magnitude being in tum positively correlated with PDO.
Discussion and conclusions
Studies looking at the temporal variability of winter temperature and precipitation in Quebec have highlighted a significant increase in temperature and rainfaU, with a
decrease in snowfaU (e.g., Brown, 2010; Yagouti et al., 2008). The temperature increase
was particularly strong for minimum temperatures, while low-intensity rainfaU events increased significantly.
The impacts of these changes in climate variables on winter flood flows in St. Lawrence
River tributaries in southem Quebec have never been studied. However, Assani et al.
(2014) showed in a recent study that winter maximum and minimum daily water levels in the St. Lawrence have decreased significantly after the 1980's. Thus, it is very important to determine if the decrease in snowfaU also caused a decrease in daily flood flows in St. Lawrence River tributaries.
An analysis of the stationarity, using the Lombard method, of maximum daily flows in 17 tributaries of the St. Lawrence River in southem Quebec over the period from 1934 to 2010 revealed a significant increase in flow magnitude for nearly aU tributaries analyzed, this increase having generaUy occurred during the first half of the 1970's
decade. This increase cannot be caused by a decrease in amount of snow, which should result in a decrease in flow magnitude. Moreover, this decrease in the amount of snow occurred during the 1980's (Brown, 2010) and therefore after the change in flood magnitude.
Analysis of the temporal variability of the dates of occurrence of winter maximum daily flows highlighted a significant increase in the frequency of occurrence of these dates after 1970. As previously mentioned, due to Quebec's continental temperate c1imate, winter floods associated with maximum daily flows can be the result of rainfall and/or snowmelt. Floods resulting from rainfall mainly occur in early and mid-winter, while those caused by snowmelt primarily occur toward the end of winter. A comparison of the frequencies of the dates of occurrence of maximum daily flows by decade shows that, for the frrst decade of winter, these frequencies did not increase significantly after 1970, implying that the frequency of win ter floods resulting from rainfall did not
increase significantly after that year. In contrast, for the last decade of winter, winter
flood frequencies did increase significantly after 1970, which suggests that the
frequency of maximum daily flows resulting from snowmelt increased significantly after 1970 as a result of early snowmelt, rather than an increase in the amount of snow. Prior to the 1970's, this snowmelt often occurred in April, or early spring. But after the 1970's, snowmelt occurs relatively early, toward the end of March (winter). This earlier melting phenomenon has been observed in many regions of North America (e.g., Burn,
2008; Cayan et al., 2001; Cunderlik and Ouarda, 2009; Déry et al., 2009; Hodgkins et
al., 2003; Hodgkins and Dudley, 2006) and is also observed in Quebec in the dates of
occurrence of the magnitude of spring freshets (Mazouz et al., 2012). As a consequence,
the increase in magnitude ofwinter maximum daily flows after the 1970's is simply the result of early snowmelt that is now frequently observed near the end of winter in southem Quebec, which explains why the magnitude of winter maximum daily flows
has increased significantly over time in spite of decreasing amounts of snow.
Analysis of the correlation between c1imate indices and the magnitude of maximum daily flows using CCA showed that this hydrologic variable is positively correlated with
PDO. Brown (2010) has already shown that, in southem Quebec, this is the climate index that best correlates with the amount of the snow. However, the climate mechanisms through which PDO affects the snowfall in Quebec remain poorly constrained. As far as the dates of occurrence of maximum daily flows are concemed,
they are positively significantly èorrelated with NAO. Kingston et a!. (2006) proposed a conceptual framework to explain the effect of this index on the spatial and temporal -variability of temperature, precipitation and streamflow in the northeastem United States and eastem Canada, among other places. When this index is in a positive phase, the persistence of polar air over Quebec, in particular, tends to result in delayed snowmelt,
and thus winter floods tend to occur later in the season (toward the end ofwinter).
This study highlights the fact that, unlike spring flood flows, the magnitude of winter flood flows increased significantly over time after the 1970's as a result of early snowmelt increasingly occurring at the end of March. Thus, the decrease in amount of snow observed since the 1980's in southem Quebec has no impact on the temporal variability of the magnitude of winter floods.
References
Afifi, A. A. , and V. Clark (1996), Computer-aided multivariate analysis. 3rd edition. Chapman and Hall. New York. 505 p.
Anctil, F., and P. Coulibaly (2004), Wavelet analysis of the interannual variability in Southem Québec Streamflow. J climate, 17, 163-73.
Assani, A.A., S. Charron, M. Matteau, M. Mesfioui, and J-F Quessy (2010), Temporal variability modes of floods for catchements in the St. Lawrence Watershed (Quebec, Canada). J Hydro!., 385, 292-299.
Assani, A.A., A. Chalifour, G. Légaré, C-S Manouane, and D. Leroux (2011 a),
Temporal regionalization of 7-day low flow in the St. Lawrence watershed in Québec (Canada). Water Res Manage, 25, 3661-3675.
Assani, A.A, R Landry, l Daigle, and A Chalifour (2011b), Reservoirs effects on the
interannual variability of winter and spring streamflow in the St-Maurice River
watershed (Quebec, Canada). Water Res. Manage, 25, 3661-3675.
Assani, AA., R. Landry, M. Labrèche, J-J. Frenette, and D. Gratton (2014), Temporal
variability of monthly daily extreme water levels in the St.Lawrence River at the
Sorel station from 1912 to 2010. Water, 6, 196-212.
Assani, AA, R Landry, and M. Laurencelle (2012), Comparison on interannual
variability modes and tends of seasonal precipitation and streamflow in Southern
Quebec (Canada). River Res. Applic., 28, 1740-1752.
Assani, AA, and S. Tardif (2005), Classification, caractérisation et facteurs de
variabilité spatiale des régimes hydrologiques naturels au Québec (Canada).
Approche éco-géographique. Rev. Sei. Eau, 18,247-266.
Boyer, C., D. Chaumont, 1. Chartier, and AG. Roy (2010a), Impact of climate change
on the hydrology ofSt.Lawrence tributairies. J Hydro/., 384, 65-83.
Boyer,
c.
,
P.M. Verhaar, AG. Roy, P.M. Biron, and l Morin (20 lOb), Impacts ofenvironmental changes on the hydrology and sedimentary processes at the
confluence of St. Lawrence tributaries: potential effects on fluvial ecosystems.
Hydrobiol, 647, 1, 163-183.
Brown, RD (2010), Analysis of snow cover variability and change f i Québec,
1948-2005. Hydro/. Process., 24, 1929-1954.
Bum, D.H. (2008), Climatic influences on streamflow timing in the headwaters of the
Mackenzie River Basin. J Hydro/., 352, 225-238.
Cayan, D.R, S.A. Kammeriener, M.D. Dettinger, J.M. Caprio, and D.H. Peterson
(2001), Changes in the onset of spring in the western United States. Bull. Amer.
Meteor. Soc., 82, 399-415.
Cunjak, RA, T.D. Prowse, and D.L. Parrish (1998), Atlantic salmon (Salmo salar) in
winter: "The season ofparr discontent". Cano J Fish. Aquat. Sci., 55, 161-180.
Cunderlik, lM., and T. B.M.J. Ouarda (2009), Trend in the timing and magnitude of
floods in Canada. J Hydrol., 375,471-480.
Déry, S.J., K. Stahl, RD. Moore, P.H. Whitfield, B. Menounos, and J.E. Burford (2009),
Detection of runoff timing changes in pluvial, nival and glacial rivers of western
