Uncertainty in forecasts of complex rule-based
systems of travel demand: Comparative
analysis of the Albatross/Feathers model
system
Soora Rasouli1, Mario Cools2,3,4, Bruno Kochan4, Theo Arentze1, Tom Bellemans4,
Davy Janssens4 and Harry Timmermans1
1
Urban Planning Group, Eindhoven University of Technology, Eindhoven, the Netherlands
2
Centre for Information, Modelling and Simulation (CIMS), Hogeschool-Universiteit Brussel, Brussels, Belgium
3
Research Foundation Flanders (FWO), Brussels, Belgium
4
Travel Behaviour Research: Current Foundations,
Future Prospects
13th International Conference on Travel Behaviour Research Toronto 15-20, July 2012
Uncertainty in forecasts of complex rule-based systems of travel
demand: Comparative analysis of the Albatross/Feathers model
system
Soora Rasouli
Address Urban Planning Group, Eindhoven University of Technology Phone: + 31 40 2473315
E-mail: [email protected]
Abstract
This paper documents the results of a comparative analysis of model uncertainty of the Albatross/Feathers model system for respectively the Rotterdam region, The Netherlands and Antwerp region, Belgium. The assessment concerned the calculation of the coefficient of variation for the daily distance travelled per person. The calculations are performed both at the aggregated level and the disaggregated level (e.g. disaggregation by certain socio-demographics). Results indicate that model uncertainty differs by socio-demographic groups. Results of a regression analysis also indicate that in both regions uncertainty in daily distance travelled per person is strongly correlated with the inverse square root of the relevant socio-demographic population and the complexity of the classification, measured in terms of the number of possible classes.
Keywords
forecast uncertainty, activity-based models, travel demand, Albatross, Feathers
Preferred Citation
Rasouli, S. et al. (2012), Uncertainty in forecasts of complex rule-based systems of travel demand: Comparative analysis of the Albatross/Feathers model system. Proceedings IATBR
Conference, Toronto, Canada.
1. Introduction
In the context of research programs such as the Travel Model Improvement Program (TMIP) and Amadeus, advancing the state-of-the-art in travel demand models has become a key priority. As a result, many metropolitan planning organizations and transportation authorities are in the progress of a transition towards activity-based modelling or have successfully completed this shift. Consequently, three inherent features are present in most contemporary travel demand models (see e.g. Davidson et al. (2007)): (1) a general framework of activity generation, (2) a tour-based structure of travel, and (3) micro-simulation modelling techniques.
Although the calibration and validation of these models in terms of goodness-of-fit and the interpretation of the sign and significance of estimated parameters have been extensively discussed, in reporting the results of travel demand models the degree of uncertainty in the forecasts is seldom addressed. As reported by Cools et al. (2011), it is imminent for decision-makers to know the possible range and variability of future transport predictions and their corresponding probabilities for instance to assess the financial viability of infrastructure projects. Furthermore, the role of uncertainty analysis is expected to become more important in the near future as discussed by Rasouli et al. (2011).
In essence, uncertainty in travel demand forecasts can be attributed to two basic sources: input uncertainty and model uncertainty. Input uncertainty relates to the fact that (future) values of the exogenous variables are unknown due to measurement error or scenario uncertainty. In contrast, model uncertainty results from specification errors (omitted variables, inappropriate assumptions on functional form and statistical distributions for random components), and errors due to the use of parameter estimates instead of the true values (the model is estimated on a sample of the population only).
Of particular interest in activity-based travel demand modelling is model uncertainty that is due to one of its key features, namely micro-simulation. After all, due to micro-simulation, travel demand forecasts change each time the seeds to the random number generator used in the simulation change. The starting point for this paper is previous research (Veldhuisen, Timmermans and Kapoen, 2000l Castiglione et al. (2003), and Ziems et al. (2011) that suggested examining the stochastic variability of alternative micro-simulation model systems. In this direction, it is worthwhile to refer to the recent research agenda proposed by Rasouli and Timmermans (2012) and Horni et al. (2012) to more extensively study the effect of micro-simulation on uncertainty in travel demand forecasting models.
Therefore, the main objective of this paper is to investigate the impact of micro-simulation on the coefficient of variation in daily travel distance per person for two computational process models that share a high similarity, namely the activity-based modeling frameworks Albatross (Arentze and Timmermans, 2004) and its Flemish equivalent Feathers (Bellemans et al., 2010).
2. Set up
2.1. Study Areas
The analysis of uncertainty in the selected performance indicator daily distance travelled per person was conducted for the larger Rotterdam area in the Netherlands and the Antwerp region, Belgium. Both cities are major international harbours. For many years, Rotterdam took the number 1 position in the world, only recently being surpassed by Seattle, Singapore and Shanghai. Reflecting this role of the cities, there is a concentration of labour around the harbour. Moreover, there are major feeder roads to the areas of trade and employment. Rotterdam is the second largest city in the Netherlands with a population of approximately 600,000 people in 2005. It is the centre city of a larger metropolitan area of virtually continuously built-up space for several million of people. In addition to the harbour, major office development can be observed around the central train station. Shopping facilities are organized according to a hierarchical structure which most stores being located in the city centres, some major regional developments scattered around the metropolitan area and neighbourhoods shopping development in every neighbourhood. The road structure can be characterised as consisting of major through-ways to the south, and east, completed by a major ring road.
In correspondence to Rotterdam, Antwerp is the second largest city in Belgium with a population of about 460,000 people in 2005, and a population density of about 2,300 inhabitants per km². Antwerp's docklands provide the basis to a massive concentration of petrochemical industries, accumulating to the second largest petrochemical cluster in the world after Houston, Texas. With respect to road infrastructure, an eight lane motorway bypass encircles much of the city centre and runs through the urban residential area of Antwerp and belongs to the busiest motorways in Europe.
2.2. Data
The first step in the uncertainty analysis consisted of creating a synthetic population for the study area. The approach applied for the Rotterdam area is described in detail in Arentze and Timmermans (2008). It is based on the principle of iteratively proportional fitting, which ensures that the aggregated characteristics of the synthetic population are consistent with reported marginal distributions in official statistics for the city. It however also ensures that consistency between individuals and households is maintained by using relation matrices. Thus, the created synthetic population consists of both individuals and households, which are created simultaneously and which are consistent with observed relationships between individual and household characteristics. Only the individual data were used in the analysis. The approach used in Antwerp is also based on the principle of iterative proportional fitting, but is slightly less complicated with respect to the consistency between household level characteristics and individual-level characteristics.
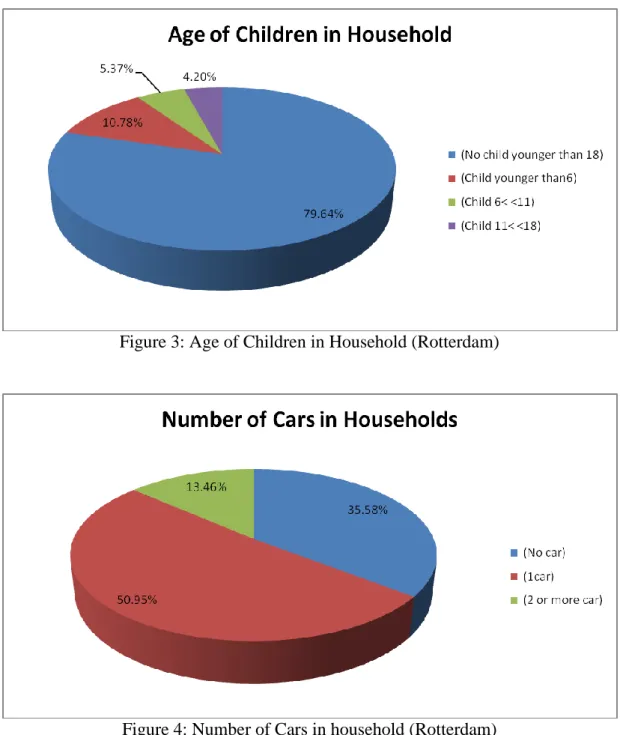
A 10% fraction of the synthetic population was used in both cities. This amounts to 41,668 persons and 27,961 households for Rotterdam and 32,055 individuals for Antwerp. Figures 1-4 portray some key characteristics of the fraction of the Rotterdam synthetic population in
terms of age, household composition, income, age of children in the household and car ownership. Household composition was based on a combination of the number of adults in the household and their work status. Figure 1 shows that single person non-worker household are mostly presented in the sample fraction (28%), followed by single person, worker household (22%). Two adults, one worker households make up the smallest segment in Rotterdam. Figure 2 provides information about income levels and shows the profile one might expect for many lower status kind of job typical for an international port. As illustrated in Figure 3, the city of Rotterdam has a remarkably high percentage of household with no children less than 18 years of age. The number of people without a car is also high (36%) as indicated in Figure 4.
Figure 1: Household Composition (Rotterdam)
Figure 3: Age of Children in Household (Rotterdam)
Figure 4: Number of Cars in household (Rotterdam)
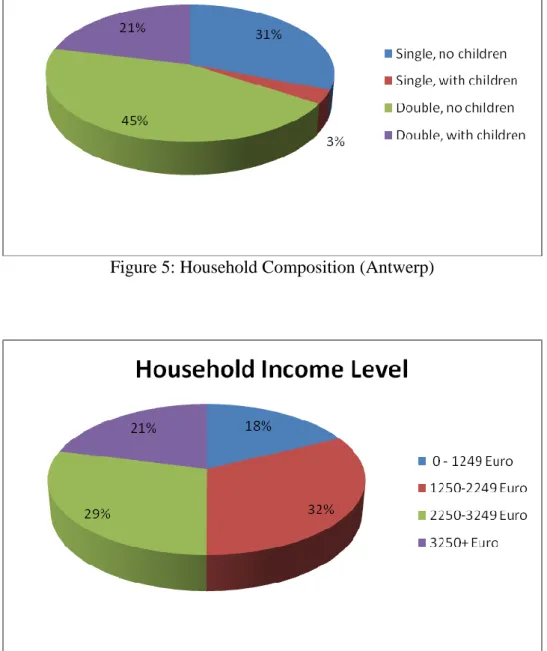
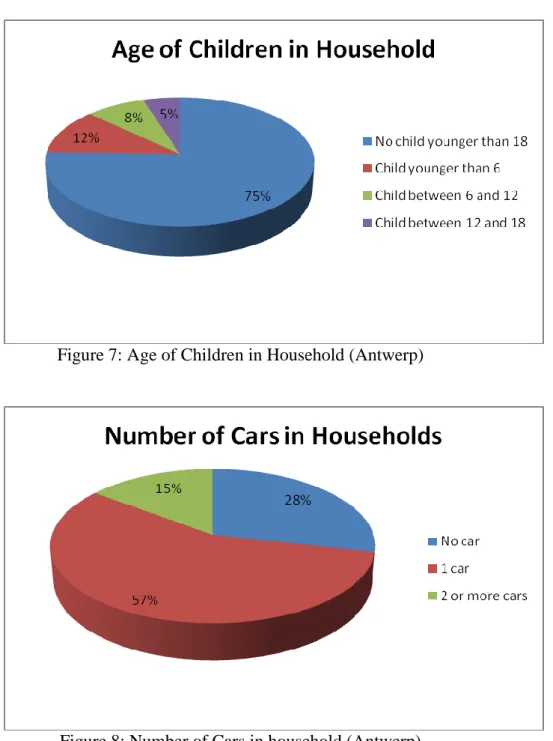
Similar summary statistics for Antwerp are provided in Figures 5-8. In contrast to the Rotterdam synthetic population, household composition was defined in a different way due to the fact that the data to estimate the decision trees originated from a person-based national travel survey in the Flemish case, whereas the decision trees for Rotterdam were calibrated using household data. For the Antwerp synthetic population, household composition was based on a combination of the number of adults in the household and their offspring. Figure 5 shows that two-adult households without children have the largest share in the sample fraction (45%). Single-adult households with children make up the smallest segment in Antwerp. Figure 6 provides information about household income levels and shows that the most extreme income groups have a lower share then the middle income classes. In correspondence to Figure 3, Figure 7 highlights that like the city of Rotterdam, Antwerp has a remarkably high percentage
of households with no children less than 18 years of age. Finally, Figure 8 illustrates that about three fourth of the synthetic population has at least one car available in the household.
Figure 5: Household Composition (Antwerp)
Figure 7: Age of Children in Household (Antwerp)
Figure 8: Number of Cars in household (Antwerp)
2.3. Approach
The aim of the uncertainty analysis was to examine the impact of model uncertainty of the Albatross model system and its Flemish equivalent, developed in the context of the Feathers program. The 10% fraction of the synthetic population described above served as the basis for the study. The quintessence of uncertainty analysis is to run a model multiple times and calculate some measure of variation in the predicted outcomes, which serves as a measure of uncertainty. In the present study, the coefficient of variation was used to quantify uncertainty. To avoid that the results of the uncertainty are influenced by uncertainty in the sampled fraction, it was kept constant throughout the analysis. For each sampled individual of the
fraction of the synthesized population, the Albatross model was run 200 times. Each run implies identifying the action state outcome of a series of 27 decision trees which make up the Albatross/Feathers model system, using Monte Carlo draws. These runs result in a probability distribution of each facet of the simulated activity-travel patterns and the associated performance indicators. Each runs will result in a different activity-travel patterns and associated performance indicators, allowing one to assess the impact of model uncertainty on the variation in the performance indicators. Coefficients of variation were calculated for performance indicators daily distance travelled per person.
In addition to this aggregate analysis, differences in uncertain as measured in terms of the coefficient of variation, between socio-demographics groups were further analysed using regression analysis. The results of this analysis indicate whether model uncertainty of any of these groups differs significantly from the base group. This model includes both main effects and first order interactions effects. In particular, the main effects are relevant for interpretation as they indicate any significant differences in model uncertainty between the categories of the selected socio-demographic variables.
Because at the same time, this results of model uncertainty will be influenced by the size of the relevant sample size (the various segments by socio-demographics variables) and by the opportunity of misclassification as depicted by the number categories for single variables and cells (for interactions), a second analysis regressed the inverse square root of population size and the complexity of the classification on the coefficient of variation for the various socio-demographic segments. Because it is well known that the standard error and therefore the coefficient of variation under a set of robust conditions is directly related to population size and therefore one might argue that the results if such an analysis are trivial, it should be remembered that Albatross and Feathers are not examples of simple statistical models and therefore this well-known statistical relationship is not immediately clear. The fact that the model systems rely on a set of highly interdependent decision tables and the fact that actual scheduling is heavily influenced by a set of constraints may obscure this statistical relationship.
3. Results
3.1. Uncertainty and Socio-demographics
3.1.1. Rotterdam
To examine the relationship between the degree of uncertainty and the selected set of socio-demographic variables, a regression analysis was conducted. The socio-demographic variables (household composition, income, age of children and the number of cars) were dummy coded, which means that one category was coded all zero. It implies that the estimated constant of the regression equation represents the value of the performance indicator of the base group, which in this case is the segment of two adult – no worker households, with an annual income higher than 38750 euros, two or more cars and with children in the age cohort of 12-17. The choice of dummy coding also means that any significant effect indicates a significant difference between the estimated uncertainty for
this baseline segment and the uncertainty of the socio-demographic category that the coefficient represents.
The results are shown in Table 1. Note that both main effects and first order interaction effects were estimated. The estimated main effects indicate that only single workers differ significantly from the baseline segment in terms of uncertainty in simulated daily distance traveled: the uncertainty of this category is much higher. As for the income categories, only the uncertainty in the predicted daily distance traveled of the 16250 – 23750 euros per year category is significantly different from the base. The main effects for the other two socio-demographic variables age of children and car ownerships are not significant, suggesting that uncertainties for these categories do not significantly differ from uncertainty for the baseline segment.
Table 1 also shows that most estimated interaction effects are not significant indicating uncertainty in predicted daily travel distance for specific category combinations of two socio-demographic variables is not significantly different from the uncertainty in predicted daily travel distance for the baseline category. However, there are some remarkable exceptions. Significant interaction effects can be observed for c0ch1 ((Single, No worker x children younger than 6), c0ca1 (Single, No worker x 1 car in household), c1ch0 (Single, Worker x No children younger than 18), c1ch1 (Single, Worker x Children younger than 6) c1ca0 (Single, Worker x No cars), c1ca1 (Single, Worker x 1 car in household), c3sec1(two adults, two worker x Income between 16250 and 23750 euros), sec0ch1 (income <16250 x children younger than 6), sec0ch2 (income < 16250 euro x children between 6 and 11 ), sec0ca1 (income <16250 x 1 car in household), and). Most signs of these estimated interaction effects are negative indicating that for the corresponding specific combination of categories uncertainty in predicted daily distance travelled is significantly less than the sum of their main effects would indicate. Positive estimated interaction effects were found for c0ch1 ((Single, No worker x children younger than 6), c1ch1 (Single, Worker x Children younger than 6) c3sec1(two adults, two worker x Income between 16250 and 23750 euros), sec0ca1 (income <16250 x 1 car in household), and ch2ca0 (children between 6 and 11 x no car), which suggest that uncertainty in simulated daily distance travelled for these combined categories of socio-demographic variables is higher than the sum of their main effects would suggest. The correlation coefficient for this model is equal to .94, which indicates that as expected variation in coefficient of variation are strongly related to differences between socio-demographic segments.
Table 1: Estimated effects of socio-demographics on coefficient of variation for daily distance traveled (Rotterdam)
Parameter Estimate Std. Error t Value
(Constant) .186 .058 .002
comp0 (Single. No worker) .241 .123 .054 comp1 (Single. Worker) .454 .062 .000 comp2 (Two adults. one worker) .066 .064 .305 comp3 (two adults. two worker) -.024 .052 .648 sec0 (income=min<16250) .011 .070 .875
sec1 (Income16250<low<23750) .095 .047 .050 sec2 Income= Medium 23750<Med<38750 .090 .059 .133 child0 No children younger than 18 -.069 .057 .233 child1 Household has children younger than 6 -.064 .065 .325
child2 Household has children 6< <11 -.053 .088 .551 car0 0 car in household .009 .072 .898 car1 1 Car in household .036 .054 .505
c0sec0 -.049 .071 .490 c0sec1 -.053 .072 .457 c0sec2 -.103 .068 .132 c0ch0 .017 .107 .871 c0ch1 .338 .113 .004 c0ch2 .206 .134 .128 c0ca0 -.130 .073 .078 c0ca1 -.190 .066 .005 c1sec0 .002 .053 .968 c1sec1 -.018 .042 .667 c1sec2 -.015 .052 .781 c1ch0 -.238 .053 .000 c1ch1 .167 .057 .005 c1ch2 .010 .076 .893 c1ca0 -.321 .061 .000 c1ca1 -.383 .052 .000 c2sec0 .083 .057 .154 c2sec1 -.010 .039 .794 c2sec2 -.059 .051 .257 c2ch0 -.107 .056 .059 c2ch1 .010 .059 .866 c2ch2 -.076 .077 .329 c2ca0 .012 .060 .840 c2ca1 -.103 .049 .040 c3sec1 .242 .062 .000 c3sec2 -.054 .046 .241 c3ch0 -.041 .054 .446 c3ch1 -.017 .056 .757 c3ch2 -.006 .076 .940 c3ca0 .018 .057 .755 c3ca1 -.083 .046 .076 sec0ch0 -.126 .062 .046 sec0ch1 -.255 .067 .000 sec0ch2 -.226 .075 .004 sec0ca0 .033 .056 .561
sec0ca1 .162 .054 .003 sec1ch0 -.035 .044 .439 sec1ch1 -.056 .047 .238 sec1ch2 -.077 .054 .157 sec1ca0 -.077 .046 .098 sec1ca1 -.011 .038 .781 sec2ch0 .012 .046 .799 sec2ch1 .026 .050 .610 sec2ch2 .081 .058 .166 sec2ca0 .000 .045 .999 sec2ca1 -.047 .039 .236 ch0ca0 .061 .051 .241 ch0ca1 .038 .042 .378 ch1ca0 .079 .059 .182 ch1ca1 .013 .048 .784 ch2ca0 .187 .075 .015 ch2ca1 .058 .052 .272 3.1.2. Antwerp
A similar regression analysis was conducted for Antwerp. Unfortunately, the variable household composition was measured slightly different in this study. As in Rotterdam four categories were distinguished, but in this case these four categories consisted of the combination whether or not there were children in the household and whether the household consists or one or two adults. This difference means that the results of the Antwerp regression for socio-demographic difference cannot be directly compared to the results for Rotterdam. Also note that household composition in this study area will be more correlated with age o children as there is overlap in the underlying information, which is absent in the Rotterdam case.
While the correlation coefficient for the Rotterdam area was equal to 0.94 for Antwerp it is equal to 0.93. Thus, although the variables slightly differ, overall explanatory value of the two regression model is approximately the same. The estimated main effects indicate that only single with children households differ significantly from the baseline segment in terms of uncertainty in simulated daily distance traveled: the uncertainty of this category is much higher. As for the income categories, only the uncertainty in the predicted daily distance traveled of the less than 1250 euros per year category is significantly different from the base: the uncertainty for this segment is much higher compared to the base. The main effects for the other two socio-demographic variables age of children and car ownerships are not significant, suggesting that uncertainties for these categories do not significantly differ from uncertainty for the baseline segment. A similar result was obtained for Rotterdam.
Similar to the results for Rotterdam, Table 2 shows that most estimated first order interaction effects are not significant indicating that uncertainty in predicted daily travel distance for specific category combinations of socio-demographic variables is not significantly different
from the uncertainty in predicted daily travel distance for the baseline category. Except for one interactions, the coefficients of all other significant interaction effects are negative, indicating that the uncertainty for combinations of socio-demographic variables are low than the sum of their main effects. This results was found for (Single. With children. x Income between 0-1249Euro). (Single. With children x Income between 1250-2249 Euro). (Single. With children and 1 car)and no respectively 1 car and the lowest income level. The only positive interaction effect was found for 1 car and children between 6 and 12 years of age.
Table 2: Estimated effects of socio-demographics on coefficient of variation for daily distance traveled (Antwerp)
Parameter Estimate Standard Error t Value Pr > |t|
Intercept 0.246 0.166 1.48 0.1462
HHCOMP Single. no children -0.138 0.212 -0.65 0.5204 HHCOMP Single. with children 1.823 0.306 5.96 <.0001 HHCOMP Double. no children -0.277 0.213 -1.30 0.2011 SEC 0 - 1249 Euro 0.892 0.204 4.38 <.0001 SEC 1250-2249 Euro 0.269 0.204 1.32 0.1942 SEC 2250-3249 Euro -0.075 0.205 -0.37 0.7153 CHILD Younger then 6 -0.195 0.203 -0.96 0.3416 CHILD Between 6 and 12 -0.263 0.202 -1.30 0.2006 NRCAR 0 -0.107 0.187 -0.57 0.5708 NRCAR 1 -0.263 0.187 -1.41 0.1661 HHCOMP*SEC Single. no children 0 - 1249
Euro
-0.605 0.231 -2.62 0.0122
HHCOMP*SEC Single. no children 1250-2249 Euro
-0.259 0.231 -1.12 0.2683
HHCOMP*SEC Single. with children 0 - 1249 Euro
-1.455 0.314 -4.63 <.0001
HHCOMP*SEC Single. with children 1250-2249 Euro
-1.217 0.314 -3.87 0.0004
HHCOMP*SEC Single. with children 2250-3249 Euro
-0.587 0.314 -1.87 0.0687
HHCOMP*SEC Double. no children 0 - 1249 Euro
-0.333 0.245 -1.36 0.1817
HHCOMP*SEC Double. no children 1250-2249 Euro
-0.112 0.245 -0.46 0.6512
HHCOMP*SEC Double. no children 2250-3249 Euro
0.029 0.245 0.12 0.9074
HHCOMP*CHILD Single. with children Younger then 6
-0.402 0.149 -2.69 0.0102
HHCOMP*CHILD Single. with children Between 6 and 12
-0.305 0.146 -2.10 0.0422
HHCOMP*NRCAR Single. no children 0 0.247 0.226 1.09 0.2804 HHCOMP*NRCAR Single. no children 1 0.354 0.225 1.57 0.1239 HHCOMP*NRCAR Single. with children 0 -0.217 0.147 -1.47 0.1479 HHCOMP*NRCAR Single. with children 1 -0.397 0.143 -2.77 0.0083
Parameter Estimate Standard Error t Value Pr > |t|
HHCOMP*NRCAR Double. no children 0 0.2492 0.203 1.23 0.2269 HHCOMP*NRCAR Double. no children 1 0.357 0.202 1.77 0.0846 SEC*CHILD 0 - 1249 Euro Younger then 6 0.0214 0.231 0.09 0.9265 SEC*CHILD 0 - 1249 Euro Between 6 and 12 -0.019 0.230 -0.08 0.9353 SEC*CHILD 1250-2249 Euro Younger then 6 -0.015 0.231 -0.06 0.9487 SEC*CHILD 1250-2249 Euro Between 6 and
12
-0.035 0.230 -0.15 0.8805
SEC*CHILD 2250-3249 Euro Younger then 6 0.078 0.232 0.33 0.7394 SEC*CHILD 2250-3249 Euro Between 6 and
12 0.046 0.230 0.20 0.8422 SEC*NRCAR 0 - 1249 Euro 0 -0.640 0.200 -3.21 0.0026 SEC*NRCAR 0 - 1249 Euro 1 -0.493 0.199 -2.47 0.0176 SEC*NRCAR 1250-2249 Euro 0 -0.245 0.200 -1.22 0.2276 SEC*NRCAR 1250-2249 Euro 1 -0.165 0.199 -0.83 0.4139 SEC*NRCAR 2250-3249 Euro 0 0.134 0.201 0.67 0.5089 SEC*NRCAR 2250-3249 Euro 1 -0.013 0.199 -0.07 0.9470 CHILD*NRCAR Younger then 6 0 0.170 0.170 1.00 0.3247 CHILD*NRCAR Younger then 6 1 0.304 0.165 1.84 0.0726 CHILD*NRCAR Between 6 and 12 0 0.327 0.165 1.98 0.0545 CHILD*NRCAR Between 6 and 12 1 0.3649 0.165 2.21 0.0331
3.2. Uncertainty, segment size and complexity
As discussed. the above analysis depicts differences in uncertainty as measured by the coefficient of variation between the selected socio-demographic groups. Uncertainty is however also influenced by segment size and complexity, measured in terms of the number of cells in the classification. To examine this relationship, a second series of regression analyses was conducted. The dependent variable in this regression was the coefficient of variation for each socio-demographic segment, defined by the combination of all selected socio-demographic variables, and the measure of complexity.
3.2.1. Rotterdam
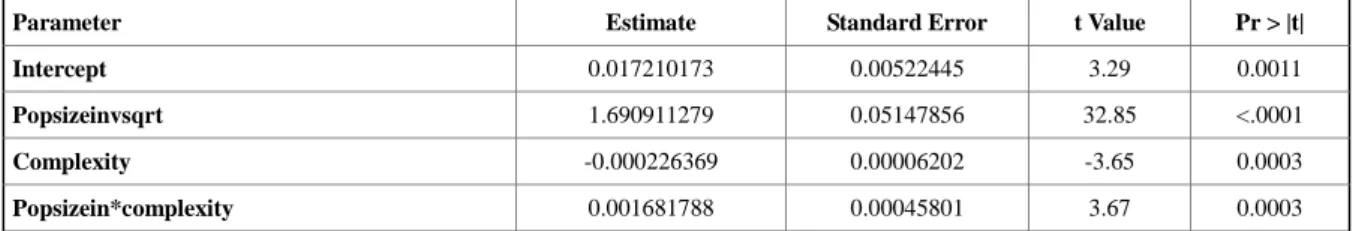
The results of this regression analysis are shown in Table 3 for the Rotterdam area. The coefficient of correlation for this analysis is equal to 0.97, suggesting that the coefficient of variations is strongly influenced by population size and complexity. Table 3 shows that uncertainty increase with the inverse square root of population size. It decreases with increasing complexity. It is difficult to argue from the start whether a positive or negative sign should be expected. On the one hand, the probability of misclassification, ceteris paribus, increases with more categories or cells. On the other hand, a larger number of cells or categories also increases, ceteris paribus, the homogeneity of travel behavior. All estimated coefficients are significant.
Table 3: Estimated effects of population size and complexity on coefficient of variation for daily distance traveled (Rotterdam)
Parameter Estimate Standard Error t Value Pr > |t|
Intercept 0.017210173 0.00522445 3.29 0.0011
Popsizeinvsqrt 1.690911279 0.05147856 32.85 <.0001
Complexity -0.000226369 0.00006202 -3.65 0.0003
Popsizein*complexity 0.001681788 0.00045801 3.67 0.0003
3.2.2. Antwerp
The results of this analysis for Antwerp are listed in Tale 4. In this case, all signs of the estimated coefficients are positive. However, only the estimated coefficient for the population variable is significant at conventional levels in this case. The correlation coefficient for this study is also equal to 0.97. Note that the same value was found for the Rotterdam area. Table 4: Estimated effects of population size and complexity on coefficient of variation for daily distance traveled (Antwerp)
Parameter Estimate Standard Error t Value Pr > |t|
Intercept 0.003734381 0.00728605 0.51 0.6086
Popsizeinvsqrt 1.383282569 0.04767283 29.02 <.0001
Complexity 0.000198722 0.00015095 1.32 0.1890
popsizein*complexity 0.000783896 0.00069270 1.13 0.2586
4. Conclusions and Discussion
The interest in uncertainty analysis is rapidly increasing recently. It witnesses the understanding that estimates of uncertainty provide valuable information to decision makers. Nevertheless, the number of studies conducting uncertainty analysis to activity-based model of travel demand in general and rule-based systems in particular is still very scarce.
In this study, we have compared model uncertainty for a particular performance indicator (daily distance travelled per person) generated by the Albatross model system and its Flemish equivalent (Feathers). These models were applied to a fraction of the synthetic of respectively the cities of Rotterdam, The Netherlands and Antwerp (Belgium), both major European harbours.
Unfortunately, due to differences in data collection, the data could not be pooled, making a direct analysis impossible. Consequently, the comparison in outcomes should stay more global. Model uncertainty, measured in terms of the coefficient of variation, in both studies for the investigated performance indicator is relatively small. A high proportion of variation in the uncertainty can be attributed to differences in socio-demographics.
Because uncertainty is expected to be related to population size and complexity of the classification, the relationship between the coefficient of variation and the inverse square root of population size and complexity was also analysed. Remarkable differences between the two cities were found.
Overall, this study suggests that model uncertainty in Albatross (and its equivalent) is small. Additional research is needed to examine whether similar results will be found for other aggregate performance indicators and for other study areas.
Acknowledgements
This work has been funded by the European Commission, under the Seventh Framework Programme, by Contract no. 248488 within project The Uncertainty Enabled Model Web. The views expressed herein are those of the authors and are not necessarily those of the European Commission.
References
Arentze, T.A. and H.J.P. Timmermans (2004). A learning-based transportation oriented simulation system. Transportation Research Part B, 38, 613–633.
Bellemans, T., D. Janssens, G. Wets, T.A. Arentze and H.J.P. Timmermans (2010). Implementation framework and development trajectory of Feathers activity-based simulation platform.Transportation Research Record, 2175, 111–119.
Castiglione, J., J. Freedman and M. Bradley (2003). Systematic investigation of variability due to random simulation error in an activity-based micro-simulation forecasting model.
Transportation Research Record, 1831, 76-88.
Cools, M., B. Kochan, T. Bellemans, D. Janssens and G. Wets (2011). Assessment of the effect of microsimulation error on key travel indices: Evidence from the activity-based model Feathers. Proceedings of the 90th Annual Meeting of the Transportation Research Board, Washington, D.C.
Davidson, W., R. Donnelly, P. Vovsha, J. Freedman, S. Ruegg, J. Hicks, J. Castiglione, and R. Picado (2007). Synthesis of first practices and operational research approaches in activity based travel demand modeling. Transportation Research Part A, 41, 464-488.
Horni, A., D. Charypar and K.W. Axhausen (2011). Variability in Transport Microsimulations Investigated for MATSim: Preliminary Results. Arbeitsberichte Verkehrs- und Raumplanung, 676, ETH Zürich, Zürich.
Rasouli, S., T.A Arentze and H.J.P. Timmermans (2011). Error propagation in complex large-scale computational process models of activity-travel behavior. In: W.Y. Szeto, S.C. Wong and N.N. Sze (ed.), Transportdynamics, HKSTS, Hong Kong, China, pp. 291-298.
Rasouli, S. and H.J.P. Timmermans (2012). Uncertainty in travel demand forecasting models: Literature review and research agenda. Transportation Letters, 4, 55-73.
Veldhuisen, K.J., H.J.P. Timmermans, and L.L. Kapoen (2000). Microsimulation model of activity-travel patterns and traffic flows: Specification, validation tests and Monte Carlo error.
Transportation Research Record, 1706, 126-135.
Ziems S., B. Sana, J. Plotz. and R.M. Pendyala. (2011). Stochastic variability in microsimulation modeling and convergence of corridor-level characteristics. Proceedings of
the 90th Annual Meeting of the Transportation Research Board, Transportation Research
Board, Washington, D.C.