C F A / V I S H N O 2 0 1 6
Review on the Applications of Directional Impulse
Responses in Room Acoustics
J.-J. Embrechts
Universit´e de Li`ege, Institut Montefiore B28, Campus du Sart-Tilman, 4000 Li`ege,
Belgique
In this review paper, we study the state-of-the-art concerning the applications of directional echograms and directional room impulse responses (DRIRs). An extensive literature survey has been carried out in the field of room acoustics and audio engineering. The definition of DRIRs, how they can be obtained by computer programs or by measurements and what are their applications, these are the main subjects that are discussed in this paper. Microphone arrays are mostly used in today’s DRIR measurements. A spherical array containing 16 microphones has been realised and applied in our laboratory. It is briefly described in the last section.
1 Concept and definitions
In room acoustics, echograms and impulse responses are fundamental data from which many properties and quality indicators can be derived. A room impulse response (RIR) is defined as the pressure signal at a given receiver position in the room resulting from an impulse signal generated by the source. The impulse response therefore depends on the source and receiver positions. The sound source is usually omnidirectional, but also the pressure sensor located at the receiver position. The echogram is the energy counterpart of the RIR: this diagram illustrates the square of the aforementioned pressure signal as a function of time. Usually, echograms are presented in specific octave or third-octave bands, implying that the corresponding RIR has been filtered in these frequency intervals.
Echograms and RIRs are basically non-directional information. However, the directionality of the sound field at a listener’s position is “very important if one wants to represent a room in its full complexity”[1].
The concept of directional echogram is described in Kuttruff’s “Room acoustics” [2]. The author imagines a directional cone with a small aperture whose function is to collect the sound contributions at the receiver and obtain a directional distribution of reflections. This distribution can be developed along the time axis which gives the directional echogram. It can also be integrated over all times to obtain what the author has called the “steady-state directional distribution”.
By analogy, the directional room impulse response or DRIR is the impulse response restricted to the contribution of waves arriving from directions ‘close to’ a look direction :0 [3,4]: see figure 1. The name “directional room (impulse) response” has been often used in the scientific literature since the early 2000’s, for example in [3-8]. However, the name “spatial impulse response” is also used to name the same signal [9,10].
Figure 1: Definition of the directional room impulse response.
The directionality can also be considered at the source level, if the source is not isotropic [9]. In that case, if the sound emission is discretized into M directions or spatial components (e.g. spherical harmonics spatial distributions) and if N ‘directional cones’ are defined at the receiver’s position, then MxN DRIRs are necessary to completely describe the sound field. This complexity is not necessary if
the sound source is static, since the DRIRs computed or measured at the receiver’s position will be linked to a fixed orientation of the source. On the other hand, if the source is rotating (e.g. in real-time interactive auralizations), then the DRIRs must be modified at each new orientation.
2 Computing directional echograms
and DRIRs
Directional echograms can be computed by methods developed in geometrical acoustics models. According to Kuttruff [2, 4th ed. p.301], it is sufficient to store the direction from which each sound ray arrives at the receiver.
Generally, spherical receivers are defined at several positions in the room and their surface is divided into a given number of spatial angles. All the sound rays arriving in the same spatial angle contribute to the same directional echogram. This method creates “directivity groups” of sound rays which of course limit the spatial resolution of the directional echogram.
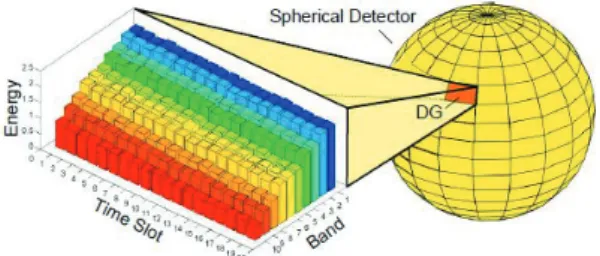
The resolution is limited by the extent of the spatial angles. Kuttruff [11] suggested 30 to 40 directional groups for the direct sound contributions and only 5 properly selected and overlapping groups for early reflections and the late part of the echograms. In our sound ray program, we use 6 or 26 non-overlapping divisions on each spherical receiver [4,12]. Figure 2 (published in [13], but also appearing in [1,14]) perfectly illustrates the computation of directional echograms by such methods: it shows the reverberation decays computed for a particular spatial angle in several frequency bands.
Figure 2: Directional echograms [13].
The resolution of computed directional echograms can be improved by hybrid methods combining image sources and rays. Indeed, image sources are accurately localised in the 3D space and their contribution can be attributed to a well-defined incident direction. This means that early specular reflections can be accurately spatialized by image sources and that the sphere discretization can be restricted to store the contributions of diffuse reflections and the late part of the echograms.
DRIRs are often computed from directional echograms: echograms give the envelope of the pressure signal and the phase information is approximated by several methods [2,13].
However, DRIRs can be also computed directly. For example, Funkhauser et al [15] suggest that each propagation path identified between the source and the receiver (in geometrical acoustics methods) gives rise to a filter transfer function, taking into account the absorption properties of the room’s surfaces and the atmosphere, the diffraction effects, and so on. After inverse FFT, the corresponding impulse response is correctly located in space and on the time axis. One can imagine that this method must take a long time if it is applied to all image sources and/or rays’ contributions.
Often, to speed up the process of DRIR computations, only the direct sound and early specular reflections are spatialized: Farina et al [16] for example apply this principle to the first 80ms of the response, while Kuttruff [11] proposes to extend this interval to 100-150ms. The diffuse part of the RIR and the late reverberation are assumed to be diffusely distributed, and so their contribution is common to all DRIRs (possibly decorrelated before auralization). This assumption is particularly appreciated for real-time interactive auralizations [17], in which the computation time is an important issue.
However, this opinion is not shared by everyone: for other authors, it is also necessary to provide the spatial attributes of the reverberant sound field. In this respect, Kleiner et al refer to studies made by Wagener and Damaske who “investigated the audibility of different reductions of the reverberant sound field and showed that a minimum of five sectors in the lateral plane where necessary” [18]. Also, the LoRA auralization system [19] computes the diffuse component of the RIR from the frequency-dependent envelopes of the energy and the vectorial intensity (norm and direction) of the late reflections.
Intensity vectors seem also to be the quantities that can be computed by wave-based methods (FEM or BEM) to obtain directional information of the sound field. Indeed, these methods do not compute “propagation paths” like geometrical acoustics ones and their results don’t give directly access to spatial information. However, these methods are not really applied to compute DRIRs.
3 Measuring directional echograms
and DRIRs
Concerning the measurement of these directional quantities, Kuttruff [2] suggests the use of a directional microphone, possibly fitted with a concave mirror (see also [20]) or any similar device, or an array of microphones. The results depend on the limited spatial resolution of the sensor. They furthermore depend, not only on the position, but also on the orientation of the source if this source is anisotropic. Farina and Tronchin [21] recommend using an omnidirectional source, but the problem is to find one in practice. Sometimes however, the directivity of the sound source is an important issue in the determination of DRIRs: Pelzer et al [14] for example have realized a system to auralize symphonic instruments in different rooms, taking into account their directivities.
In the following are presented some research works that have been carried out in the field of DRIR measurements. They are listed in chronological order.
Thiele published one of the oldest papers on the subject in 1953 [22]. He investigated diffusivity in rooms using a microphone at the focus of a parabolic reflector.
Maekawa et al [20] refer to a work done by Richardson and Meyer in 1962 who proposed to rotate a unidirectional microphone in order to obtain an image of the integrated intensity, depending on the direction of incidence. The results are presented as “Hedgehog” diagrams which can help to appreciate the directional diffusivity of a sound field (see figure 3). However, this method was not really popular at that time because its implementation was rather difficult.
Figure 3: Hedgehog diagram (plane view) showing the intensities in norm and direction measured at a receiver’s position.
Of course, the Hedgehog diagram includes time- integrated information, not impulse responses. In 1985, Strom et al [23] showed the results of ‘pulse response’ measurements obtained with a highly directional microphone (equipped with a parabolic screen having a diameter of 1m).
All these previously described methods required the rotation of a single directional microphone. Perhaps a first application of microphone arrays to the measurement of 3D room impulse responses was realized by Gerzon in 1975 [24]. In a short communication, this author proposed to use a 4-channel B-format microphone array to record concert hall acoustics for posterity. This microphone array was also incorporated by Merimaa et al in their SIRR method (see section 5) and also by Polack et al [25].
In 1982, Broadhurst [26] presented an array of 125 microphone positions, equally spaced in an imaginary cube, “to determine the direction, bearing and relative intensity of individual reflections in an enclosure”. A sparse version of it has also been designed to reduce the computation load. Two directional room impulse responses are illustrated in this (early) paper.
Another measurement method due to Yamasaki et al in 1989 (referred in [20]) is based on the sound recordings of four microphones closely located around the receiving position. With this small microphone array, the directional impulse responses can be obtained in several directions by processing the four microphone signals. In this work, the DRIR was used to set up a distribution of (virtual) image sources around the receiving position, as a function of direction and distance.
At the beginning of this century, Merimaa et al [5] used a special 3-D microphone array consisting of two intensity probes in each x-, y- and z-directions to compute intensity vectors in a spectrogram-like map (time and frequency representation). These authors have especially considered a user-friendly visualization of such 5-dimensional data.
In 2003, Henderson [7] recognized the difficulty “to attain very narrow, controllable beamwidths with physical techniques alone”. He therefore utilized a planar microphone array which was steerable by beamforming (signal processing) methods, in order to obtain directional room impulse responses and analyse the early reflections in a music hall.
In 2004, Gover et al [8] make use of two 32-microphones spherical arrays to cover a bandwith of 300 to
3000 Hz and obtain directional impulse responses in rooms. MLS is used as an excitation signal. The DRIRs are used to compute normalized sets of incident energies that are plotted to represent the sound field’s directivity in some rooms.
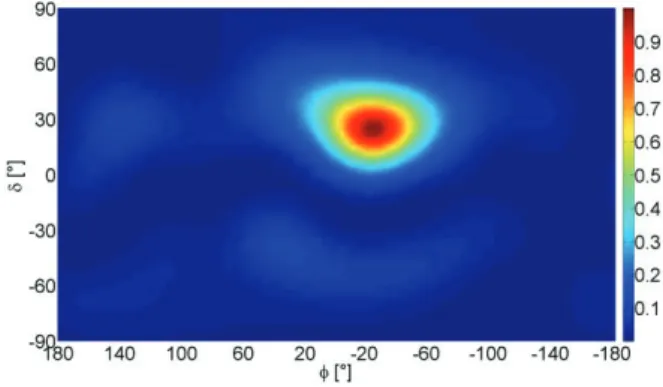
In 2007, Rafaely at al [3] have measured DRIRs in an auditorium with an array consisting of 882 microphone positions on an open sphere (in fact, a dual-sphere with two radii). In order to obtain this high-resolution spatial instrument (9 degrees aperture), a single microphone is rotated and sequentially positioned at the 882 locations. This procedure can of course require much more time than those using simultaneous measurements by several microphones. Furthermore, it is only valid if the room acoustics is assumed to be time-invariant. However, the authors point out that the identification of early reflections in the room impulse response requires a high-spatial resolution, which explains the high number of microphones. In addition to the spatial separation of these reflections, a 3.3ms time window was used to separate them also along the time axis. Representations show integrated time-sections of the directional impulse responses, as a function of azimuth and elevation angles (see figure 4).
Figure 4: Typical diagram showing the result of time-windowing of a room impulse response in order to extract a specific contribution (here, a reflection coming from the ceiling, G=0° being the horizontal plane). This reflection is located in azimuth and elevation by beamforming.
Four years later, Clapp et al [10] have described their 16 microphones spherical array for room acoustics applications, which has inspired the development of our own microphone array (see section 7).
Finally in 2013, the objective of recording concert hall acoustics for posterity proposed by Gerzon some 40 years earlier has been pursued by Farina et al [21] and other Italian researchers. Farina’s team has used several kinds of microphones (sometimes rotating), but their new system is based on a spherical array of 32 microphones. The 32 signals are processed in real-time to ‘mimic’ a set of several virtual 4th-order cardioid microphones, pointing in different directions. This allows to obtain a colour map of the sound field distribution in space, for each 1ms time-window of the measured RIR. The authors even propose to standardize this kind of measurement under the name “P-format” or “Spatially-samples PCM”. With this kind of diagram, it becomes quite easy to localize the first reflections in the room and also to evaluate the sound field’s diffusivity. Multichannel RIRs can also be used to provide 3D auralization in a studio (see fig. 4 of Farina’s paper). This method has been used in a few historical rooms and theatres.
Concerning the representation format of DRIRs and according to [9], “some candidates exist for such universal formats, such as higher-order Ambisonics, but this is not yet well established”.
4 Spatially integrated versions of
DRIRs
Perhaps the best-known example of a (spatially) integrated version of the DRIR h(T,I,t) is the ‘binaural
room impulse response (BRIR)’ [1, 2, 17, 18, 27, 28]:
³
³
:
S SI
T
I
T
0 2 0)
,
,
(
*
)
,
,
(
)
(
t
=
h
t
H
t
d
h
left left (1)In this definition, the angles T and I are defined in figure 1, d: = sinT dT dI , ‘*’ is the convolution product and Hleft(T,I,t) is the left head-related impulse response (a
similar definition can be expressed for the right ear). The measurement of binaural room impulse responses can be directly obtained with an artificial head or with a small microphone located at the entrance of each ear canal of a listener’s head (personal BRIRs).
According to Vorländer [28], the first applications of BRIRs for auralizations were developed by Pösselt in 1986, after the principles were proposed by Schroeder in 1962. A definition of computed BRIRs in the frequency domain can be found in [28, eq. 11.50]. Computed and measured binaural impulse responses have many applications in auralization. In particular, comparing computed and measured BRIRs is a direct method to validate the process of auralization [18].
In addition to binaural RIRs, Farina et al [16] suggest the synthesis (by computation) of Ambisonics RIRs. For these spatially integrated RIRs, the head-related IR in (1) is replaced by the impulse response of each Ambisonics channel. 4-channel B-format (or first order Ambisonics) is the simplest implementation, but it can already “accommodate with various multichannel loudspeaker layouts” for auralization applications [29].
In [30], this idea has been extended to the computation of high-order Ambisonics (HOA) impulse responses: a beam-tracing algorithm is used to detect specular reflections up to a given order. These singular contributions are then weighted by HO spherical harmonics depending on their direction of arrival. The treatment of the late reverberant part of the RIR is restricted to the first-order Ambisonics encoding. A similar method has been implemented in the LoRA auralization system [19].
Another way of integrating the spatial information is to compute a mean incidence vector. In that case, the spatial integration simply gives the average direction of the intensity contributions at the receiver, the integration being restricted to a particular time interval of the echogram. This information has been used in [29] to estimate the value of IACC associated to a particular time segment. In [5], intensity vectors (in magnitude and direction) are computed and plotted on a time-frequency pressure diagram. In both studies, there was no corresponding definition or computation of a “vector” impulse response.
The definition of spatial room acoustics’ parameters (describing the ‘spatial impression’ [2, 31]) can also include the concept of DRIR, but not explicitly. For example, the
definition of the early lateral energy fraction or LEF is the following:
³
³
ms ms msdt
t
g
dt
t
g
=
LEF
80 0 2 80 5 2/
(
)
cos
)
(
\
(2)In the numerator of this expression, the room impulse response g(t) must be developed as a function of the direction of incidence at the receiver, as it is weighted by the cosine of the angle \ , which is the angle between the inter-aural axis of the listener’s head and each incident sound contribution in g(t). For the measurement of this parameter LEF, the room impulse response g(t)cos\ is simply obtained by a gradient microphone and is therefore a spatially integrated version of the DRIR. Besides, ‘synthesized’ DRIRs have been used by Barron and Marshall [31] to test the influence of lateral reflections and finally obtain the expression of the LEF (called Lf by these authors).
Other spatial parameters have been measured by Okubo et al in a multi-purpose hall [6] with an array containing five microphones.
5 DRIR synthesis
Room impulse responses are usually divided into direct sound, early reflections and late reverberation. These three contributions lead to different localization cues that can be simulated by synthesized RIRs. In the following, we only consider DRIRs which have been synthesized from measurement data.
Kuster [32] has proposed a method to synthesize
Multichannel room impulse responses from mono or stereo
measured RIRs (mono or stereo to multichannel upmix). No additional information about the room or its acoustics is required: the direct sound, (at most) four image sources contributions (first order) and the diffuse reverberated field are separately approximated, allowing the synthesis of multichannel versions of the initial mono or stereo RIR. Of course, the nature of the problem is highly undetermined.
Kuster’s method has been objectively and subjectively validated in a companion paper, by comparing measured and reconstructed multichannel impulse responses in several rooms. However, no particular application has been suggested nor developed by the author.
It must be noted that the concept of multichannel room impulse responses includes, but is not restricted to DRIRs. While DRIRs are room impulse responses measured (or computed) at the same receiver position in the room, multichannel ones can include sets of RIRs measures at different positions by several microphones, possibly pointing in several directions (see for example [32, fig.4]). Also, the term ‘multichannel RIR’ can be reserved for the impulse responses attributed to each loudspeaker or transducer in a multichannel reproduction system for auralization [19].
Another synthesis method called SIRR (Spatial Impulse
Response Rendering) has been developed by Merimaa and
Pulkki [33,34]. The main application of this method is the auralization of virtual spaces based on synthesized RIR. The SIRR analysis is first performed on RIRs which have been measured by any multichannel microphone system (the authors have used a B-format Soundfield microphone). Then, the direction and the diffuseness of sound contributions are determined in several frequency bands.
Finally, multichannel RIRs adapted to any arbitrary loudspeaker system are computed.
The evaluation has shown that SIRR is able to provide high quality auralization by using a “psychoacoustically motivated analysis-synthesis procedure”.
SIRR has been implemented and extended as the Directional Audio Coding (DirAC) method [35]. This technique is used to transmit the spatial parameters of any audio signal as metadata, while the audio content is transmitted as a monophonic channel (e.g. for teleconferencing applications).
6 Applications of DRIRs and
directional echograms
In view of this literature survey, the following applications have been proposed:
x The localisation of the direct sound and the first reflections in room acoustics [3, 8, 10, 12, 21, among others], and the detection and identification of possible perceptible echoes
x Also in room acoustics, the determination of spatial indicators, the auditorium assessment or correction [8, 21]
x Evaluate the sound field’s diffusivity [8, 22]
x Binaural, transaural or multichannel RIRs can provide 3D auralizations through headphones or in a studio [1, 4, 10, 13, 18, 28, among others] x Recording concert hall acoustics for posterity [21] x Synthesized DRIRs can condense the main spatial
characteristics of a room’s acoustics for transmission purposes (for example in teleconferencing applications) [32-34].
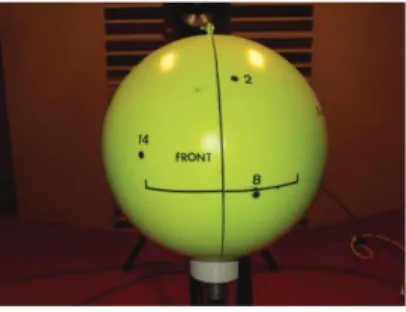
7 A 16 microphone spherical array
A spherical array containing 16 microphones has been designed for room acoustics applications and realized in our laboratory [36]. Figure 5 shows a picture of this array.
Figure 5: Sixteen microphone spherical array.
Figure 6 illustrates the measurement of DRIRs with this system: first, logarithmic sine sweep signals [37] are played with an ‘omnidirectional’ sound source. The sweeps are generated within the useful bandwith of the array, i.e. between 250 Hz and 4 kHz. They are collected by the 16 microphones, averaged and de-convolved to finally obtain 16 room impulse responses (between the sound source location and each microphone).
In a second step, three beamforming methods have been implemented and are available to compute the DRIRs in specific ‘look’ (or steering) directions. These three methods are called ‘delay-and-sum’ (DAS), ‘plane wave decomposition’ (PWD) and ‘minimum-variance distortionless response’ (mvdr) [36].
Figure 6: General layout for DRIR measurements. We will now briefly describe some results to highlight some problems which may appear in the interpretation of DRIR measurements.
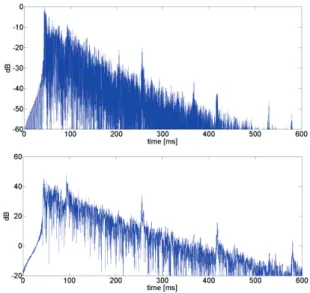
Figure 7 shows the omnidirectional RIR and the DRIR (along the horizontal ‘rear’ direction) which have been measured in a long corridor, in which flutter echoes exist. These strong specular reflections clearly appear in the RIRs (for example around 94ms, 256ms, 418ms and 580ms.
Figure 7: Omnidirectional (up) and directional (down) RIR measured at the same position in a long corridor. The reference for the decibel scales is different in both figures.
The omnidirectional RIR shows the direct contribution (around 50ms) which is incident along the ‘front’ horizontal direction in this case. However, this direct contribution also appears in the DRIR computed in the opposite direction: it has been attenuated, but not completely. Beamforming methods act as spatial filters, but the rejection is not ‘perfect’ outside the spatial aperture of this filter. As a consequence, a ‘false’ detection of reflection could have been observed around 50ms, in the ‘rear’ direction.
False detections is a first class of problems of interpretation in measured DRIRs: these problems are related to the directivity diagram of the antenna, the aperture of the main lobe of sensitivity and the possible
presence of secondary lobes which can create spatial aliasing.
A second class of problems is related to the time windowing operation, which is used to isolate single specular reflections in the DRIR. This has been illustrated in figure 14 of ref. [36]. The ‘mvdr’ beamforming method has been applied to the same portion of a measured RIR, but with two different window size: 1ms and 2ms. The results were shown to be significantly different. This example raised the problem of the window length: if it is too wide, then more contributions (reflections) are included in the RIR and it becomes difficult to isolate a single reflection. However, if the time window is too short, the signal associated with a single reflection can be significantly distorted.
These two problems have not been much studied in the recent room acoustics literature.
8 Conclusion
A detailed review of the literature has provided definitions, methods of computation and measurement of directional room impulse responses and echograms. The development of microphone arrays has encouraged room acousticians to obtain more accurate in-situ measurements of DRIRs. These responses can be used in several applications such as the identification of early reflections, the evaluation of the sound field’s diffusivity or in auralizations.
A 16 microphones spherical array has been developed in our lab. Some problems must still be further investigated, in particular those related to false detections of reflections and time windowing operations. Only very few studies have been dedicated to these problems, and also to the comparison of computed and measured directional echograms.
Acknowledgment
The author would like to thank Dirk Schröder for his permission to reproduce figure 2 in this paper.
References
[1] T. Lentz, D. Schröder, M. Vorländer and I. Assenmacher, Virtual reality system with integrated sound field simulation and reproduction, EURASIP Jnl
on Advances in Signal Processing, Article ID 70540,
19 pages (2007).
[2] H. Kuttruff, Room acoustics 3rd ed., Elsevier Applied
Science, London and New York (1991) and 4th ed.,
Taylor & Francis, London and New York (2000). [3] B. Rafaely, I. Balmages and L. Eger, High-resolution
plane-wave decomposition in an auditorium using a dual-radius scanning spherical microphone array, J.
Acoust. Soc. Am. 122(5), 2661-2668 (2007).
[4] J.J. Embrechts, N. Werner and S. Lesoinne, Computation of directional impulse responses in rooms for better auralization, AES 118th Convention, paper 6498, 5 pages (2005).
[5] J. Merimaa, T. Lokki, T. Peltonen and M. Karjalainen, Measurement, analysis and visualization of directional
room responses, AES 111th Convention, paper 5449, 9
pages (2001).
[6] H. Okubo, M. Otani, R. Ikezawa, S. Komiyama and K. Nakabayashi, A system for measuring the directional room acoustical parameters, Applied acoustics 62, 203-215 (2001).
[7] P.D. Henderson, Directional room acoustics measurement using large-scale microphone arrays, AES
115th Convention, paper 5899, 9 pages (2003).
[8] B.N. Gover, J.G. Ryan and M.R. Stinson, Measurements of directional properties of reverberant sound fields in rooms using a spherical microphone array, J. Acoust. Soc. Am. 116(4) Pt.1, 2138-2148 (2004).
[9] U.P. Svensson, U. Reiter, D.M. Behne, Evaluating auralization, Proceedings of the EAA Symposium on
Auralization, Espoo (2009).
[10] S.W. Clapp, A.E. Guthrie, J. Braasch and N. Xiang, Investigations of room acoustics with a spherical microphone array, AES 131st Convention, paper 8459,
8 pages (2011).
[11] K.H. Kuttruff, Auralization of impulse responses modeled on the basis of ray-tracing results, J. Audio
Eng. Soc. 41(11), 876-880 (1993).
[12] J.J. Embrechts, Computation and applications of directional echograms in rooms and concert hall acoustics, Proceedings of the 19th International Congress on Acoustics, Madrid (2007).
[13] D. Schröder, Physically based real-time auralization of
interactive virtual environments, Dissertation thesis at
RWTH Aachen university (2011).
[14] S. Pelzer, M. Pollow and M. Vorländer, Auralization of a virtual orchestra using directivities of measured symphonic instruments, Proceedings of the Acoustics
2012 Nantes Conference, 2373-2378 (2012).
[15] T. Funkhauser, N. Tsingos and J.M. Jot, Survey of methods for modeling sound propagation in interactive virtual environment systems (2003)
http://citeseerx.ist.psu.edu/viewdoc/similar?doi=10.1.1. 9.5567&type=ab (access 12-02-2016).
[16] A. Farina, S. Fontana and S. Campanini, New method for auralizing the results of room acoustics simulations,
Proceedings of the 19th International Congress on
Acoustics, Madrid (2007).
[17] L. Savioja, J. Huopaniemi, T. Lokki and R. Väänänen, Creating interactive virtual acoustic environments, J.
Audio Eng. Soc. 47 (9), 675-705 (1999).
[18] M. Kleiner, B.-I. Dalenbäck and P. Svensson, Auralization-An overview, J. Audio Eng. Soc. 41 (11), 861-875 (1993).
[19] S.Favrot and J.M. Buchholz, LoRA: A loudspeaker-based room auralization system, Acta acustica united
with Acustica 96, 364-375 (2010).
[20] Z. Maekawa, J.H. Rindel and P. Lord, Environmental
and architectural acoustics, 2nd ed., Spon Press,
London and New York (2011).
[21] A. Farina and L. Tronchin, 3D sound characterization in theatres employing microphone arrays, Acta acustica
united with Acustica 99, 118-125 (2013).
[22] R. Thiele, Richtungsverteilung und zeitfolge der schallrückwürfe in räumen, Acustica 3 Suppl. 2, 291-302 (1953).
[23] S. Strom, H. Dahl, A. Krokstad and E. Eknes, Acoustical design of the Grieg Memorial Hall in Bergen, Applied acoustics 18, 127-142 (1985).
[24] M. Gerzon, Recording concert hall acoustics for posterity, J. Audio Eng. Soc. 23, 569-571 (1975). [25] J.-D. Polack and F. Leao Figueiredo, Room acoustic
auralization with Ambisonics, Proceedings of the
Acoustics 2012 Nantes Conference, 911-916 (2012).
[26] A.D. Broadhurst, Sparse Volume Array for Architectural Acoustic Measurements, Acustica 50, 33-38 (1982).
[27] F. Menzer and C. Faller, Investigations on an early-reflection-free model for BRIRs, J. Audio Eng. Soc. 58
(9), 709-723 (2010).
[28] M. Vorländer, Auralization, Springer-Verlag, Berlin (2008).
[29] F. Cruz-Barney and O. Warusfeld, Prediction of the spatial information of the control of room acoustics auralization, AES 103rd Convention, paper 4628, 15
pages (1997).
[30] M. Noisternig and B.F.G. Katz, Framework for real-time auralization in architectural acoustics, Acta
acustica united with Acustica 94, 1000-1015 (2008).
[31] M. Barron and A.H. Marshall, Spatial impression due to early lateral reflections in concert halls: the derivation of a physical measure, J. Sound and Vib.
77(2), 211-232 (1981).
[32] M. Kuster, Multichannel room impulse response rendering on the basis of undetermined data, J. Audio
Eng. Soc. 57 (6), 403-412 (2009).
[33] J. Merimaa and V. Pulkki, Spatial impulse response rendering I: Analysis and synthesis, J. Audio Eng. Soc.
53 (12), 1115-1127 (2005).
[34] V. Pulkki and J. Merimaa, Spatial impulse response rendering II: Reproduction of diffuse sound and listening tests, J. Audio Eng. Soc. 54 (1/2), 3-20 (2006). [35] V. Pulkki, Spatial sound reproduction with Directional Audio Coding, J. Audio Eng. Soc. 55 (6), 503-516 (2007).
[36] J.J. Embrechts, Measurement of 3D room impulse responses with a spherical microphone array,
Proceedings of the Euronoise Congress, Maastricht
(2015).
[37] G.B. Stan, J.J. Embrechts and D. Archambeau, Comparison of different impulse response measurement techniques, J. Audio Eng. Soc. 50, 249-262 (2002).