HAL Id: tel-02048762
https://hal.archives-ouvertes.fr/tel-02048762v2
Submitted on 23 May 2019
HAL is a multi-disciplinary open access
archive for the deposit and dissemination of sci-entific research documents, whether they are pub-lished or not. The documents may come from teaching and research institutions in France or abroad, or from public or private research centers.
L’archive ouverte pluridisciplinaire HAL, est destinée au dépôt et à la diffusion de documents scientifiques de niveau recherche, publiés ou non, émanant des établissements d’enseignement et de recherche français ou étrangers, des laboratoires publics ou privés.
deployed on large distributed systems with a focus on
improving file management
Anchen Chai
To cite this version:
Anchen Chai. Realistic simulation of the execution of applications deployed on large distributed systems with a focus on improving file management. Modeling and Simulation. Université de Lyon, 2019. English. �NNT : 2019LYSEI003�. �tel-02048762v2�
N°d’ordre NNT : 2019LYSEI003
THESE de DOCTORAT DE L’UNIVERSITE DE LYON
opérée au sein de
(INSA LYON)
Ecole Doctorale
N° ED160(Électronique, Électrotechnique, Automatique)
Spécialité/ discipline de doctorat
:Informatique
Soutenue publiquement le 14/01/2019, par :
Anchen CHAI
Titre de la thèse
Simulation réaliste de l'exécution des
applications déployées sur des systèmes
distribués avec un focus sur
l'amélioration de la gestion des fichiers
Devant le jury composé de :
Prodan, Radu Professeur University of Klagenfurt Rapporteur
Breton, Vincent DR CNRS IN2P2 Rapporteur
Genaud, Stéphane Professeur Université de Strasbourg Examinateur Marangozova-Martin, Vania MCF, HDR Université de Grenoble Examinatrice Benoit-cattin, Hugues Professeur INSA-LYON Directeur de thèse
Suter, Frédéric CR, HDR CC-IN2P3 Co-directeur
SIGLE ECOLE DOCTORALE NOM ET COORDONNEES DU RESPONSABLE
CHIMIE CHIMIE DE LYON
http://www.edchimie-lyon.fr
Sec. : Renée EL MELHEM Bât. Blaise PASCAL, 3e étage
secretariat@edchimie-lyon.fr
INSA : R. GOURDON
M. Stéphane DANIELE
Institut de recherches sur la catalyse et l’environnement de Lyon IRCELYON-UMR 5256
Équipe CDFA
2 Avenue Albert EINSTEIN 69 626 Villeurbanne CEDEX directeur@edchimie-lyon.fr E.E.A. ÉLECTRONIQUE, ÉLECTROTECHNIQUE, AUTOMATIQUE http://edeea.ec-lyon.fr Sec. : M.C. HAVGOUDOUKIAN ecole-doctorale.eea@ec-lyon.fr M. Gérard SCORLETTI
École Centrale de Lyon
36 Avenue Guy DE COLLONGUE 69 134 Écully
Tél : 04.72.18.60.97 Fax 04.78.43.37.17
gerard.scorletti@ec-lyon.fr
E2M2 ÉVOLUTION, ÉCOSYSTÈME,
MICROBIOLOGIE, MODÉLISATION
http://e2m2.universite-lyon.fr
Sec. : Sylvie ROBERJOT Bât. Atrium, UCB Lyon 1 Tél : 04.72.44.83.62 INSA : H. CHARLES
secretariat.e2m2@univ-lyon1.fr
M. Philippe NORMAND
UMR 5557 Lab. d’Ecologie Microbienne Université Claude Bernard Lyon 1 Bâtiment Mendel 43, boulevard du 11 Novembre 1918 69 622 Villeurbanne CEDEX philippe.normand@univ-lyon1.fr EDISS INTERDISCIPLINAIRE SCIENCES-SANTÉ http://www.ediss-lyon.fr
Sec. : Sylvie ROBERJOT Bât. Atrium, UCB Lyon 1 Tél : 04.72.44.83.62 INSA : M. LAGARDE
secretariat.ediss@univ-lyon1.fr
Mme Emmanuelle CANET-SOULAS
INSERM U1060, CarMeN lab, Univ. Lyon 1 Bâtiment IMBL
11 Avenue Jean CAPELLE INSA de Lyon 69 621 Villeurbanne Tél : 04.72.68.49.09 Fax : 04.72.68.49.16 emmanuelle.canet@univ-lyon1.fr INFOMATHS INFORMATIQUE ET MATHÉMATIQUES http://edinfomaths.universite-lyon.fr
Sec. : Renée EL MELHEM Bât. Blaise PASCAL, 3e étage
Tél : 04.72.43.80.46 Fax : 04.72.43.16.87 infomaths@univ-lyon1.fr M. Luca ZAMBONI Bât. Braconnier 43 Boulevard du 11 novembre 1918 69 622 Villeurbanne CEDEX Tél : 04.26.23.45.52 zamboni@maths.univ-lyon1.fr
Matériaux MATÉRIAUX DE LYON
http://ed34.universite-lyon.fr
Sec. : Marion COMBE
Tél : 04.72.43.71.70 Fax : 04.72.43.87.12 Bât. Direction ed.materiaux@insa-lyon.fr M. Jean-Yves BUFFIÈRE INSA de Lyon MATEIS - Bât. Saint-Exupéry 7 Avenue Jean CAPELLE 69 621 Villeurbanne CEDEX
Tél : 04.72.43.71.70 Fax : 04.72.43.85.28
jean-yves.buffiere@insa-lyon.fr
MEGA MÉCANIQUE, ÉNERGÉTIQUE,
GÉNIE CIVIL, ACOUSTIQUE
http://edmega.universite-lyon.fr
Sec. : Marion COMBE
Tél : 04.72.43.71.70 Fax : 04.72.43.87.12 Bât. Direction mega@insa-lyon.fr M. Jocelyn BONJOUR INSA de Lyon Laboratoire CETHIL Bâtiment Sadi-Carnot 9, rue de la Physique 69 621 Villeurbanne CEDEX jocelyn.bonjour@insa-lyon.fr ScSo ScSo* http://ed483.univ-lyon2.fr
Sec. : Viviane POLSINELLI Brigitte DUBOIS
INSA : J.Y. TOUSSAINT
M. Christian MONTES
Université Lyon 2 86 Rue Pasteur
69 365 Lyon CEDEX 07
Acknowledgements
I would like to emphasize my acknowledgment to all the advisors, Prof. Hugues Benoit-cattin, Dr. Frédéric Suter, and Dr. Sorina Pop for guiding me during the preparation of this thesis. And I am particularly grateful for their countless hours devoted to proof-reading and correction of this thesis, as well as the previously published articles. They have made great efforts to point out my flaws all the time and encourage me to systematically pursue perfection.
Also, I want to thank Dr. Tristan Glatard for always giving me brilliant suggestions to my work and my articles during the last three years. Even though I never met him in person, I still learned enormously from all his articles, our email exchanges, and the video conferences.
Furthermore, I owe many appreciations to Prof. Radu Prodan and Prof. Vincent Breton for their willingness to be my reporters. Your precious time spent on reviewing my Ph.d manuscript and giving me valuable recommendations are deeply respected and admired.
And I feel fairly happy to have known these dear friends from CREATIS: Pierre-Antoine Ganaye, Sarah Leclerc, Noelie Debs, Fei GE, Yunyun SUN, and Hoai-Thu Nguyen. Thanks for your inspirations and help for my research, the Monday and Friday cake, the "soirée", especially for all the moments that we shared together.
Finally, I would like to thank my girlfriend Xiaoyi TIAN for her continuous support and priceless encourage throughout my thesis.
Simulation is a powerful tool to study distributed systems. It allows researchers to evaluate different scenarios in a reproducible manner, which is hardly possible in real experiments. However, the realism of simulations is rarely investigated in the literature, leading to a questionable accuracy of the simulated metrics. In this context, the main aim of our work is to improve the realism of simulations with a focus on file transfer in a large distributed production system (i.e., the EGI federated e-Infrastructure (EGI)). Then, based on the findings obtained from realistic simulations, we can propose reliable recommendations to improve file management in theVirtual Imaging Platform (VIP).
In order to realistically reproduce certain behaviors of the real system in simulation, we need to obtain an inside view of it. Therefore, we collect and analyze a set of execution traces of one particular application executed on EGIvia VIP. The realism of simulations is investigated with respect to two main aspects in this thesis: the simulator and the platform model.
Based on the knowledge obtained from traces, we design and implement a simulator to provide a simulated environment as close as possible to the real execution conditions for file transfers onEGI. A complete description of a realistic platform model is also built by leveraging the information registered in traces. The accuracy of our platform model is evaluated by confronting the simulation results with the ground truth of real transfers. Our proposed model is shown to largely outperform the state-of-the-art model to reproduce the real-life variability of file transfers on EGI.
Finally, we cross-evaluate different file replication strategies by simulations using an enhanced state-of-the-art model and our platform model built from traces. Simulation results highlight that the instantiation of the two models leads to different qualitative decisions of replication, even though they reflect a similar hierarchical network topology. Last but not least, we find that selecting sites hosting a large number of executed jobs to replicate files is a reliable recommendation to improve file management ofVIP. In addition, adopting our proposed dynamic replication strategy can further reduce the duration of file transfers except for extreme cases (very poorly connected sites) that only our proposed platform model is able to capture.
Contents
Abstract iv Contents xvi Acronyms xvii Introduction 1 1 State-of-the-art 5 1.1 Introduction. . . 51.2 Distributed computing infrastructures . . . 5
1.2.1 Grid computing. . . 6
1.2.2 Cloud computing . . . 7
1.3 Application deployment in distributed systems . . . 7
1.3.1 Science gateways . . . 8
1.3.2 Scientific workflows. . . 9
1.3.3 Traces of workflow executions . . . 10
1.3.4 Optimization of workflow execution . . . 11
1.4 File replication . . . 12
1.4.1 Classification for file replication . . . 12
1.4.2 Requirements for file replication in production . . . 13
1.4.3 Existing replication management in production systems . . . 14
1.5 Simulation. . . 17
1.5.1 Simulation tools . . . 17
1.5.2 Platform models for file replication . . . 19
1.6 Conclusion . . . 21
2 Analyzing execution traces of one application deployed on a large dis-tributed system 23 2.1 Introduction. . . 23
2.2 GATE application . . . 24
2.3 Execution traces . . . 26
2.4 Characteristics of file transfers . . . 28
2.4.1 Coarse-grain analysis. . . 29
2.4.2 Fine-grain analysis . . . 33
2.5 Characteristics of workflow and job executions . . . 36
2.5.1 Queuing time durations . . . 36
2.5.2 Distribution of jobs . . . 37
2.5.3 Cumulative downloads for SEs . . . 39
2.6 Conclusion . . . 40
3 Realistic simulation of file transfers for applications deployed on dis-tributed infrastructures 43 3.1 Introduction. . . 43
3.2 Execution of the GATE workflow on EGI . . . 44
3.2.1 GATE workflow in VIP . . . 44
3.2.2 Data management services in EGI . . . 45
3.2.3 Summary of the characteristics of the real system. . . 47
3.3 The SimGrid toolkit . . . 48
3.4 Simulator design . . . 49
3.4.1 Simulated services for data management on EGI . . . 50
3.4.2 Communication cost for file transfers . . . 51
3.4.3 Parameter injection . . . 52
3.5 Conclusion . . . 53
4 Realistic platform models for replaying real workflow executions 55 4.1 Introduction. . . 55
4.2 Build partial platform model from execution traces . . . 56
4.2.1 Baseline model . . . 56
4.2.2 Improvements based on execution traces . . . 57
4.3 Overall evaluation of our model . . . 67
4.3.1 Analysis of simulated transfer durations . . . 67
4.3.2 Analysis of errors . . . 69
4.3.3 Analysis of the root causes of large simulation errors . . . 70
4.4 Conclusion . . . 72
5 Towards a complete and realistic description of the Biomed VO platform 73 5.1 Introduction. . . 73
5.2 Aggregating network information from multiple traces . . . 75
CONTENTS
5.3.1 Empirical model . . . 79
5.3.2 Machine learning model . . . 80
5.3.3 Evaluation . . . 82
5.4 Conclusion and discussion . . . 86
6 Evaluation of file replication strategies through realistic simulations 87 6.1 Introduction. . . 87
6.2 Replication strategies. . . 88
6.2.1 Dynamic replication strategy . . . 88
6.3 Simulation studies . . . 90
6.3.1 Platform Models . . . 90
6.3.2 Simulation scenarios . . . 90
6.4 Performance evaluation . . . 91
6.4.1 Impact of dynamic replication. . . 91
6.4.2 Impact of different prestaging lists on static replication . . . 94
6.4.3 Impact of platform model on replication decisions . . . 95
6.5 Recommendations for file replication in VIP on EGI . . . 97
6.6 Conclusion . . . 99
7 Conclusions and perspectives 101 7.1 Contributions . . . 101
7.2 Perspectives . . . 103
7.2.1 Improving the realism of file transfer simulations . . . 103
7.2.2 Improving the realism of the platform description of EGI . . . 104
7.2.3 Extending the current capacities of our simulator . . . 105
8 Résumé en français 107 8.1 Introduction. . . 108
8.2 Analyse des traces d’exécution d’une application déployée sur un grand système distribué . . . 111
8.2.1 Traces d’exécution . . . 111
8.2.2 Caractéristiques des transferts de fichiers . . . 112
8.2.3 Distribution des tâches. . . 113
8.2.4 Utilisation des ressources de stockage . . . 114
8.3 Simulation réaliste des transferts de fichiers pour les applications déployées sur les systèmes distribués . . . 116
8.3.1 Gestion de données sur EGI . . . 116
8.3.2 L’outil SimGrid . . . 117
8.3.3 La conception du simulateur . . . 118
8.4 Modèles de plates-formes réalistes pour rejouer des exécutions réelles de
workflow . . . 119
8.4.1 Modèle de plate-forme basé sur les traces d’exécution . . . 120
8.4.2 Évaluation globale de notre modèle. . . 123
8.5 Vers une description complète d’un modèle de plate-forme réaliste . . . 125
8.5.1 Agrégation de plusieurs traces vers un modèle de plate-forme unique 125 8.5.2 Remplir les liens manquants dans la plateforme fusionnée . . . 127
8.6 Évaluation des stratégies de réplication de fichiers par les simulations réalistes128 8.6.1 Stratégie de réplication dynamique . . . 128
8.6.2 Modèles de plate-forme . . . 129
8.6.3 Les scénarios de simulation . . . 129
8.6.4 Évaluation des performances . . . 130
8.6.5 Recommandations pour la réplication de fichiers dans VIP sur EGI . 133 8.7 Conclusion . . . 135
List of Figures
1.1 The complete life cycle for an application executed via VIP. . . 9
1.2 Common components in scientific workflows. Figure extracted from [Bharathi et al. (2008)]. . . 10
1.3 Grid model in OptorSim, illustrated from [Bell et al. (2003)]. . . 18
1.4 Multi-tier platform model. . . 19
1.5 Hybrid platform model. . . 20
1.6 General graph model. Figure 1.4, 1.5, 1.6 are from [Tos et al. (2015)]. . . . 20
1.7 A 3-level network hierarchical model. . . 21
2.2 GATE workflow including a computing phase, a merging phase, and asso-ciated file transfers.. . . 26
2.3 Gantt chart view of 10 transfers from "srm-biomed.gridpp.rl.ac.uk" to "CIEMAT-LCG2". . . 30
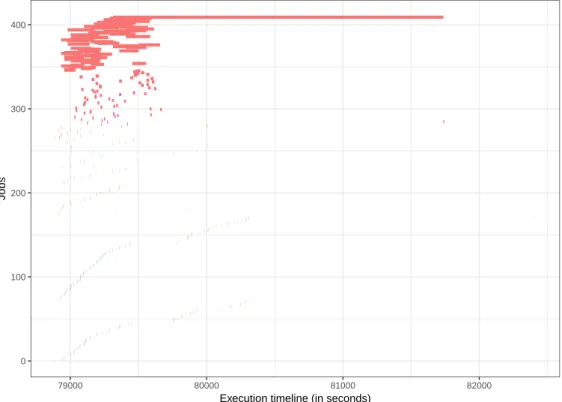
2.4 Gantt chart view of 409 transfers to "CIEMAT-LCG2", including uploads and downloads in one workflow execution. Small points correspond to very short transfer duration. . . 31
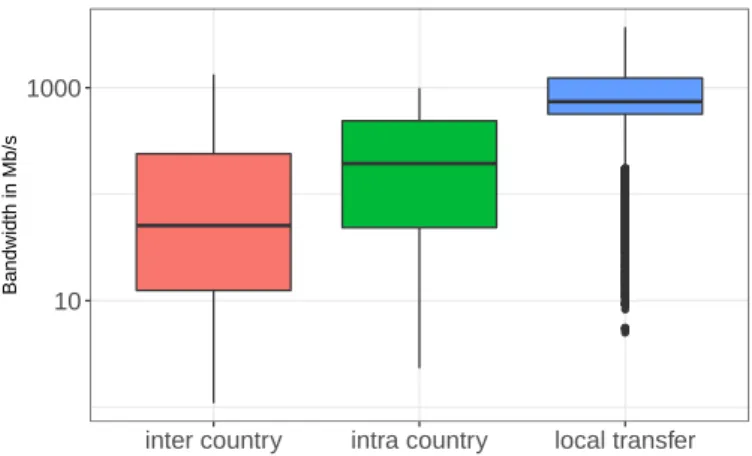
2.5 Distributions of the experienced bandwidth by 11,033 release transfers ac-cording to different link categories. . . 32
2.6 Small local bandwidth for different SEs. Each bar corresponds to the band-widths experienced by local transfers from a specific SE. . . 33
2.7 Distribution of release file transfer durations for a given SE (marsedpm.in2p3.fr) in a given workflow. . . 33
2.8 Gantt chart view of 18 release file transfer durations from the SE "sbgse1.in2p3.fr" to the site "INFN-PISA". Transfers belong to different clusters are in different colors. . . 34
2.9 Gantt chart view of 5 release file transfer durations for a given SE, a given site, and a given cluster. . . 35
2.10 Gantt chart view of release file transfer durations for a given SE, a given site, and a given cluster. . . 35
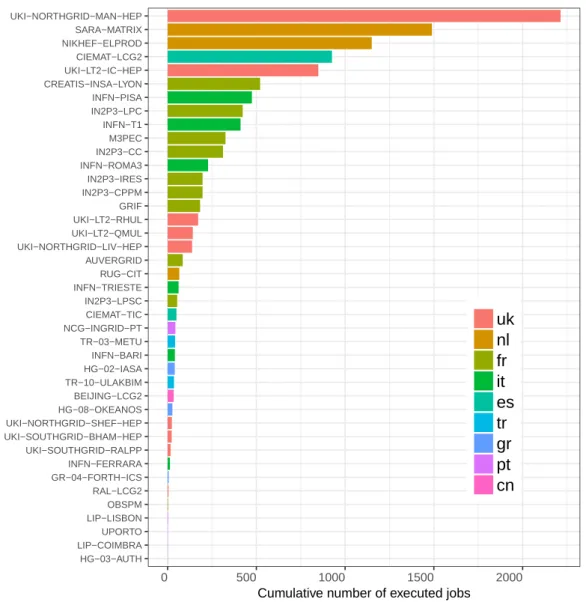
2.11 Distribution of executed jobs by site in studied workflows. . . 38
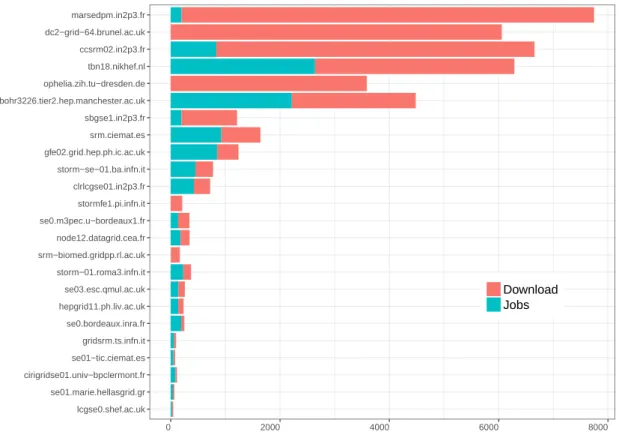
2.12 Cumulative downloads by SEs in studied workflows. . . 39
2.13 Cumulative number of downloads for SEs versus the number of jobs in the corresponding sites.. . . 40
3.1 The complete life-cycle of the execution of the GATE application on EGI. . 44
3.2 Data management on EGI. Figure extracted from [Löschen and
Müller-Pfefferkorn] . . . 45
3.3 The process for file download on EGI. . . 46
3.4 Graphical representation of hierarchical platform in SimGrid, illustrated from [Bobelin et al. (2012)]. . . 49
3.5 Example of a file catalog. . . 51
3.6 Three parts of a simulated file transfer in our simulator. . . 52
4.4 Measured and simulated (with global or grouped average bandwidth for
each SE) durations for the download of the release file by each job in the fNUfzs workflow instance. . . 61
4.5 Measured and simulated durations for the downloads of the release file from the marsedpm.in2p3.fr SE in the fNUfzs workflow instance (top). Simu-lated times are obtained with a single average bandwidth (SE) and distinct
average bandwidths (SE-Site) for each site (bottom). . . . 62
4.7 Measured and simulated durations for the downloads of the release file from the marsedpm.in2p3.fr SE in the fNUfzs workflow instance (top). Sim-ulated times are obtained with a single maximum bandwidth (SE) and distinct maximum bandwidths (SE-Site) for each site (bottom). . . . 63
4.8 Gantt chart view of the transfers of the release file from the
marsedpm.in2p3.fr SE to worker nodes in the INFN-PISA site. . . 64
4.9 Measured and simulated durations for the downloads of the release file from the marsedpm.in2p3.fr SE in the fNUfzs workflow instance with and with-out correction of the maximum observed bandwidth. . . 65
4.10 Measured and simulated durations for the downloads of the release file from the sbgse1.in2p3.fr SE to the INFN-PISA site in the LQz3XJ workflow instance with and without distinction of the clusters. . . 66
4.12 Graphical summary of measured and simulated (with the 10G-SotA, Aver-age, and Maximum models) file transfer durations (in seconds). . . 68
4.13 Cumulative Distributed Functions of the absolute logarithmic error achieved by the three platform models over the whole set of transfers of the release files. . . 69
LIST OF FIGURES
4.14 Gantt chart view of 5 release file transfer durations for a given SE, a given site, and a given cluster. . . 71
4.15 Gantt chart view of release file transfer durations for a given SE, a given site, and a given cluster. . . 71
5.1 Three partial platform descriptions generated from execution traces of work-flow 1 (WF1), workwork-flow 2 (WF2), and workwork-flow 3 (WF3). Each line corre-sponds to the network link between a site and a SE. . . 74
5.2 The merged platform description from the execution traces of workflow 1 (WF1), workflow 2 (WF2), and workflow 3 (WF3). Red line corresponds to the network link without any information from these traces. . . 74
5.3 Graphical summary of measured and simulated (with the Average_Merged, and Maximum_Merged models) release file transfer durations (in seconds). Each point corresponds to the duration of one simulated transfer. . . 77
5.4 Graphical summary of the Mean Absolute Error (MAE) for 20 validation
tests of empirical, linear regression, and neural network model. . . 83
5.5 The validation test which gives us the largest error (0.26) for the neural network model. The solid line corresponds to the ideal case where the predicted bandwidth value is equal to the merged bandwidth for a given link. From top to bottom, panels correspond to the predictions by the empirical model (emp_pred) and the neural network model (nn_pred), respectively. . 84
5.6 The validation test which gives us the smallest error (0.034) for the neural network model. The solid line corresponds to the ideal case where the predicted bandwidth value is equal to the merged bandwidth for a given link. From top to bottom, panels correspond to the predictions by the empirical model (emp_pred) and the neural network model (nn_pred), respectively. . 85
6.1 Cumulative distribution of simulated file transfer durations with and with-out dynamic replication. Each line corresponds to a list of 3 SEs used for file pre-staging. The same 50 random prestaging lists are used in all four scenarios. . . 92
6.2 Cumulative number of downloads for SEs versus the number of jobs in the corresponding sites with and without dynamic replication. . . 93
6.3 Comparison of random, predefined, and the current production prestaging list without dynamic replication for two platform models. . . 94
6.4 Cumulative distribution of simulated file transfer durations with dynamic replication for two platform models . . . 96
6.5 Cumulative distribution of simulated file transfer durations without dy-namic replication for two platform models. Best performance achieved by predefined or randomly selected lists is highlighted. . . 97
6.6 Comparison of the best and the worst prestaging with the current produc-tion prestaging for trace-based model with or without dynamic replicaproduc-tion. 97
8.1 Distribution de la bande passante expérimentée par 11 033 transferts des fichier de release selon différentes catégories de liens. . . 112
8.2 Distribution des tâches exécutés par site dans les traces collectées. . . 113
8.3 Téléchargements cumulatifs par SE dans les traces étudiées. . . 115
8.4 Nombre cumulé de téléchargements pour les SEs par rapport au nombre de tâches dans les sites correspondants. . . 115
8.5 Gestion des données sur EGI. Figure extraite de [Löschen and
Müller-Pfefferkorn] . . . 116
8.6 Le processus de transfert de fichiers (download ou upload) sur EGI. . . 117
8.8 Diagramme de Gantt des transferts du fichier de release depuis
marsedpm.in2p3.fr vers les noeuds du site INFN-PISA. . . 122
8.10 Résumé graphique des durées de transfert de fichiers mesurées et simulées (avec les modèles 10G-SotA, Average et Maximum) (en secondes). . . . 124
8.11 Résumé graphique des durées de transfert de fichiers de release mesurées et simulées (avec les modèles 10G-SotA, Average_Merged et Maxi-mum_Merged) (en secondes). . . 126
8.12 Les bandes passantes prédites pour les liens manquants par modèle em-pirique versus les bandes passantes mesurées des liens connus dans la plate-forme Average_Merged. Les bandes passantes sont exprimées en Gb/s. . . . 128
8.13 Distribution cumulative de durées de transfert de fichiers simulées avec et sans réplication dynamique. Chaque ligne correspond à une liste de 3 SEs utilisés pour la réplication des fichiers. Les mêmes 50 listes aléatoires sont utilisées dans les quatre scénarios. . . 130
8.14 Comparaison des listes aléatoires, pré-sélectionnées et la liste en production sans réplication dynamique pour les deux modèles de plate-forme. . . 131
8.15 Distributions cumulatives des durées de transferts de fichiers simulées avec réplication dynamique pour deux modèles de plate-forme. . . 133
8.16 Distribution cumulative des durées de transferts de fichiers simulées sans réplication dynamique pour les deux modèles de plate-forme. La meilleure performance atteinte par des listes prédéfinies ou sélectionnées au hasard est mise en évidence. . . 133
LIST OF FIGURES
8.17 Comparaison de la meilleure et de la pire liste avec la configuration actuelle en production pour un modèle basé sur les traces avec ou sans réplication dynamique. . . 134
List of Tables
2.1 Summary of information recorded in traces. . . 27
2.2 Summary of the number of jobs for 60 workflows. . . 28
2.3 Statistics on the size of different files in 60 workflows. . . 28
2.4 Statistics of real transfer durations for different files (in seconds). . . 29
2.5 Statistics of queuing time for GATE jobs in collected traces.. . . 36
2.6 Statistics of intra-site delay for GATE jobs in collected traces.. . . 37
2.7 Statistics for the number of jobs per site. . . 37
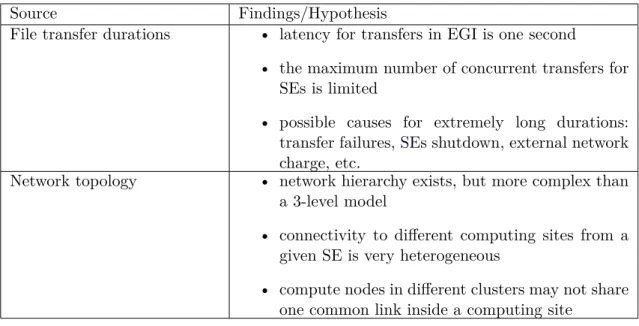
2.8 Cumulative number of executed jobs in different countries in Biomed VO of EGI in 2017. Statistics extracted from traces and from the Dirac server. 38 2.9 Summary of findings or hypothesis from the analysis of file transfers. . . 41
2.10 Summary of characteristics extracted from the executions of workflows. . . 42
2.11 Summary of characteristics extracted from the executions of workflows. . . 42
3.1 Strategy for different parameters in simulator.. . . 53
4.1 Statistics of measured and simulated (with the 10G-SotA, Average, and Maximum models) durations (in seconds) of the transfer of the GATE re-lease files (> 121 MB). . . 68
5.1 Statistics of measured and simulated (with the 10G-SotA, Merged average, and merged maximum models) durations (in seconds) of the transfer of the GATE release files (> 121 MB).. . . 77
5.2 Example of a data set with 4 numerical and 1 categorical variables. . . 81
5.3 The new data set after transforming categorical variable into dummy variables. 81 5.4 Statistic of MAE for 10 validation tests of neural network and linear regres-sion model. . . 83
6.1 Cumulative number of different type of transfers with and without dynamic replication for 15 simulated workflows with 50 random prestaging lists. . . . 94
6.2 95%-confidence interval for the statistics of the simulated release transfers durations of 55 prestaging lists with and without dynamic replication. . . . 98
8.1 Nombre cumulé de tâches exécutées dans différents pays en VO Biomed d’EGI en 2017. Statistiques extraites des traces et du serveur Dirac. . . 114
8.2 Stratégie pour différents paramètres dans notre simulateur. . . 119
8.3 Statistiques des durées de transfert des fichiers de release (> 121 Mo) mesurées et simulées (avec les modèles 10G-SotA, Average et Maximum) (en secondes). . . 125
8.4 Statistiques des durées du transfert des fichiers de release (> 121 Mo) mesurées et simulées (avec les modèles 10G-SotA, Average_Merged et Max-imum_Merged ) (en secondes). . . 126
8.5 L’intervalle de confiance de 95% des statistiques sur les durées de transferts simulées pour les 55 listes étudiées avec et sans réplication dynamique. . . . 134
Acronyms
DAG Directed Acyclic Graph.
DCI Distributed computing infrastructure.
EGI EGI federated e-Infrastructure.
LFC Logical File Catalog.
SE Storage Element.
VIP Virtual Imaging Platform.
VO Virtual Organization.
Introduction
Distributed computing infrastructures (DCIs)such as grids and clouds are popular in-struments for conducting scientific research nowadays. Computing resources from multiple administrative domains are coordinated to be used as a single coherent system. They thus enable scientists to achieve large computing tasks, which could not be executed only by us-ing local resources. Many recent scientific experiments produce large amounts of data that need to be made accessible to large groups of geographically dispersed researchers. For instance, more than 150 Peta bytes of data generated by the ATLAS [Aad et al. (2008)] experiment on the Large Hadron Collider (LHC) [Fernandez et al. (2012)] are currently stored, distributed, and analyzed in World Wide LHC Computing Grid (WLCG) [
Bona-corsi and Ferrari (2007)]. In the last decade, several projects have already demonstrated
the ability ofDCIsto support heavy scientific computations with a high throughput [Laure
and Jones (2009),Romanus et al. (2012)].
To facilitate the utilization of the resources in DCIs, high-level interfaces, such as science gateways [Zhao et al. (2010)a,Glatard et al. (2013),Miller et al. (2015)], have emerged to hide the complexity of managing underlying resources and executing applica-tions. Science gateways combine a set of services (e.g., authentication, data management, application deployment, etc) to deliver the computing and storage resources as transpar-ently as possible for researchers to conduct large scientific experiments.
Meanwhile, different optimization strategies [Da Silva et al. (2013),Camarasu-Pop
et al. (2013)c,Amoon (2013),Calheiros and Buyya (2014),Chettaoui and Charrada
(2014),Poola et al. (2016)] have also been widely investigated for applications deployed
on largeDCIs to improve their performance and to consolidate their reliability. However, validating the impacts of optimizations for applications deployed on such infrastructures is a complex and challenging task, especially for production infrastructures which are oper-ating platforms providing various services to support scientific research twenty four hours a day. Difficulties come from several aspects:
• real experiments of application execution are extremely time-consuming and costly; • application executions are almost impossible to be reproduced in production systems
due to uncontrollable conditions, e.g., network traffic, background workload; • large number of validation experiments may harm the utilization of other users.
These aspects bring extra obstacles for researchers or developers to study and investi-gate the optimization of applications deployments on DCIs.
To cope with these obstacles, simulation has become a widely used method to study ap-plications deployed on largeDCIs. Simulation enables researchers to study the execution of applications in a variety of conditions with a complete control for factors which are uncon-trollable in real systems. Simulation scenarios are also reproducible and much faster com-pared to real experiments. Numerous aspects concerning applications executed onDCIsare studied and evaluated by simulation in the literature [Camarasu-Pop et al. (2013)a,
Man-souri and Dastghaibyfard (2013)a,Dayyani and Khayyambashi (2015),Camarasu-Pop et al.
(2016),Glatard and Evans (2015),Barisits et al. (2016)].
Various simulation toolkits exist [Ostermann et al. (2010),Calheiros et al. (2011)a,
Desprez and Rouzaud-Cornabas (2013),Kliazovich et al. (2012),Chen and Deelman (2012),
Casanova et al. (2014)]. They provide basic functionalities and resource sharing models
allowing users to build their own simulators based on these services. Despite the different implementations adopted by each toolkit, they all require an abstraction of several common components to simulate application executions:
• the hardware platform, e.g., the network topology, the space of storage elements, and the computing power of processors, etc.;
• the software services deployed on the platform, e.g., schedulers, file transfer service; • the application itself, e.g., the workload characteristics.
Each component will have a serious impact on the simulation performance and the realism of simulation behavior for these components will directly decide the reliability of simulation results.
However, the accuracy of these simulation toolkits has rarely been evaluated and the configurations of simulations are often oversimplified in the literature. It may critically question the findings derived from simulation results. Even more badly, studies such
as [Velho et al. (2013)] have shown that basic predefined models in widely-used simulation
toolkits are flawed, which may lead to a false estimation of the simulated metrics.
In this context, the main challenge addressed by this thesis is to improve the realism of simulations targeting the execution of applications with a focus on file transfers on
EGI. EGI is one of the largest production DCIs worldwide providing more than 850,000 logical CPUs and 650 PB of disk space in 2018. We evaluate the realism of our simulations based on the ground truth provided by the execution traces offered by VIP, which is a scientific gateway hosting more than 20 medical imaging applications with more than 1,000 registered users.
One possible usage of these simulations is to evaluate file management strategies for applications deployed on large DCIs. In this work, for example, we will use them to
Acronyms
propose reliable recommendations for data placement in VIP. The rest of the manuscript is organized as follows:
Chapter 1 presents the related work and current status in the field of distributed computing, including the existing infrastructures, the deployment of applications on tributed production infrastructures, the simulation tools for studying applications in dis-tributed environments, and the optimization techniques for these applications. Among the numerous optimization strategies for applications in distributed environments, we will focus on file replication which is a widely used technique to optimize the file management.
Chapter 2 presents a thorough analysis of real execution traces of one particular application deployed on EGI. It helps us to derive the network characteristics of the un-derlying infrastructure and the information on file transfers during the executions of the application. Several issues related to the performance of file transfers are also identified, which allows us to propose relevant optimization to improve file management.
Chapter 3 presents our work to build a realistic simulator to provide a simulated environment as close as possible to the real execution conditions for file transfers during the execution of application deployed on largeDCIs. We first identify several fundamental components for file transfers from the real system. Then the choice of simulation tools and the implementation design of the simulator are driven by our concern for the realism in simulated file transfers. This simulator is used to validate our proposed platform model in Chapter 4and to evaluate file management strategies in Chapter 6.
Chapter 4. In this chapter, we build realistic ad-hoc platform models to replay the executions of the Geant4 Application for Tomographic Emission (GATE) onEGI. Starting from a simplified but widely used platform model, we propose incremental improvements to increase the accuracy of our file transfer simulations thanks to a thorough analysis of trace contents in Chapter2. The overall improvement of these ad-hoc models is evaluated by confronting simulation results to the ground truth of actual executions registered in the execution traces. The work presented in this chapter were presented in the CCGrid conference [Chai et al. (2017)].
Chapter 5 presents our method to construct a complete platform description beyond the ad-hoc models proposed in Chapter4by aggregating multiple execution traces. Three predictive models are also proposed and evaluated to fill-in the bandwidth of missing links in the platform after the trace aggregation.
Chapter 6. In this chapter, we cross-evaluate different file management strategies for applications executed in a large DCI by simulations using an enhanced state-of-the-art platform description and the complete platform description built in Chapter 5. Reliable recommendations for improving file management are also derived from simulation results. Results presented in this chapter were presented at HeteroPar workshop in the Euro-Par conference [Chai et al. (2018)]. An extension of this work is in preparation for a journal.
Chapter 1
State-of-the-art
Abstract This chapter presents the state-of-the art in the field of distributed comput-ing, including the underlying infrastructures, the deployment of applications on distributed production infrastructures, the simulation tools for studying applications in distributed en-vironments, and the optimization techniques for these applications. Among the numerous optimization strategies for applications in distributed environments, we focus on file repli-cation which is a widely used technique to optimize data management.
1.1
Introduction
Large distributed computing infrastructures have been successfully used to support heavy scientific experiments [Fernandez et al. (2012),Bird et al. (2014),Barisits et al.
(2017)] over the last decade. Different infrastructures are presented in Section1.2,
includ-ing a specific classification for these large distributed infrastructures. In Section 1.3, we discuss different aspects of applications deployed on such infrastructures, including science gateways, scientific workflows, execution traces, and optimization strategies.
In section 1.4, we focus on file replication, which is a widely used technique to opti-mize data management in large distributed environments. We first present two common classification strategies for numerous file replication methods in the literature. Then we summarize several requirements for applying file replication in production systems. Fi-nally, we investigate several replication strategies implemented for production usages.
Different simulation toolkits and platform models for evaluating file replication are discussed in section 1.5.
1.2
Distributed computing infrastructures
A distributed system is defined as a collection of heterogeneous networked comput-ers which are combined and coordinated to achieve a common goal. Based on different
concepts, models, and technologies, distributed systems can be divided into different cat-egories. Here, the infrastructures of two popular distributed systems are presented: Grid computing and Cloud computing.
1.2.1 Grid computing
Grid computing [Foster et al. (2001)] originated in academia in the mid 1990s with the popularity of the Internet and the availability of powerful computers and high-speed net-work technologies. It aimed at facilitating users to remotely utilize idle computing power within other computing centers when the local one is busy. One of the main strategies of grid computing is to use middleware to divide and apportion pieces of a program among several computers. The size of a grid may vary from computer workstations coordinated by network to large collaborations across many computing sites and data centers in different continents.
We can categorize grids into research and production infrastructures. Research infras-tructures are experimental testbeds designed to conduct controllable experiments, usually in academia. Examples of such infrastructures are Emulab [Siaterlis et al. (2013)], Planet-Lab [Kim et al. (2011)], Grid’5000 [Balouek et al. (2012)], and Future Grid [Von Laszewski
et al. (2010)]. Production infrastructures, on the other hand, are operating platforms pro-viding various services to support computing and data sharing for production purposes twenty four hours a day.
Grids can be further classified into High Performance Computing (HPC) and High Throughput Computing (HTC) infrastructures. HPC systems focus on the efficient exe-cution of tightly-coupled tasks, while HTC systems focus on the efficient exeexe-cution of a large number of independent tasks.
The Extreme Science and Engineering Digital Environment (XSEDE) [Towns et al.
(2014)] and the Partnership for Advanced Computing in Europe (PRACE) [prace project]
are the main HPC infrastructures in production. XSEDE is a single virtual system that scientists can use to interactively share computing resources, data, and expertise. A wide range of software is available on various XSEDE resources supporting diverse fields of study. PRACE aims at developing a distributed HPC infrastructure based on the national supercomputing centers in Europe.
The Open Science Grid (OSG) [Juve et al. (2013)] is a production grid used in the United States. It consists of computing and storage elements at over 100 individual sites spanning the United States. In Europe, one of the largest HTC production infrastructures is the EGI e-infrastructure [Kranzlmuller (2009)], which provides advanced computing services for research and innovation. EGI coordinates computing, storage, and network resources over 350 resource centers across more than 50 countries. In EGI, a set of comput-ing resources (e.g., clusters, workstations, etc.) localized at a site is defined as a Computcomput-ing
1.3. APPLICATION DEPLOYMENT IN DISTRIBUTED SYSTEMS
Element (CE) while aStorage Element (SE)provides uniform access to a set of data stor-age resources grouped together. In general, each CE defines a local SE which is either within or very close to the site. EGI currently hosts more than 200 Virtual Organiza-tions (VOs)for communities with interests as diverse as Earth Science, Computer Science, Mathematics, Life Sciences, or High-Energy Physics. It provides more than 850,000 logical CPUs and 650 PB of disk space in 2018.
1.2.2 Cloud computing
In the last decade, cloud computing has become a buzzword. However, cloud computing is not a completely new concept. It is a specialized distributed computing paradigm and has intricate connections to grid computing. One definition for cloud computing can be found in [Foster et al. (2008)]:
A large-scale distributed computing paradigm that is driven by economies of scale, in which a pool of abstracted, virtualized, dynamically-scalable, managed computing power, storage, platforms, and services are delivered on demand to external customers over the Internet.
A more detailed comparison between cloud and grid computing can be found in [Foster
et al. (2008),Sadashiv and Kumar (2011)].
Similar to grid computing, cloud computing systems can be also categorized into pro-duction and research infrastructures. The Amazon Elastic Compute Cloud (EC2) [amazon ec2] is currently the most used cloud computing infrastructure. It provides Infrastructure as a Service (IaaS) at a scale that can accommodate different distributed production in-frastructures. It also enables users to increase or reduce the number of virtual machines needed and charges them according to the size of the instances and the capacity used. Other commercial cloud computing infrastructures in production can be found in indus-try, e.g., Windows Azure cloud computing platform [windows azure] and Google Cloud platform [google cloud].
Cloud testbeds are also constructed for research purposes. A few examples of such infrastructures are the Virtual Computing Lab (VCL) [Averitt et al. (2007)], the Open Cloud testbed [Grossman et al. (2009)], the OpenCirrus [Avetisyan et al. (2010)], and the Chameleon cloud testbed [Mambretti et al. (2015)]. They enable researchers to test or validate new designs for cloud computing in controllable environments.
1.3
Application deployment in distributed systems
Although distributed computing infrastructures provide large amounts of computing and storage capacities, using them can sometimes be a complex work for scientists and
researchers. In this context, science gateways are emerging as high-level interfaces for users to facilitate the access to distributed infrastructures. One of their main features is allowing users to describe applications as abstract workflows. In this section, we present the state-of-the-art of existing science gateways and different widely used workflow models.
1.3.1 Science gateways
The concept of a science gateway is a community-specific set of tools, applications, and data collections that are integrated together via a web portal or a suite of applications, providing access to the computing and storage resources of different infrastructures. It combines a set of services, e.g., authentication, file transfer, and workload management tools, to deliver computing power as transparently as possible. Its responsibilities con-sist in monitoring the status of running experiments, killing misbehaving executions, and taking decisions to optimize the performance of applications on behalf of users. Science-gateways can be found in various scientific domains, such as climate, life-science, and medical imaging.
The Community Climate System Model (CCSM) portal [Zhao et al. (2010)a] provides a one-stop shop for creating, configuring, and running CCSM simulations as well as man-aging jobs and processing output data by using TeraGrid high performance computing resources. CIPRES [Miller et al. (2015)] is a web portal designed to provide researchers with transparent access to the fastest available community codes for inference of phyloge-netic relationships. It allows more than 1,800 unique users to run jobs that required 2.5 million CPU hours. In the life-science field, WeNMR [Wassenaar et al. (2012)] is devel-oped for bio-informatics applications. With over 450 registered users, WeNMR is one of the largestVOin the life-science community officially recognized by EGI.
VIP [Glatard et al. (2013)] is a widely used science gateway in the field of medical
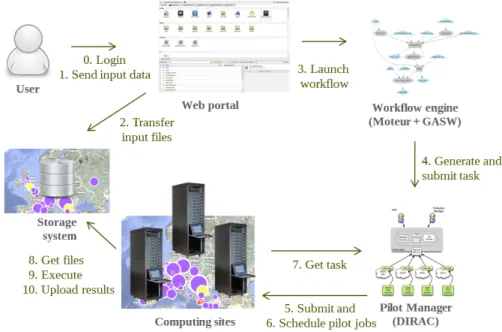
imaging. It currently hosts more than 20 medical imaging applications with more than 1,000 registered users. VIP is supported by the Biomed VO of EGI, which has access to about 65 computing sites world-wide, including more than 130 computing clusters and 5PB of storage distributed across 50 different SEs. The complete life cycle for the execution of an application in VIP is depicted in Figure1.1. From the web portal, users are authenticated by their login and password (step 0). They can easily upload their input data onto the storage resources in the Biomed VO via VIP (step 1) and select the application that they want to execute (step 3). Each application integrated into VIP is described as a workflow. The workflow description is interpreted by the MOTEUR [Glatard et al.
(2008)] workflow engine to generate jobs (step 4) that are submitted and scheduled to
EGI by the DIRAC [Tsaregorodtsev et al. (2010)] workload management system (step 5-7). When the required resources are allocated, jobs will first download input files for the application and then execute the computing workload (step 8-9). After the execution,
1.3. APPLICATION DEPLOYMENT IN DISTRIBUTED SYSTEMS
results are automatically stored on a storage resource (step 10) and made available to VIP users through the web portal.
Figure 1.1: The complete life cycle for an application executed via VIP.
1.3.2 Scientific workflows
Applications deployed on large distributed infrastructures via science gateways are usually expressed as workflows. Scientific workflows are often abstracted as a Directed Acyclic Graph (DAG)to combine a series of phases, including data movement, analysis, computation, and final result combination. In DAG-based workflows, nodes represent computational jobs and edges represent data or logical dependencies between jobs.
For scientific workflows, different models exist depending on the design concept and the purposes of applications. Some basic structures or common components of them are illustrated in Figure1.2. The simplest process for a workflow is a job analyzing input data and producing a result. This process can then be used as a basic component to construct a pipeline model, where each job requires the output data of its previous job to obtain the final result. Then depending on whether the workflow scatters or gathers data, we can distinguish three more basic models: data distribution model, data aggregation model, and data redistribution model.
In VIP, several workflows correspond to simple processes. This is the case for cer-tain neuroimaging tools based on FSL [Smith et al.] and Freesurfer [Fischl (2012)], as well as for some tools developed at the CREATIS research lab, such as "RF Coil Char-acterization" 1 or "Super Resolution" [Van Reeth et al. (2015)]. Nevertheless, some VIP
1https://vip.creatis.insa-lyon.fr/documentation/mri_charact.html
Figure 1.2: Common components in scientific workflows. Figure extracted from [Bharathi
et al. (2008)].
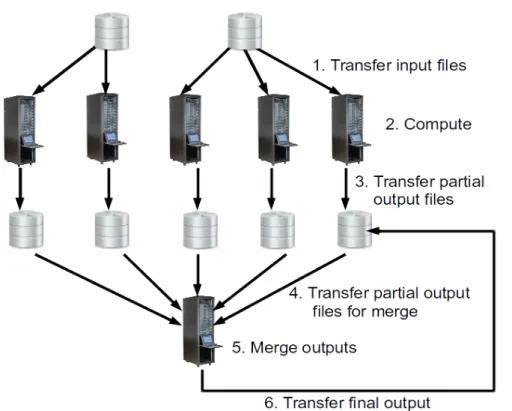
applications are described with complex workflow models, allowing to manage data dis-tribution, aggregation, loops and conditions. This is the case for the workflow describing the GATE application [Jan et al. (2004)]. GATE is a Geant4-based open-source software to perform nuclear medicine simulations, especially for TEP and SPECT imaging, as well for radiation therapy. As a Monte-Carlo simulator, one GATE execution can be easily split into multiple jobs. Each job produces a partial result, which is then merged into a final output. Therefore, the GATE workflow is a combination of the process and the data aggregation model. The GATE workflow can be deployed on EGI by two possible approaches: static and dynamic partitioning. The number of jobs for each execution will adapt to the computing duration estimated by users.
In this thesis, we will focus on the workflow of the GATE application, which is one of the most successful applications in VIP. More detail of the deployment of GATE workflow on EGI will be presented in Chapter 2.
1.3.3 Traces of workflow executions
During the execution of scientific workflows, diverse real-time metrics are monitored and registered by science gateways. These metrics are then generated and stored as ex-ecution traces. Such exex-ecution traces are important data sources for conducting off-line research work. They provide researchers rich information on the executed jobs to identify the characteristics of workflows, the computing and network resources to model the un-derlying platforms, and the resource utilization to investigate failure causes or predict the performance of workflow executions.
Numerous research works in distributed environments were based on trace analysis. For instance, authors in [Barisits et al. (2016)] proposed a hybrid simulation model for data grids based on the statistical analysis of traces. [Ferreira da Silva et al. (2015)] presented a practical machine learning method to predict job characteristics by conducting an analysis on workload traces. Authors in [Reiss et al. (2012)] studied the heterogeneity
1.3. APPLICATION DEPLOYMENT IN DISTRIBUTED SYSTEMS
and the dynamicity of the resource usage of Cloud by analyzing publicly available Google trace data. These traces consists of the monitored execution of applications over a month executed in ∼12,000 machine clusters. In [Iosup et al. (2011)], authors analyzed long-term performance traces from the two largest commercial clouds: Amazon cloud and Google cloud. They found that yearly and daily patterns were followed by half of the cloud services and the impact of the observed variability was assessed by trace-based simulation.
In [Javadi et al. (2013)], a failure trace archive was created and a comparative analysis
of failures in various distributed systems was presented. Authors also emphasized that different interpretations of the meaning of failure data can lead to different conclusions for failure modeling and job scheduling in distributed systems.
In this thesis, we also adopt the trace-analyzing method. The execution traces gener-ated by VIP are collected to study the GATE application executed on EGI. By analyzing these traces, we are able to characterize file transfers, to model the hardware platform for the Biomed VO in EGI, and to identify the current issues for the application performance or the resource usages in VIP. The analysis of execution traces of the GATE application will be presented in Chapter2.
1.3.4 Optimization of workflow execution
Large production distributed infrastructures, which coordinate large amounts of ge-ographically distributed resources, can be more prone to errors than traditional HPC clusters or experimental testbeds [Montagnat et al. (2010),Alsoghayer and Djemame
(2014),Carrión et al. (2015)]. In [Kondo et al. (2010)], authors report that Grids have
a yearly resource availability of 70% or less. In [Ma et al. (2013)], authors mention that
EGI has an average availability and reliability ranging from 84% to 96% for resources. It implies that improving the reliability of applications is as important as improving the performance and that the reliability is directly relevant to the performance of applications executed in production grids [Iosup et al. (2006)].
Different aspects of applications deployed on distributed environments can be opti-mized to improve the performance, to consolidate the reliability of workflow executions, or both. At application level, optimizations often concern two aspects: jobs and data.
Numerous strategies were proposed to provide fault tolerance for jobs, for instance, job checkpointing [Nazir et al. (2009),Chtepen et al. (2009),Cao et al. (2010),Amoon (2013)] and job replication [Ben-Yehuda et al. (2012),Calheiros and Buyya (2014),Poola et al.
(2016)]. Checkpointing is a mechanism allowing to save the state of a running job so that
the job can be resumed from the registered state in case of any fault. It prevents restarting the execution of applications from the very beginning and therefore can reduce the whole execution time of applications. Job replication consists in dispatching multiple replicas of a job across different resources and using the result from the first instance to complete.
Job replication is based on the assumption that the probability of a single resource failure is much higher than that of a simultaneous failure of multiple resources in distributed systems. It can thus achieve good performance even in the absence of information on computing resources.
Meanwhile, file replication [Vrbsky et al. (2010),Yang et al. (2010),Bsoul et al.
(2011),Andronikou et al. (2012),Chettaoui and Charrada (2014)] is the most widely used
technique to optimize data management in distributed systems. It consists in replicating the same file on different storage resources. This allows to avoid one-point failure of data, thereby increasing data availability and fault tolerance. It can also ease the file transfer burden on the network between one computing site and one storage resource, therefore reducing data access latency and file transfer duration.
The optimization of jobs for applications deployed on EGI via VIP has already been studied and investigated. Authors proposed a self-healing mechanism to handle operational incidents through job replication in [Da Silva et al. (2013)]. The added value of adopting checkpointing in workflow executions has been evaluated by conducting real experiments
on EGIin [Camarasu-Pop et al. (2013)c]. Following these works, we focus in this thesis
on improving the data management for applications in VIP by file replication.
1.4
File replication
File management is a key component in large distributed environments. Efficient file transfers are critical to the performance of data-intensive applications, since a long file transfer may badly delay a given job during the execution of a workflow, change the schedule of subsequent jobs, and therefore impact the whole application execution time. Numerous file replication strategies were proposed to optimize file management in dis-tributed systems and their implementations vastly vary depending on their optimizing metrics.
1.4.1 Classification for file replication
While replication strategies can be quite different, they have common features with respect to certain aspects. Different classification schemes for replication strategies were proposed in the literature.
Static vs. dynamic replication
The most general classification is static versus dynamic replication. In static replica-tion [Ranganathan and Foster (2003),Loukopoulos and Ahmad (2004),Chervenak et al.
(2007),Xiong et al. (2013)], decisions regarding to the replication strategy are made before
1.4. FILE REPLICATION
not add any decision and management overhead during the execution of applications and it can be a good choice for non-changing environments as static replication strategies are usually simple to implement. However, they are often inefficient in a dynamic environment such as large production grids.
On the other hand, decisions in dynamic replication [Chang and Chang (2008),
Hanan-deh et al. (2012),Mansouri and Dastghaibyfard (2013)b,Vashisht et al. (2014)] would
adapt to changes of systems, e.g., storage capacity or network bandwidth. Replicas can be created on new nodes during the execution of an application and can be deleted when they are no longer required. Dynamic replication strategies often rely on information obtained at runtime, hence adding an extra overhead to the application execution time.
Centralized vs. decentralized replication
Another classification scheme for replication strategies is centralized versus decen-tralized. For centralized strategies [Wu et al. (2008),Pérez et al. (2010),Zhao et al.
(2010)b,Sashi and Thanamani (2011),Andronikou et al. (2012)], a central authority is
implemented to control all the aspects of data replication. It collects global metrics on the underlying systems and then propagates these information to different nodes. However, this central authority can easily become a single point of failure and a bottleneck when systems scale up.
In decentralized replication strategies [Abdullah et al. (2008),Mansouri and
Dast-ghaibyfard (2012),Mansouri and Dastghaibyfard (2013)a,Chettaoui and Charrada (2014)],
there is no central control mechanism. Hence, no single node can possess a complete view about the entirety of systems. Nodes need to take their own decisions regarding to repli-cation. Decentralized replication is good for reliability and scalability as there is no single point of failure in the system but it may lead to excessive replications as no global infor-mation about the systems is monitored.
1.4.2 Requirements for file replication in production
Although numerous file replication strategies were proposed in the literature, they are rarely applied and implemented in real production infrastructures. Authors have already highlighted the gap between theoretical research and the implementation of replication strategies in production in [Ma et al. (2013)]. We summarize several restrictions hampering the integration of replication strategies, especially the automated and dynamic replication strategies, in large distributed production infrastructures.
Diverse requirements. Large production distributed infrastructures often support
the execution of applications from diverse scientific fields. For instance,EGIdistinguishes more than 200VOsfor communities with interests as diverse as Earth Science, Computer
Science, Mathematics, Life Sciences, or High-Energy Physics. Each community has its different applications with different characteristics and file access patterns. It is thus very difficult to provide a general and efficient file replication method to meet the requirements of all applications or users at the middleware level. Hence, most of the replication man-agement is delegated to applications and most decisions are made by administrators or applications with an application-oriented strategy.
Non-clairvoyance. The information about where jobs will be executed, what is the current usage of storage resources, or the network throughput cannot (or are very hard to) be foreseen before execution time in production infrastructures. However, most theoretical works assume a complete clairvoyance about compute, storage, and network resources in the proposed strategies. At the application/user level, the middleware is considered as a black-box and only services at application-level are available to users. Even though certain services allow users to collect and monitor the resource usages in production infrastructures, it will add large extra overhead to the execution time of applications if the replication decisions strongly depend on such real-time information. Therefore, an applicable file replication strategy for production infrastructures should rely on as few information as possible about the system (e.g., network throughput, job queuing time, job execution time, etc.).
Replication cost. In large production infrastructures, storage resources are often
shared by different groups of users and the available space is limited for each group. The number of replicas is thus limited for a given file [Ramakrishnan et al. (2007)]. However, most theoretical works only focus on reducing the file access time in order to increase the performance of file transfers. As a consequence, many theoretical studies favor strategies that always replicate [Ranganathan et al. (2002),Doğan (2009)] or create as many replicas as possible [Park et al. (2003),Sashi and Thanamani (2011)]. It badly questions the appli-cability of these strategies in production. Another cost related to increasing the number of replicas is the potential risk of increasing uncertainty and inability for the execution of an application, since large distributed production systems are prone to failures. A brittleness entropy metric was introduced in [Ma et al. (2015)] to describe the risk associated to file replication on unreliable SEs. Results show that limiting the number of storage elements involved in the execution of an application improves the execution reliability on EGI. Therefore, an applicable replication strategy should also take into account the replication costs by limiting the number of replicas.
1.4.3 Existing replication management in production systems
In this section, in addition to the replication management implemented in VIP, we investigate two other replication strategies that are adopted for production usage in large distributed infrastructures.
1.4. FILE REPLICATION
Replication in Pegasus
Pegasus [Deelman et al. (2015)] is a workflow management system, which enables user to map abstract workflow descriptions onto large distributed computing infrastructures. It also offers data management and job monitoring subsystems for workflow executions. In Pegasus, different data management services are proposed depending on the target cyber-infrastructures on which to execute workflows. Here, we only focus on the replication services provided by the data management system in Pegasus for computing grids.
Pegasus assumes that the datasets required by workflows have already been distributed across the infrastructure and the replica locations are registered in a Replica Catalog. Hence, no additional services related to replica creation are provided. Before the execution of a workflow, each job is explicitly mapped to the candidate execution sites specified by the user. This process is called Site Selection in Pegasus. Several site selection strategies are supported in Pegasus, for instance, random, round-robin, or Heterogeneous Earliest Finish Time (HEFT) [Topcuoglu et al. (2002)]. After this site selection process, Pegasus will have the complete information about where jobs will be mapped before the execution. It thus enables a special job (called stage-in job) to transfer the datasets required by the workflow from the locations specified in the Replica Catalog to storage resources close to the execution sites. If multiple locations are available for the same dataset, a variety of replica selection strategies are offered by Pegasus such as preferring the location that has a good bandwidth to the execution site, randomly selecting a replica, or using a user provided ranking. Due to site selection and data stage-in, jobs do not need to download the required files from remote sites during the execution, which can reduce the execution time of workflows.
Replication in Rucio
Rucio [Garonne et al. (2014)] is a distributed data management system implemented to support the ATLAS experiment [Aad et al. (2008)] which is one of the largest experiments at the Large Hadron Collider (LHC) at the European Organization for Nuclear Research (CERN). It manages the data produced by ATLAS with more than 150 Petabytes spread worldwide across 130 sites and provides users with the functionalities for data placement, data replication, and data deletion.
Replica creation in Rucio is based on user-defined replication rules for files. A repli-cation rule may define the minimum number of replicas to be available on a list of SEs. It allows users to express their intention behind the replication request instead of defining a specific destination for replicating data. For instance, a user can replicate a file two times in France by defining a rule such as "copies=2&country=fr". Rucio will then select the appropriate two SEsin France depending on the current resource usages, such as the
available storage spaces or network bandwidth. Users can also associate a weight toSEsso the replica selection algorithm will choose the SE with respect to this value. Rucio offers various functionalities to ease the creation of file replicas. However, the decision of where to replicate is still the responsibility of users.
This rule-based replica creation strategy enables to spread data over the system to make them available for users. Besides this static strategy, a dynamic data placement strategy has recently been proposed and tested in a pre-production mode for ATLAS [Beermann
et al. (2017)]. In this strategy, information from different sources are collected to decide if and where to create a new replica, e.g., the current available replicas for a given file from the Rucio database, bandwidth information from perfSonar [Tierney et al. (2009)], and file popularity (i.e., the daily access numbers for a file). This dynamic strategy consists in two main phases: deciding whether to create a new replica and where to create. The decision process for whether creating a new replica for a given file is described below:
• Check if a replica has already been created for this file in the past 24 hours. If yes, no new replica will be created; otherwise, continue.
• Check how many replicas already exist. If more than 4, no new replica; otherwise, continue.
• Check the popularity of the file in the last 7 days. If it has not been popular (i.e., the number of accesses is lower than a configurable threshold), no new replica; otherwise, create a new replica.
If all the requirements are met by the target file, a new replica will be created. The decision about where to replicate is based on site ranking:
• Check the network bandwidth for links between sites having existing replica and other sites.
• The possible destination sites are ranked based on available storage space, band-width, and the number of queuing transfer requests.
• Sites are down-ranked if a replica has been recently created there.
Then a new replica will be created for the site with highest rank if it has enough storage space for the target file. Recent results [Maier et al. (2018)] have shown that adopting this dynamic strategy can improve the data availability and lead to a better usage of the available disk space. Moreover, the completion time of a fraction of jobs is reduced after adopting this dynamic strategy.
1.5. SIMULATION
Replication in VIP
On EGI, the Unified Middleware Distribution (UMD) [David et al. (2014)] is an integrated set of software components packaged for deployment as production services. Among them, the data management services allow users to upload files onto a SE, then replicate and register them in a File Catalog. However, the decisions about where to replicate files and how many replicas to create are left to the applications (users). During the execution of an application, jobs can use the replica selection service offered by the UMD to select file replicas according to their distance to the computing site, of which the algorithm will be detailed in Chapter3.
The replica creation strategy currently implemented in VIP adopts a static strategy. The required data for a given application are asynchronously replicated to several remote sites before the application execution. This process is named file prestaging, which have been demonstrated to significantly reduce the execution time of applications deployed on large distributed infrastructures [Ranganathan and Foster (2003),Chervenak et al.
(2007)]. However, the decision of where to prestage files relies on the experience and
a priori knowledge of its administrators. For most of applications hosted by VIP, input files are automatically replicated to a static predefined list of 3 to 5 SEs chosen among the ones considered as stable, with a general good network connectivity, and sufficiently large amounts of available storage space (generally at least 500 GB). This list is updated when one of the SEs needs to be replaced, is in downtime, is full, or faces any other issue preventing its usage. The number of replicas also varies depending on the type and size of the files. Files larger than 500MB are usually replicated on the most available SEs.
1.5
Simulation
Large distributed infrastructures, such as Grids and Clouds, are complex, dynamic, and heterogeneous environments. Therefore, it is difficult to evaluate new prototypes or new strategies (e.g., scheduling algorithms or data management strategies) in a repeatable and controlled manner. Besides, a full-scale evaluation by real experiences implies inter-ference with on-going executions, which is not encouraged in a production environment. Simulation is thus mandatory to test and evaluate complex scenarios for large distributed production infrastructures.
1.5.1 Simulation tools
Many simulators have been developed in the era of Grids construction. They helped researchers to test the performance of the design of middleware services, evaluate job scheduling algorithms, or assess new data management strategies. For instance,
Sim [Bell et al. (2003)] and ChicSim [Ranganathan and Foster (2002)] were designed to study file replication. In ChicSim, a grid model with 30 sites and two theoretical band-width values were used, while a model of The European DataGrid Testbed was adopted in OptorSim, which is shown in Figure 1.3. However, the development of both projects has been discontinued.
Figure 1.3: Grid model in OptorSim, illustrated from [Bell et al. (2003)].
SimGrid [Casanova et al. (2014)] and GridSim [Buyya et al. (2011)] are two simulation toolkits widely used in grid computing research. GridSim is a Java-based discrete-event simulation toolkit based on SimJava [Howell and McNab (1998)]. It offers the modeling of heterogeneous computational resources, different policies for job scheduling (e.g., time or space shared policy), and different network services. A variable size packet-level model is used for network communications. However, this packet-level model in GridSim has been shown to be false and inaccurate [Velho et al. (2013)].
The SimGrid toolkit provides various core functionalities for simulating distributed applications in heterogeneous distributed environments. It is based on fast and accurate fluid models for simulating network communication. This toolkit has been continuously developed for about 20 years. Storage simulation capacities [Lebre et al. (2015)] have been recently integrated into SimGrid. Besides, the validity of its analytical models was