HAL Id: cea-01797038
https://hal-cea.archives-ouvertes.fr/cea-01797038
Submitted on 12 Jun 2018HAL is a multi-disciplinary open access archive for the deposit and dissemination of sci-entific research documents, whether they are pub-lished or not. The documents may come from teaching and research institutions in France or abroad, or from public or private research centers.
L’archive ouverte pluridisciplinaire HAL, est destinée au dépôt et à la diffusion de documents scientifiques de niveau recherche, publiés ou non, émanant des établissements d’enseignement et de recherche français ou étrangers, des laboratoires publics ou privés.
Reversible assembly of a drug peptide into amyloid
fibrils: a dynamic circular dichroism study
Frédéric Gobeaux, Frank Wien
To cite this version:
Frédéric Gobeaux, Frank Wien. Reversible assembly of a drug peptide into amyloid fibrils: a dy-namic circular dichroism study. Langmuir, American Chemical Society, 2018, 34, pp.7180-7191. �10.1021/acs.langmuir.8b00094�. �cea-01797038�
1
Reversible assembly of a drug peptide into amyloid fibrils:
a dynamic circular dichroism study
Frédéric Gobeaux1,*, Frank Wien2
1
LIONS - NIMBE CEA, CNRS, Université Paris-Saclay, CEA Saclay, 91191 Gif-sur-Yvette Cedex, France
2
SOLEIL Synchrotron, Saint Aubin, France *frederic.gobeaux@cea.fr
Abstract
The common view on the amyloid fibril formation is that it is a multistep process that involves many oligomeric intermediate species, which leads to a high degree of polymorphism. This view derives from numerous kinetic studies whose vast majority was carried out with amyloid β fragments or other pathological amyloidogenic sequences. Yet, it is not clear whether the mechanisms inferred from these studies are universal and also apply to functional amyloids, in particular to peptide hormones which form reversible amyloid structures. In the present work, we study the self-assembly properties of Atosiban, a nonapeptide drug whose sequence is very close to those of the oxytocin and vasopressin hormones. We show that this very soluble peptide consistently self-assembles into 7-nm wide amyloid fibrils above a critical aggregation concentration (2-10%w/w depending on the buffer conditions). The peptide system is characterized in details, from the monomeric to the assembled form, with osmotic concentration measurements, transmission electron microscopy, small angle x-ray scattering, infrared and fluorescence spectroscopy, and circular dichroism. We have followed in-situ the fibrils assembly with fluorescence and synchrotron radiation circular dichroism and noticed that the peptide undergoes conformational changes during the process. However, all evidences point towards the association of monomers and dimers into fibrils without passing through oligomeric intermediate species contrary to what is usually reported for pathogenic amyloids. The native β-hairpin conformation of the monomer could explain the straightforward assembly. The tyrosine stacking is also shown to play an important role.
2
Introduction
A large number of proteins and peptides form amyloid fibrils outside pathological context1,2 fulfilling a beneficial role.3–11 These so-called “functional amyloids” appear to be widespread in the biological realm as they have been discovered in plants12, fungi13, bacteria11 and mammals4,10,14 where they fulfill very diverse functions such as biofilm formation (curli)15, assisting spore dispersal and soil colonization (chaplins),16 formation of hydrophobic coating (hydrophobins)17, oocyte protection (chorion protein)18 or assisting melanin production (Pmel 17).10 While most of these fibrils fulfill functions that require stability, amyloid fibrils formed from peptide and protein hormones are reversible by feature. Indeed, they serve as reservoir to protect and store monomers before they are released as bioactive molecules.6,19,20 This feature can even be harnessed to formulate devices to slow-release drugs.21,22 Finally, in spite of their very similar molecular features, hormone and hormone-like peptide amyloid assemblies display very diverse morphologies, from fibrils to nanotubes of different diameters but also spherulites and microcrystals.23–28
The common view on the amyloid fibril formation is that it is a multistep process that involves many oligomeric intermediate species. This view derives from numerous kinetic studies whose vast majority was carried out with pathological and non-reversible systems such as insulin, calcitonin, or amyloid Aβ-(1-40) and Aβ-(1-42).29–40 Indeed, the monitoring of amyloid fibrillation kinetics exhibits a typical sigmoidal reaction time course, with three characteristics phases: a lag phase, a rapid growth (elongation) phase and finally a saturation phase. This behaviour has been linked to a nucleated polymerization mechanism.31,41,42 Furthermore, the conversion of soluble protein into nuclei during the lag phase appears to be tremendously complex and system-dependent. It often involves multiple parallel processes and a variety of metastable oligomers and results in a high degree of polymorphism.41,42 It is however not clear if the mechanisms inferred from these studies are universal. In particular, do they apply to the reversible amyloid structures found in dense-core vesicles of secretory cells, which enable the storage of neuropeptides and peptide hormones before they are secreted under their monomeric form? So far, only few studies have focused on the assembly dynamics of reversible functional amyloids; the most notable is by Pouget et al., who have explained in details the assembly mechanism of Lanreotide into amyloid-like nanotubes via dimer formation.43,44 More recently, Nespovitaya et al. have monitored the assembly and disassembly of β–endorphin amyloid fibrils by fluorescence spectroscopy in presence of multiple additives.45
3
Among the methods used to study amyloid fibrillation in vitro, circular dichroism has many advantages. Circular dichroism spectroscopy results from the differential absorption of left- and right-handed circular polarized light by optically active chiral molecules. It is rapid and easy to implement and allows reaching global structural information on the secondary structures of proteins and peptide. It is a very sensitive method that can track conformational changes during a process. It is particularly suited for proteins whose crystal structure is unknown and difficult to obtain such as membrane proteins46 and fibrillar systems.47 In the specific case of amyloid assembly it allows characterizing the conformation of the peptide in both monomeric and aggregated forms and thus monitoring the whole aggregation process.48 This feature is difficult to achieve for other methods, whether it is for lack of signal in the non-assembled state (Fourier-Transform Infrared spectroscopy (FTIR), Small Angle X-ray Scattering (SAXS)) or for saturation in the assembled state (dynamic light scattering, transmission electron microscopy (TEM)). Furthermore, by taking advantages of the high flux of synchrotron radiation, Synchrotron Radiation Circular Dichroism (SRCD) can significantly improve the conventional method.49–51 SRCD not only allows for improved signal-to-noise ratio and faster data acquisition, but it permits probing for highly absorbent samples and using much smaller volumes. Additionally, it extends the spectral range below 180 nm, which enables elucidating finer details in the secondary structure of proteins.52 It also allows collecting data in almost any solvent and buffer commonly used in biological studies. Nevertheless, despite all these assets, CD spectra are not always easy to interpret in detail and additional first principle calculations may be required to fully exploit experimental data.53 Complementary characterizations by TEM, SAXS, FTIR and fluorescence spectroscopy may also help interpreting CD spectra.
In this article, we exhibit the self-assembly features of the Atosiban nonapeptide, a synthetic antagonist to oxytocin, and we monitor the Atosiban fibrils formation by spectroscopic methods yielding information on the chemical functions involved in the assembly. Atosiban is an oxytocin antagonist developed by Ferring Pharmaceutical (Denmark) and marketed under the name Tractocile®.54 It is an inhibitor of oxytocin and vasopressin receptors and is administrated as an injectable solution to delay premature labor.55 The solution is clear, uncolored and without particles at concentration 7.5 mg/ml with acetate.56 As an oxytocin antagonist, the Atosiban molecule shares most of its features, including a disulfide bridge between the (modified) 3-mercaptopropanoic acid in position 1 the cysteine in position 6.57 The two main differences lie in the chemical modification of the
4
tyrosine residue and the replacement of the uncharged leucine residue by ornithine (Figure 1A & Supp Mat). The interest of gaining more knowledge on the assembly of such hormone-like peptide is twofold: first it can serve as a model system for understanding in vivo mechanisms and secondly it can bring helpful hints for pharmaceutical formulation. Indeed aggregation can be seen either as a problem to be avoided or as a feature to be harnessed to control drug release. In a first section, we define the physical-chemical formation conditions of the Atosiban fibrillar gels and characterize their structure with complementary techniques such as Transmission Electron Microscopy (TEM), Small Angle X-Ray Scattering (SAXS), Fourier-Transform Infrared spectroscopy (FTIR) and Synchrotron Radiation Circular Dichroism (SRCD). We show that they exhibit all the typical features of amyloid fibrils. The second section is devoted to the in situ monitoring of the fibrils assembly kinetics with both intrinsic and ThT-induced fluorescence and particularly with SRCD. Here, thanks to synchrotron radiations, SRCD enables the characterization of dense gels (up to 10%w/w) of an absorbing peptide with very small volumes (about 4 µL) as well as relatively diluted solutions (below 1%w/w). The role of aromatic residue is highlighted and we rule out the existence of intermediate oligomers during the assembly.
Figure 1 : A) Atosiban formula. B) Osmotic concentration of Atosiban solutions at concentrations below 100 mM (~9.5%w/w) in water. Open circles: experimental data points, black trace: “ideal” plot for a complete dissolution of
5
the Atosiban-acetate salt (slope = 2 mOsm/L/mM). Black trace: fit taking into account a monomer-dimer equilibrium. C) Respective proportions of Atosiban species in liquid solution as a function of concentration in the dimer hypothesis. Grey trace: monomeric form. Black trace: dimeric form. D) Osmotic concentration of Atosiban solutions solubilized in in NH4Ac 0.2 M, pH 9. Open circles: experimental data points, black trace: linear regression in the liquid phase
(y=2.06*x, R2=0.975). E) Picture of a 2.86 %w/w (27.4 mM) Atosiban gel in NH4Ac 0.2 M, pH 9.
Results and Discussion
A)
Morphological and structural characterization of Atosiban solutions
and hydrogels at equilibrium.
Atosiban-acetate salt is easily solubilized in any aqueous solution at concentrations up to 20% w/w. Below 9% w/w in pure water, solutions remain clear and liquid. Above a critical aggregation concentration which depends on the buffer used to solubilize the peptide salt, Atosiban salts form birefringent gels: while in water, PBS or NaOH Atosiban solutions become viscous and form a gel between 8-10%w/w, in ammonium acetate buffers strong gels form with only 2.5%w/w peptide. The critical aggregation concentration is thus clearly dependent on the buffer used.
Measurement of the osmotic concentration in the peptide solutions indicates the total concentration of solute per liter, independently of the solute nature and for solutions sufficiently diluted. We can thus evaluate the dissociation of the peptide salt and its aggregation. Here, plotting the osmotic concentration of peptide solutions as a function of their concentration in the liquid phase (Figure 1B) shows a seemingly linear trend (R2=0.996) with a slope of 1.7 mOsm/L/mM, which would indicate that the Atosiban-acetate salt fully dissociates in water in this range of concentration, since the dissolution of 1 mM of salt yields about 2 mM of solute (i.e. 2 mOsm/L). However, the plot can also be fitted with the assumption that there is a monomer ⇌ dimer equilibrium defined by a dissociation constant
Kd=[monomer]2/[dimer]. In this case, the osmotic concentration can be written as: π =
α*[monomer] + β*[dimer], which can be expressed as a function of the Atosiban
concentration (See reference for derivation58):
= ∗ − + + 8 ∗4 ∗ +
6
Using this equation, it is possible to fit the osmotic concentration plot with β and Kd as free
parameters (α was set to 2). The best fit is obtained obtain for β=3.1 and Kd=10.3 mM. The
parameter β≈3 is consistent with a dimer with two acetates. We have plotted in Figure 1D the respective proportion of each species derived from the dissociation constant as a function of Atosiban concentration. However, at this point, it is not possible to discriminate between the two hypotheses.
Typically, when reaching a critical aggregation concentration, there is a break of slope in the osmotic concentration plot. For example, when Atosiban is solubilized in a 0.2 M ammonium acetate buffer (pH 9)(Figure 1D), the pseudo-linear domain (slope = 2.1 mOsm.L-1.mM-1,
R2≈1 or Kd≈1.2 mM in the dimer hypothesis) corresponding to the liquid phase is very limited
and ends at 10 mM (~1.1%w/w) with a plateau whose starting point indicates the critical aggregation concentration. Above this concentration, any added molecule is incorporated in a supramolecular assembly in equilibrium with the monomers in the liquid phase, whose concentration remains fixed. Thus, the osmotic concentration is not increasing anymore. It is interesting to note that the counterions also seem to be incorporated in the supramolecular structure, otherwise an increase of osmotic concentration with a slope of 1 mOsm.L-1.mM-1 would be observed. This plateau corresponds to the concentration domain in which Atosiban solutions are still liquid but clearly viscous. A second break of slope is observed at 30 mM (~3.1%w/w), where the osmotic concentration suddenly increases. This transition corresponds to the formations of gels that can be visually assessed by placing Eppendorf tubes upside-down: then the solutions do not flow down (see Figure 1E). In this domain, the data are quite noisy and indeed, the osmotic concentration measurement might not be very reliable. However, the increase detected might indicate that part of the counterions that were previously bound to the supramolecular structures are released at some point but we will not speculate further on this aspect.
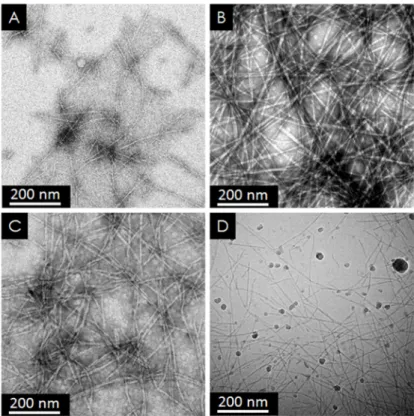
The observation of gels and viscous solutions with a transmission electron microscope reveals the morphology of the supramolecular objects in these solutions. They all contain fibrils with the typical features of amyloids: they are micron-long, unbranched, and their diameter is about 7±2 nm (Figure 2).
7
Figure 2 : Transmission electron micrographs of Atosiban fibrils prepared in acetic acid pH 5 (A), NaCl 150 mM pH~6 (B) and NaOH pH 13 at 10% concentrations (C-D). Panels A,B and C are conventional TEM images. Panel D is a cryo-TEM image.
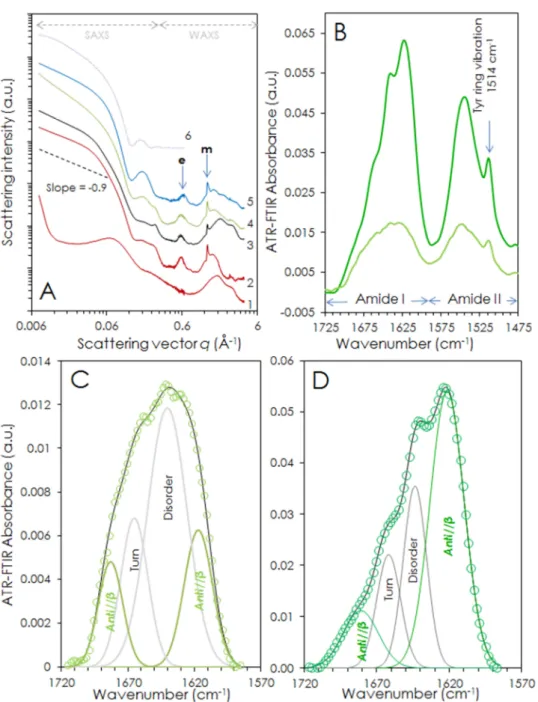
The nanostructure of these fibrils was characterized by small- and wide angle x-ray scattering (SAXS-WAXS). The SAXS-WAXS curves of 10%w/w gels in different pH ranging from 2.5 to 12 are presented in Figure 3A. At the lowest pH (curve 1) no sign of fibrillar assembly nor β-sheet structure are visible, although the scattering intensity increases towards the lowest wave vectors which might indicate that aggregates are nonetheless forming. Likewise, a broad peak is visible 0.0687 Å-1 which could be attributed to a 9-nm correlation distance in the solution. From pH 5 up to 12 (curves 2 to 5), SAXS-WAXS spectra share common features that can unambiguously be attributed to amyloid fibrils. The overall shape of the SAXS part can be reasonably fitted by the scattering of cylinders whose radius is 30 Å, which is in agreement with the TEM observations where 35±10 Å radius fibrils were found. In the WAXS part, reflections typical of amyloid structures in cross β-sheets are observed at 1.31 and 0.63 Å-1 corresponding to the 4.8 Å H-bond distance between the peptide backbones in the beta sheets (meridional reflection marked m) and to the 10.5 Å distance between two β-sheets (equatorial reflection marked e), respectively.
8
Figure 3 : A) SAXS-WAXS profiles of 10%w/w atosiban gels solubilized at different pH. 1) acetic acid pH 2.7; 2) acetic acid pH 5; 3) water (pH~6); 4) phosphate buffer saline (PBS) pH 7.4; 5) NaOH pH 12. The dotted purple curves corresponds is a fitted curve assuming a cylinder shape. “e” and “m” indicate the equatorial and meridional reflections. B) ATR-FTIR spectra of a liquid Atosiban solution (~5% in PBS, pale green trace) and of a gelified Atosiban solution (8% in PBS, dark green trace) after water subtraction and baseline correction. Both Amide I and Amide II bands are represented. C) Fit of the Amide I band of the liquid solution. Green circles: experimental data for Atosiban solubilized in PBS (~5%w/w). Black trace: fitted spectrum with Gaussian peaks decomposition (grey and green traces). D) Fit of the Amide I band of the gelified solution. Green circles: experimental data for Atosiban solubilized in PBS (~5%w/w). Black trace: fitted spectrum with Gaussian peaks decomposition (grey and green traces).
The peptide backbone conformation inside the fibrils and the intra- and inter-molecular hydrogen-bonding patterns is further assessed by ATR-FTIR, specifically by
9
inspecting the amide I band region. At low concentrations a liquid Atosiban solution exhibits a rather featureless spectrum (Figure 3B-C). Mature, dense gels exhibit a very structured amide I band (Figure 3B and Figure 3D). Additionally, a 1514 cm-1 sharp peak resulting from tyrosine ring vibrations59 consistently protrude from the amide II band in all the spectra recorded, regardless of the preparation conditions (Figure 3B). The amide I region can be deconvoluted with four Gaussian peaks by secondary derivative method. Two peaks at ~1620 and ~1680 cm-1 can be attributed to anti-parallel β-sheet structures. A peak at ~1640 cm-1 is usually attributed to disordered conformations. Finally, the peak at ~1662 cm-1 is due to a turn conformation in the backbone. Upon assembly, the proportion of disordered conformation decreases while that of antiparallel β-sheet increases indicating the formation of amyloid fibrils. The fact that the antiparallel β-sheet peaks are detected in the liquid phase (i.e. non-assembled state) – along with the turn peak – suggests that the Atosiban monomers adopt a β-hairpin conformation.
SRCD gives us another insight on the conformation of the peptide inside or outside the fibrils, the shape of CD spectra being indeed dictated by the backbone conformation and aromatic transitions.60–63 Figure 4A exhibits typical SRCD spectra obtained from liquid Atosiban solution solubilized in pure water at concentrations ranging from 1%w/w to 10%w/w. The spectra are characterized by three bands: a negative band at 200-210 nm and two positive bands at ~190 and 220 nm. The negative band at 200 nm is consistent with what is usually reported for disordered conformations.64,65 However, the absolute intensity of this peak decreases as concentration increases suggesting that the disordered fraction might be decreasing. Moreover, its minimum continuously shifts from 200 to 208 nm as concentration increases. The positive band at 220 nm is generally assigned to unordered polypeptide structures such as poly(Lys), poly(Glu) and poly(Pro) II66 but could also correspond to the presence of a β-turn that includes the proline residue, which is more likely here, especially considering the presence of the positive band at 190 nm.67 Since the spectra are normalized by peptide concentration, it is not expected that the spectrum intensity changes in the liquid phase if it was only composed of monomers. However, if we assume that there is an equilibrium between monomers and dimers characterized by a dissociation constant Kd =
[monomers]2/[dimers]. Using the value Kd=10.3 mM determined by fitting the osmotic
concentration measurement plot (Figure 1A-B), it is possible to estimate the relative proportion of each species in solutions (Figure 4B). It then clearly appears that below 3%w/w the monomers are the main species. However, at 5 and 10% w/w the dimers take over. This
10
would then explain the continuous change of the CD spectra. At 10%w/w some fibrils might even be present as indicated by the increase of the positive peak at 220 nm. Moreover, the shift toward higher wavelengths could be the sign of strong aromatic stacking in the system68, which could be the driving force behind the dimerization.
Figure 4C exhibits the spectra obtained from Atosiban solutions solubilized in 0.2 M PBS (pH 7.4) at concentrations ranging from 0.5%w/w to 7.9%w/w. The first three spectra (0.5-4.9%w/w) corresponding to liquid solutions exhibit similar spectra features as in water although no particular shift is observed and the absolute intensity of the negative peak increases with the concentration. This could be explained by the fact that we are not probing exactly the same part of the phase diagram (which on top of that is modified by the presence of phosphate ions). The last spectrum (thick bright green trace), corresponding to a gel solution (7.9%w/w) is truncated below 210 nm because of saturation of the dynode voltage (HT). However, this gel sample clearly contains fibrils to which we ascribe the shoulder appearing at 236 nm. At basic pH levels (NaOH 0.2 M, pH ~13) (Figure 4D), in the 1-10%w/w concentration range, fibrils are already formed. These spectra are now similar to what is typically reported for β-sheet secondary structures where a positive CD peak at ~195 nm is attributed to a π-π* transition and a negative peak at ~216 nm to a n-π* transition.62 Additionally, another negative peak is detected at 183 nm. Here again, the absolute intensities of the bands decrease with increasing concentration. Finally, a positive band whose intensity increases with peptide concentration appears at 238 nm. Both transitions at 183 and 238 nm might be attributable to the tyrosine contributions.69
11
Figure 4 : A) SRCD spectra of liquid solutions of Atosiban solubilized in pure water at 1%w/w (black line), 5%w/w (dark grey line) and 10%w/w (pale grey line). B) Theoretical plot of the monomer and dimer concentrations as a function of Atosiban concentration assuming a monomer dissociation constant Kd = 9.6 mM as determined by fitting
the somotic concentration measurement plot (Cf. Figure 1). The vertical dashed lines indicate the concentrations of the three spectra presented in panel A. C) SRCD spectra of Atosiban solutions solubilized in PBS 0.2 M (pH 7.4) at different concentrations. Solutions at 0.5, 2.1 and 4.9%w/w (thin green traces, getting darker as concentration increases) are liquid solutions while solution at 7.9% (thick bright green trace) is a gel. D) SRCD spectra of Atosiban solubilized in 0.2 M NaOH at 1, 5 and 10%w/w (from clear blue to dark blue). The spectra at 7.9 and 10%w/w are cut at the wavelength where the dynode voltage saturates.
We thus have recognizable signatures corresponding to solutions containing either mostly non-assembled peptides (either predominantly monomeric or dimeric) or assembled peptides (i.e. amyloid fibrils).
To complete our analysis and better appreciate the origin of the dichroic signal observed, we show in Figure 5 the absorbance of Atosiban solutions at different concentrations and pH levels. These spectra are mainly composed of three absorption bands at 194, 222 and 280 nm which are directly related to the presence of a (protected) tyrosine in the
12
Atosiban sequence as evidenced by the comparison with the absorption spectrum of L-tyrosine in water (Figure 5A). More specifically, the bands at 222 and 280 nm are arising respectively from the two first π→π* electronic transitions La and Lb whose dipole moments are in the plane of the tyrosine but perpendicular to each other.70 The absorption is particularly strong below 210 nm and the signal is even saturated in this range when the peptide solution reaches 10%w/w (See Supporting information, Figure S2). Interestingly, at a fixed concentration, the absorption peak at 194 nm decreases when pH increases, while the overall absorbance increases with pH above 210 nm. Moreover, the absorption band at 280 nm becomes a doublet (280 and 287 nm) in basic conditions, where the fibrils content is the highest (Figure 5B). This doublet also becomes sharper when the concentration increases (Figure 5C). This doublet is thus related to the formation of amyloid fibrils and hence the conformation of the tyrosine residue therein. According to Fornander et al.70, these structured vibrational peaks can be attributed to a rather fixed conformation but also to the disappearance of hydrogen bonds between tyrosine side chain and polar solvent (here: water molecules). This is a first clue that might indicate that the tyrosine group is buried in a hydrophobic environment in the fibrils, which we relate to their stacking.
In the following section we will further assess the role of tyrosine in the fibril assembly and monitor the assembly dynamics with both fluorescence and SRCD in situ studies.
Figure 5 : Absorbance spectra derived from the dynode voltage (HT). A) Full absorbance spectra of 5%w/w Atosiban solubilized in acetic acid pH 5 (red trace), water (black trace), PBS pH 7.4 (green trace) and NaOH 0.2 M pH 13 (blue trace) compared to that of L-tyrosine in water (grey trace). B) Close-up of the panel B in the 250-300 nm region. C) Absorbance spectra of Atosiban in NaOH at 1, 5 and 10%w/w (from bottom to top) in the 250-300 nm region (Lb transition).
13
B)
In situ fluorescence and SRCD monitoring of amyloid formation
The progressive assembly of Atosiban amyloid fibrils can be followed by steady state fluorescence measurements as a function of time. We have monitored both tyrosine autofluorescence and thioflavine T (ThT) fluorescence of 10% Atosiban solution freshly solubilized in ammonium acetate buffer (pH 9). The results are shown in Figure 6. The initial measurements exhibits two fluorescence emission peaks. When excited at 260 nm, the solution exhibits a fluorescence peak at 304 nm, corresponding to the intrinsic fluorescence of the tyrosine group.71 Here, the ethylation of the phenol group does not affect the tyrosine aromatic ring and does not seem to change the fluorescence properties. When excited at 440 nm, the solution exhibits a fluorescence peak at 480 nm, corresponding to the increased fluorescence of thioflavine T interacting with amyloids.72 The fluorescence intensity of the dye is indeed reportedly proportional to the mass of amyloid in solution.
14
Figure 6 : Assembly kinetics followed by steady-state fluorescence (10%w/w Atosiban solubilized in NH4Ac buffer pH
9). A) Tyrosine fluorescence emission as a function of time (excitation at 260 nm). The descending arrow indicates the evolution as a function of time. B) Thioflavin T fluorescence emission as a function of time (excitation at 440 nm). The ascending arrow indicates the evolution as a function of time. C) Plot of the maxima of fluorescence emission intensity at 304 nm (blue circles, excitation wavelength = 260 nm) and 480 nm (red diamonds, excitation wavelength = 440 nm) as a function of time after peptide solubilization in ThT/NH4Ac pH 9. D) Same plots as in D over full timescale (24
hours). E) Release profiles of pieces of Atosiban gels prepared in NH4Ac pH 9 immersed in 3 mL pure water
monitored by tyrosine fluorescence emission. Open circles: 3.3%w/w, open triangles: 4.1%w/w, open squares: 5.6%. Inset: pictures of the bottom of the cuvette at the beginning and the end of the monitoring. The black arrow indicates the piece of 3.3%w/w gel that has been completely solubilized in the last picture. In all the panels the continuous lines are the four-parameter logistic regressions.
15
When monitored as a function of time, the respective intensities of these two peaks evolve in opposite ways: while the intensity of the peak at 304 nm decreases, the intensity of the one at 480 nm increases. The increase of intensity of the ThT fluorescence at 480 nm indicates that the amount of amyloid fibrils is growing in the solution. The quenching of the tyrosine fluorescence at 304 nm indicates that tyrosine groups are directly involved in the process. Indeed, it is a well-known sign of stacking interactions71 and the protection of the phenol group ensures that the quenching is not due to deprotonation or H-bond formation of the tyrosine group. It is noteworthy that there is almost no lag phase and that the onset of amyloid formation occurs within a few minutes (Figure 6C). The tyrosine fluorescence quenching is concomitant to the ThT fluorescence rise, which suggests that the two processes might be cooperative. However, the tyrosine fluorescence emission reaches a plateau after two hours while the ThT fluorescence emission only stops increasing after more than ten hours (Figure 6D). This may give an insight into the mechanism of amyloid formation: it can be envisioned that first the peptide monomers quickly aggregate into short fibrils with imperfect β-sheets and then the fibrils mature into longer fibrils, richer in β-sheets.
Finally, the reversibility of the Atosiban assembly has been quickly tested by immersing 10 mg pieces of gel in a cuvette filled with 3 mL water (see inset Figure 6E) and monitoring the tyrosine fluorescence emission. Three release profiles of gels at respectively 3.3, 4.1 and 5.6%w/w are plotted in Figure 6E. For the lowest concentration, even without stirring, an increase of the fluorescence emission is immediately observed at 304 nm and a plateau is reached within 45 minutes. At the end of the monitoring, the gel piece has been completely solubilized (see inset Figure 6E). For the higher concentration tested, a lag phase of about 20 minutes is observed and the plateau is reached after 15h. However, visual inspection of the cuvette revealed that small pieces of gel remained in the solution which explains why the level of the plateau is not proportional to the initial concentration of the gel as expected for a full resolubilization. These release profiles suggest that the Atosiban fibril assembly is reversible upon dilution as hypothesized by analogy with other peptide hormones. These preliminary tests also indicate that the profile dynamics is highly dependent upon gel concentration (and hence parameters such as gel porosity or fibrils entanglement). Indeed, it appears that the position of the inflexion point of the sigma curve is proportional to the concentration of the gel while the Hill’s slope is steeper with low concentrations of the gel. These observations are rather intuitive since the denser a gel is, the longer it will take to
16
dissociate it. However, the details of the release kinetics would require a full study on its own while the present study focuses on the assembly mechanism.
We now look at the evolution of the secondary structure of the peptide during the assembly process with SRCD in situ monitoring. Indeed, since SRCD is able to yield a specific signal for each state of assembly, it is very sensitive to peptide conformation changes and we used it to monitor in situ the assembly Atosiban fibrils upon solubilization in ammonium acetate at both pH 5 and 9. The results for pH 9 are reported in Figure 7.
Figure 7 : A) In situ SRCD monitoring of the self-assembly of 5% Atosiban solubilized in NH4Ac pH 9. The first
spectrum is plotted in purple, the last one in black. B) SRCD spectrum of 1% Atosiban in NH4Ac (thick red trace)
compared with the first (purple dashed trace) and last (dotted black trace) SRCD spectrum of the assembly Kinetics at 5%. C) Comparison of the spectra of the solution assembled under the beam in the CaF2 cell (black trace) and of
the same solution assembled in an Eppendorf tube (red trace). The grey arrows indicate possible tyrosine exciton peaks.
The spectra, as presented in Figure 7A, evolve from typical disordered conformation spectra (purple trace and cold colors) towards typical β-sheet spectra (black trace and warm
17
colors): initially, the spectra exhibit a negative band at 200 nm and a positive band at 220 nm. Progressively, the absolute intensities of both bands decrease until the inversion of sign. Then, a positive band at 204 nm and a negative band at 219 nm whose absolute intensities increase appear. In the final spectra (from time > 100 minutes), another small peak appears at 236 nm. The existence of a least two isobestic points (at 192 and 210 nm) is indicative of an equilibrium between two coexisting species, i.e. Atosiban monomers/dimers and β-sheet-rich fibrils. To confirm this interpretation, we show in Figure 7B the SRCD spectrum of a liquid solution of 1%w/w Atosiban in NH4Ac pH 9 (thick red trace). This spectrum has similar
features to the first spectrum of the assembly kinetics (purple dashed trace), except for its intensity which is proportional to the concentration as already shown in Figure 4A. Interestingly, the negative band is similar in intensity with that of the final peak (black dashed trace), which suggests that the concentration in monomers in equilibrium with the fibrils is of the order of 1%. Figure 7C compares the spectrum of the control solution that has been left to self-assemble in an Eppendorf tube to the final spectrum of the assembly kinetics. The possible origins of the differences are discussed in the Supporting information (Section 6).
Figure 8 : A) Plot of the maxima of the SRCD spectra monitoring the Atosiban assembly in NH4Ac pH 9 as a function
of time. Continuous lines are four-parameter logistic regression of each plot. B) Plot of the secondary structure content estimated with the BeStSel software as a function of time. Continuous lines are four-parameter logistic regression of each plot. C) Tyrosine absorbance at the Lb transition as a function of time (the curves have not been shifted).
To better visualize the evolution of the spectra as a function of time, we have plotted the molar extinction (∆ε) at different wavelengths corresponding to the maxima and minima of the spectra as a function of time in Figure 8A. The plots are continuously changing and exhibit a sigmoidal shape with a very short lag phase. The analysis of the successive spectra with the BestSel software52 allows the quantification of the secondary structure contents as a
18
function of time as plotted in Figure 8B. The parallel and helix conformations are respectively absent or negligible (0-2%) and the turn conformation fraction remains rather constant (~15%) during the process. In spite of the spectral changes observed right from the beginning of the monitoring, this analysis does not evidence clear secondary conformational changes in the first 45 minutes of monitoring. The respective amount of antiparallel and disordered fractions are inversely proportional, which means that the disordered fraction is progressively changed into the antiparallel fraction as assembly proceeds, hence the isobestic points at 192 and 210 nm observed in Figure 7A. After 3h, near the end of the monitoring, both plots reach a plateau meaning that the solution is close to the final thermodynamic equilibrium. Initially, the antiparallel fraction is already ~30%, just as in the liquid solutions studied in the previous section. Near the final equilibrium, the antiparallel fraction is reaching ~75%. Conversely, the disordered fraction is ~50% at the beginning of the assembly and drops to ~15% in the end. If we approximate the disordered and antiparallel fractions to respectively the Atosiban monomers and the Atosiban amyloid fibrils and exclude the turn conformation which is shared by both species, we can estimate that the fraction of monomers and dimers that remain in equilibrium with the amyloid fibrils is about 15-20%. Normalized to the total peptide concentration of the solution (i.e. 5%w/w) we deduce that the Atosiban critical aggregation concentration in NH4Ac pH 9 is about 0.75-1%w/w which is coherent with other estimations
(notably through osmotic concentration measurements reported in 1D).
It is also noteworthy that the absorbance of the solution increases during assembly (Supporting information, Figure S3). The increase is particularly strong in the 250-300 nm region (Figure 8C) and comes with a peak structuration that we have interpreted as an increasing hydrophobic environment for the Tyrosine group in the fibrils (Cf. Figure 5 and corresponding commentary).
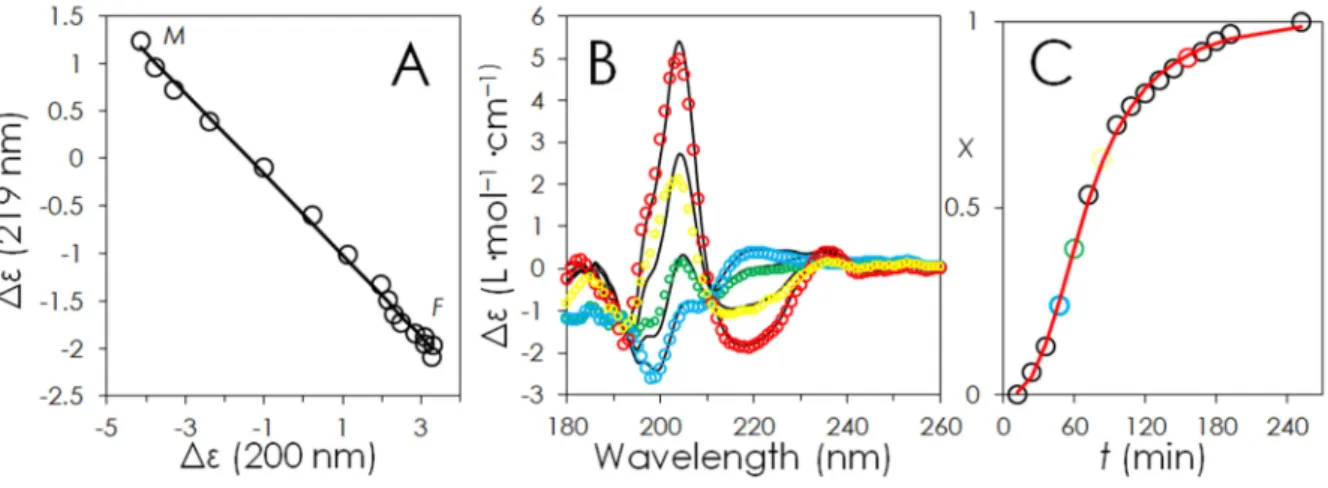
Finally, Figure 9A shows the application of the parametric dependency (or phase diagrams) method73,74 to the SRCD kinetic data reported in Figure 7A. The fact that the dependence of the ellipticity at 219 nm (random conformation) versus the ellipticity at 200 nm (β-sheet conformation) is linear confirms that the assembly mechanism goes through a “all-or-none” transition between two different conformations, i.e. monomers and dimers which predominantly adopt a disordered conformation and the β-sheet-rich fibrils. By contrast, a break in the linearity of the plot would have indicated the existence of an intermediate species with a specific structure. Oligomers with specific conformations can thus be excluded from the Atosiban assembly mechanism. We can thus express any spectrum of
19
the assembly kinetics as a linear combination of first (mainly monomers and dimers) and last spectra (mainly fibrils + monomers and dimers in equilibrium), e.g.: Sfit = (1-x)*S0 + x*Sfinal
as shown in Figure 9B. The evolution of the parameter x as a function of time exhibits a sigmoidal shape (Figure 9C).
Figure 9 : A) Phase diagram analysis of the fibril assembly. L indicates the initial liquid state (monomers and dimers) and G the final gel state (mostly fibrils). The straight line is a linear fit (R2=0.9967). B) Fit (Sfit) of four intermediate
spectra using linear combination of the first (S0) and last spectrum (Sfinal) of the assembly kinetics e.g. Sfit = (1-x)*S0 +
x*Sfinal. Colored dots: experimental spectra, black traces: fit. Blue t=48 min, x= 0.24; green t=60 min, x=0.39; yellow t=84 min, x=0.63 and red t=168 min, x=0.95). C) Plot of parameter x as a function of time. Red line is the
four-parameter logistic regression of the plot.
The same kinetic monitoring carried out in NH4Ac pH 5 (Supp Mat Figure S5) yield
very similar results, whether in terms of time constant or fractions of antiparallel and disordered conformation. This suggests that in addition to the pH, specific ionic effects control the critical aggregation concentration and assembly kinetics.
C)
Discussion: assembly mechanism and fibril structure
Overall, we have demonstrated that Atosiban peptide is able to spontaneously self-assemble into typical amyloid fibrils and form hydrogels at any pH between 5 and 13. However, as seen with osmotic measurements and CD experiments, the critical aggregation concentration is highly dependent on the buffer used. Beyond the simple pH and ionic strength effects, there is certainly an ionic specificity since we have observed that the critical aggregation concentration is much lower in ammonium acetate buffer at any pH (5 and 9) than in any other buffer at comparable pH levels. These supramolecular assemblies are in dynamic equilibrium with free species (monomers and dimers) and are easily undone by simple dilution.
20
We have shown that SRCD allows discriminating the different species in solution (e.g. monomers versus fibrils) and roughly estimate their respective proportion. FTIR and CD spectra analysis of liquid solutions shows that part of the signal arises from β-sheet structure even in absence of fibrils. This signal is attributable to intramolecular hydrogen bonds that stiffen even more the cyclic sequence of the peptide. This suggests that the monomers and dimers in equilibrium in the liquid phase are already fit to aggregation, provided a critical concentration is reached, and could explain why the observed assembly mechanism is so straightforward. Indeed, in the case of Atosiban, the lag phase, which is described as a period of time during which monomers have to undergo a conformational change to adopt an aggregation-prone conformation and form nuclei, barely exists. Moreover, the fact that we have not detected hints of oligomers (others than dimers) with intermediate conformation either by osmotic concentration measurements or with spectroscopies is another clue indicating that Atosiban monomers and dimers (which already exist in the liquid phase and remain present in equilibrium with fibrils) must be the building blocks of these amyloid fibrils. Additionally, it is very consistent that a mechanism avoiding intermediary species may contribute to limiting polymorphism as the structural features observed with the different methods are very similar whatever the buffer used. Indeed, intermediates structures cannot be trapped and grow into other polymorphs.
In addition to the hydrogen bonds structuring the β-sheets, hydrophobic interactions between aromatic amino acids are often a key driving force for the amyloid assembly75–78 and Atosiban makes no exception. We have indeed observed the quenching of the intrinsic fluorescence of the tyrosine residue right from the onset of the fibrils assembly indicating stacking interactions. We also suspect that these Tyr-Tyr interactions are the main driving forces behind the dimer assembly. It is also known that contributions from aromatic amino acids (as well as disulfide bridges) can significantly perturb the far-UV CD spectrum of aromatic rich proteins (>10%), making secondary structure analysis difficult.79–82 In the present case, a standard analysis was still possible, probably because there is only one aromatic residue in the sequence (even though it represents 10% of the sequence). SRCD studies carried with other self-assembling aromatic-rich peptides can be much more complex to decipher (unpublished yet). However, some parts of the spectra remain difficult to interpret (e.g the band at 236 nm; see Supp Mat. for a tentative interpretation as an exciton) and unusually strong contributions of tyrosine are clearly visible in the absorbance and CD spectra. We speculate that this supposed tyrosine exciton is not very strong because the
21
stacking does not propagate along the axis of the fibrils over long distance, but only tangentially. There are also some limitations due to the high absorbance of aromatic residues such as tyrosine or tryptophan for which the signal can saturate. Here, synchrotron radiations were instrumental to study highly absorbing (and possibly scattering) samples. Nevertheless, for concentration above 8%w/w it was not rare to observe the saturation of the dynode voltage below 210 nm which result in a flat CD signal (see Supp Mat Figure S2). Samples with high fibril content thus remain difficult to study.
Concerning the dynamics of assembly, the process is cooperative and spans over a couple of hours as indicated by the sigmoidal shape of the different kinetic plots. This is a rather slow process considering the brevity of the lag phase which would rather suggest a very high nucleation rate, unless the growth rate is of similar order. Overall, our observations suggest that the formation of intermediate species with specific conformation (different from monomer/dimers and fibrils) is very unlikely. If such intermediate species exist, they must be very short-lived. However, the fact that ThT fluorescence continues to increase after Tyr fluorescence has reached a plateau may suggest a maturation of the fibrils that may go on for a few more hours. We thus finally propose the following assembly mechanism:
Monomers ⇄ dimers ⇄ (small fibrils?) ⇄ mature fibrils
in which there is no real conformational difference between the “small fibrils” and the “mature fibrils”, only a higher content in β-sheets.
From the glimpse of the few release kinetics we present here, it is clear that the disassembly kinetics of the gels depend on their concentration: the lower the gel concentration, the steeper the Hill slope and the shorter the lag phase of the release plot. Since the concentration of the gel can be related to the porosity and gel density, we can imagine that the delay before the monomers are released is proportional to the time taken by water molecules to diffuse in the gels and make them swell to the point where the local concentration is below the critical aggregation concentration. On the contrary, a gel whose concentration is close to the critical aggregation concentration will quickly disassemble. Again, a complete investigation is needed to refine this mechanism.
22
Conclusion
This study gives an overview of the self-assembling properties of the Atosiban peptide, from the monomer conformation to the fibrils structure. We also provide a dynamic description of the assembly and insights into its mechanism. The assembly process appears to be very robust since we have not observed any kind of polymorphism. All the kinetic analyses point toward a rather straightforward assembly mechanism involving the cooperative assembly of monomers and dimers without intermediary species contrary to the mechanism derived from studies with pathological amyloid fibrils. The assembly is driven by hydrophobic interaction between tyrosine residues and hydrogen bonds leading to the formation of β-sheets. Given that Atosiban shares its main structural features (disulfide bridge, tyrosine residue etc.) with oxytocin and its many synthetic agonists and antagonists, it is very likely that our results are quite generic. The resulting hydrogels could be used as storage means and it could be envisioned to replace a perfusion by a single injection of a peptide reservoir. Beside, despite some limitations, this study illustrates the usefulness of SRCD as a tool to investigate drug formulation.
Experimental Section/Methods
Peptide. Atosiban (3-Mercaptopropionyl-D-Tyr(Et)-Ile-Thr-Asn-Cys-Pro-Orn-Gly-NH2, C₄₃H₆₇N₁₁O₁₂S₂, Mw=994.2 g.mol-1) was purchased from Bachem (Switzerland) under the form of lyophilized acetate salt. The solid was weighed and dissolved in the chosen aqueous buffer at room temperature. Solutions were homogenized by vortexing. The concentrations are reported in weight ratio (%wpeptide/wpeptide+solvent). For the analysis of the osmotic concentration measurements the concentration were converted in mM using the formula " =& %$/$
$∗'())*%$/$+∗(),- where Mw is the
molecular weight of the Atosiban-acetate salt, i.e. 994.2+59=1053 g.mol-1.
Osmotic concentration measurements. Osmotic concentration of the solutions was measured by
freezing point depression method with an automatic micro-osmometer (Löser, Berlin, Germany). The solutions were prepared the day before the measurement. Another series of measurement was carried out ten days later on the same samples. These measurements yielded similar values and trends.
Transmission electron microscopy. Transmission electron microscopy was performed on a Philips
CM12 electron microscope operated at 80 kV. A drop of the solution at 3-5%w/w was deposited on a copper grid covered with a carbon film (Agar Scientific). After blotting off the excess liquid, the material was stained with a 2% uranyle acetate solution or a 1.5% ammonium molybdate solution depending on the buffer.
23
X-ray scattering and x-ray diffraction. SAXS-WAXS experiments were performed at the European
Synchrotron Facility (ESRF), on the ID02 beamline. The wavelength of the incident beam was 0.0995 nm with exposure times of the order of 0.1-0.5 s. The scattered x-ray were collected on two Rayonix 2D-detectors, covering respectively the [0,075 - 6,408 nm-1] and [5,307- 43,323 nm-1] q-ranges. The samples were inserted in 1.5 mm diameter quartz capillaries sealed with paraffin wax. The spectra were manipulated and analyzed using the SaxsUtilities software. The spectra were treated with SaxsUtilities (www.sztucki.de/SAXSutilities/) and fitted with SasView (http://sasview.org/).
Attenuated Total Reflectance Fourier Transform Infrared (ATR-FTIR). ATR-FTIR spectra were
recorded at a 2-cm−1 resolution with a Bruker IFS 66 spectrophotometer equipped with a 45° N ZnSe ATR attachment. The spectra obtained resulted from the average of 30 scans and were corrected for the linear dependence on the wavelength of the absorption measured by ATR. The water signal was removed by subtraction of pure water spectrum multiplied by a coefficient chosen by superimposing the spectra in the 2500-4000 cm-1 region. The spectra were then deconvoluted with PeakFit (Systat Software Inc) as a sum of Gaussian-Lorentzian components using the secondary derivative method. A linear baseline was used.
Steady-state fluorescence. Immediately after solubilization of Atosiban lyophilized powder in freshly
prepared 16 µg/ml thioflavine T (Sigma-Aldrich), the solutions were placed in 1 mm diameter quartz capillary and inserted in Varian Cary fluorimeter (Varian, Oxford, UK) for measurements. The samples were alternatively excited at 260 and 440 nm and emission scans were collected in the 270-650 and 450-650 nm range, respectively. Excitation and emission slits were both set to 5 nm. The scan rates were set to 120 nm/min with 1 nm data interval and an averaging time of 0.5 s.
The release tests were conducted in a 1 cm quartz cuvette (Hellma) filled with 3 mL deionized water. A 10 mg piece of a solid Atosiban gel was inserted in the cuvette and let to dissolve without stirring while tyrosine fluorescence emission was monitored.
Synchrotron Radiation Circular Dichroism (SRCD). 4 µL droplets or gel with spatula in CaF2 cells (Hellma). The path length used was 3.7 µm. The measurements were performed on the DISCO Beamline at the SOLEIL synchrotron (Saint Aubin, France).84,85 The raw spectra were acquired with a 1 nm spectral resolution. When the samples were under gel form, more spectra were acquired after rotation of the cell to check the absence of anisotropy effect. At most, small changes in CD intensity could be observed, but the general shape of the spectra did not change. The spectra presented in this study were treated with the the CDTool software.86 They are the average of three spectra, except in the kinetics study (Figure 7) where the spectra are averaged two by two. A background (water or corresponding buffer spectrum acquired in the same conditions) was subtracted from them. Intensity calibration was obtained with a CSA sample. Intensities were converted from millidegrees (θ machine
24
units) into Delta epsilon using the formula ∆/ = 0 ∗).(∗&234 56∗7∗8, where MRW is the mean residue weight of the peptide (protein weight/number of residues = 124.3 Da in the case of Atosiban), l is the path length of the CaF2 cell in cm and C is the peptide concentration in mg/ml. Occasionally we have added a smoothing function. Secondary structure content was determined using BestSel.52 This software works by comparing the analyzed spectrum with a set of basis-spectra obtained from reference systems of known structure. Normalized root-mean-square deviation (NRMSD) indicated the most accurate fit for each spectrum. The absorbance spectra were calculated from the dynode voltage (usually labeled as high tension HT) with the formula: A = Z ∗ log ?@A@ABCDEFG
HIJJGKL, where Z is a
proportionality factor that depends from the instrument’s photomultiplier.87 For convenience, we have arbitrarily set it to 1.
Fit of the kinetic plots. The different sigma curves (Figure 6C-E, Figure 8A-B and Figure 9C) were
fitted with the four-parameter logistic equation M = + N*O
(P?QRLS where A and B are the minimum and
maximum values that can be obtained, C indicates the x-value of the inflexion point and D is the Hill’s slope of the curve, related to the steepness of the curve at the point of inflexion. The parameters used are reported in Table S2 in the Supporting information.
ASSOCIATED CONTENT
Supporting information accompanies this paper. Atosiban, oxytocin and vasopressin amino acid sequence comparison, osmotic concentration measurement of aging solutions, ATR-FTIR peak attribution and tentative quantification, more absorbance spectra, further discussion on Figure 7C, discussion on the possibility of a tyrosine-tyrosine exciton, SRCD monitoring of the assembly of Atosiban in NH4Ac pH 5, parameters of the logistic fits of sigma-shaped kinetics curves.
ACKNOWLEDGEMENTS
Maïté Paternostre is acknowledged for the access to the mini electron microscopy platform “TEM-team” (CEA/iBiTec-S) and the acquisition of the first batch of Atosiban peptide. Cryo-TEM observations were made thanks to “Investissements d’Avenir” LabEx PALM (ANR-10-LABX-0039-PALM). SAXS-WAXS experiments were performed on beamline ID2 at the European Synchrotron Radiation Facility (ESRF), Grenoble, France (proposal SC-4163). We are also grateful to Rajeev Dattani and Sylvain Prevost for their assistance during the session. SRCD experiments were performed on the DISCO Beamline at the SOLEIL Synchrotron (Saint Aubin, France) (Proposal 20150680). We thank Antoine Malabirade and Laurent Marichal for their participation during the SRCD session. We thank Patrick Guenoun for reading the manuscript and making useful comments. We also thank François André for an insightful discussion. This work benefited from the use of the SasView application, originally developed under NSF Award DMR-0520547. Sas-View contains code
25
developed with funding from the European Union’s Horizon 2020 research and innovation program under the SINE2020 project, Grant Agreement No. 654000.
AUTHOR INFORMATION Corresponding Author
* frederic.gobeaux@cea.fr
Competing financial interests
The authors declare no competing financial interests.
REFERENCES
(1) Chiti, F.; Dobson, C. M. Protein Misfolding, Functional Amyloid, and Human Disease. Annu Rev Biochem 2006, 75, 333–366.
(2) Knowles, T. P. J.; Vendruscolo, M.; Dobson, C. M. The Amyloid State and Its Association with Protein Misfolding Diseases. Nat. Rev. Mol. Cell Biol. 2014, 15 (6), 384–396.
(3) Huff, M. E.; Balch, W. E.; Kelly, J. W. Pathological and Functional Amyloid Formation Orchestrated by the Secretory Pathway. Curr. Opin. Struct. Biol. 2003, 13 (6), 674–682. (4) Fowler, D. M.; Koulov, A. V.; Alory-Jost, C.; Marks, M. S.; Balch, W. E.; Kelly, J. W. Functional
Amyloid Formation within Mammalian Tissue. PLoS Biol. 2006, 4 (1), e6.
(5) Fowler, D. M.; Koulov, A. V.; Balch, W. E.; Kelly, J. W. Functional Amyloid – from Bacteria to Humans. Trends Biochem. Sci. 2007, 32 (5), 217–224.
(6) Maji, S. K.; Perrin, M. H.; Sawaya, M. R.; Jessberger, S.; Vadodaria, K.; Rissman, R. A.; Singru, P. S.; Nilsson, K. P. R.; Simon, R.; Schubert, D.; et al. Functional Amyloids As Natural Storage of Peptide Hormones in Pituitary Secretory Granules. Science 2009, 325 (5938), 328–332. (7) Otzen, D. Functional Amyloid: Turning Swords into Plowshares. Prion 2010, 4 (4), 256–264. (8) Shewmaker, F.; McGlinchey, R. P.; Wickner, R. B. Structural Insights into Functional and
Pathological Amyloid. J. Biol. Chem. 2011, 286 (19), 16533–16540.
(9) Podlubnaya, Z. A.; Bobylev, A. G. On Functional Amyloids of Muscle Proteins of Titin Family. Biophysics 2012, 57 (5), 577–580.
(10) Watt, B.; van Niel, G.; Raposo, G.; Marks, M. S. PMEL: A Pigment Cell-Specific Model for Functional Amyloid Formation. Pigment Cell Melanoma Res. 2013, 26 (3), 300–315. (11) Romero, D.; Kolter, R. Functional Amyloids in Bacteria. Int. Microbiol. 2014, 17 (2), 65–73. (12) Mostaert, A. S.; Higgins, M. J.; Fukuma, T.; Rindi, F.; Jarvis, S. P. Nanoscale Mechanical
Characterisation of Amyloid Fibrils Discovered in a Natural Adhesive. J. Biol. Phys. 2007, 32 (5), 393–401.
(13) Garcia-Sherman, M. C.; Lundberg, T.; Sobonya, R. E.; Lipke, P. N.; Klotz, S. A. A Unique Biofilm in Human Deep Mycoses: Fungal Amyloid Is Bound by Host Serum Amyloid P Component. NPJ Biofilms Microbiomes 2015, 1.
(14) Gras, S. L.; Tickler, A. K.; Squires, A. M.; Devlin, G. L.; Horton, M. A.; Dobson, C. M.; MacPhee, C. E. Functionalised Amyloid Fibrils for Roles in Cell Adhesion. Biomaterials 2008, 29 (11), 1553–1562.
(15) Chapman, M. R.; Robinson, L. S.; Pinkner, J. S.; Roth, R.; Heuser, J.; Hammar, M.; Normak, S.; Hultgren, S. J. Role of Escherichia Coli Curli Operons in Directing Amyloid Fiber Formation. Science 2001, 295, 851–855.
(16) Claessen, D. A Novel Class of Secreted Hydrophobic Proteins Is Involved in Aerial Hyphae Formation in Streptomyces Coelicolor by Forming Amyloid-like Fibrils. Genes Dev. 2003, 17 (14), 1714–1726.
26
(17) Wösten, H. A. B.; de Vocht, M. L. Hydrophobins, the Fungal Coat Unravelled. Biochim. Biophys. Acta BBA 2000, 1469, 79–86.
(18) Iconomidou, V. A.; Vriend, G.; Hamodrakas, S. J. Amyloids Protect the Silkmoth Oocyte and Embryo. FEBS Lett. 2000, 479, 141–145.
(19) Dannies, P. S. Prolactin and Growth Hormone Aggregates in Secretory Granules: The Need to Understand the Structure of the Aggregate. Endocr. Rev. 2012, 33 (2), 254–270.
(20) Keeler, C.; Hodsdon, M. E.; Dannies, P. S. Is There Structural Specificity in the Reversible Protein Aggregates That Are Stored in Secretory Granules? J. Mol. Neurosci. 2004, 22 (1), 43– 49.
(21) Cherif-Cheikh, R.; Bismuth, F.; Torres, M.-L.; Alloza, R.; Bosch, M. T.; Montes, M.; Fuster, E.; Valles, J.; Cordero, J. A.; Peraire, C.; et al. Autogel: A New Lanreotide Prolonged Release Formulation. Proc Int Symp Control Rel Bio Mat 1998, 25, 798–799.
(22) Maji, S. K.; Schubert, D.; Rivier, C.; Lee, S.; Rivier, J. E.; Riek, R. Amyloid as a Depot for the Formulation of Long-Acting Drugs. PLoS Biol. 2008, 6 (2), e17.
(23) Valéry, C.; Paternostre, M.; Robert, B.; Gulik-Krzywicki, T.; Narayanan, T.; Dedieu, J.-C.; Keller, G.; Torres, M.-L.; Cherif-Cheikh, R.; Calvo, P. Biomimetic Organization: Octapeptide Self-Assembly into Nanotubes of Viral Capsid-like Dimension. Proc. Natl. Acad. Sci. 2003, 100 (18), 10258–10262.
(24) Grondelle, W. van; Iglesias, C. L.; Coll, E.; Artzner, F.; Paternostre, M.; Lacombe, F.; Cardus, M.; Martinez, G.; Montes, M.; Cherif-Cheikh, R.; et al. Spontaneous Fibrillation of the Native Neuropeptide Hormone Somatostatin-14. J. Struct. Biol. 2007, 160 (2), 211–223.
(25) van Grondelle, W.; Lecomte, S.; Lopez-Iglesias, C.; Manero, J.-M.; Cherif-Cheikh, R.;
Paternostre, M.; Valéry, C. Lamination and Spherulite-like Compaction of a Hormone’s Native Amyloid-like Nanofibrils: Spectroscopic Insights into Key Interactions. Faraday Discuss. 2013. (26) Gobeaux, F.; Tarabout, C.; Fay, N.; Meriadec, C.; Ligeti, M.; Buisson, D.-A.; Cintrat, J.-C.;
Artzner, F.; Paternostre, M. Directing Peptide Crystallization through Curvature Control of Nanotubes. J. Pept. Sci. 2014, 20 (7), 508–516.
(27) Valéry, C.; Deville-Foillard, S.; Lefebvre, C.; Taberner, N.; Legrand, P.; Meneau, F.; Meriadec, C.; Delvaux, C.; Bizien, T.; Kasotakis, E.; et al. Atomic View of the Histidine Environment Stabilizing Higher-PH Conformations of PH-Dependent Proteins. Nat. Commun. 2015, 6, 7771. (28) Gobeaux, F.; Porcher, F.; Dattani, R. Reversible Morphological Control of Cholecystokinin
Tetrapeptide Amyloid Assemblies as a Function of PH. J. Phys. Chem. B 2017, 121 (14), 3059– 3069.
(29) Chatani, E.; Inoue, R.; Imamura, H.; Sugiyama, M.; Kato, M.; Yamamoto, M.; Nishida, K.; Kanaya, T. Early Aggregation Preceding the Nucleation of Insulin Amyloid Fibrils as Monitored by Small Angle X-Ray Scattering. Sci. Rep. 2015, 5, 15485.
(30) Pellarin, R.; Caflisch, A. Interpreting the Aggregation Kinetics of Amyloid Peptides. J. Mol. Biol. 2006, 360 (4), 882–892.
(31) Knowles, T. P.; Shu, W.; Devlin, G. L.; Meehan, S.; Auer, S.; Dobson, C. M.; Welland, M. E. Kinetics and Thermodynamics of Amyloid Formation from Direct Measurements of Fluctuations in Fibril Mass. Proc. Natl. Acad. Sci. 2007, 104 (24), 10016–10021.
(32) Nasica-Labouze, J.; Mousseau, N. Kinetics of Amyloid Aggregation: A Study of the GNNQQNY Prion Sequence. PLoS Comput. Biol. 2012, 8 (11), e1002782.
(33) Streets, A. M.; Sourigues, Y.; Kopito, R. R.; Melki, R.; Quake, S. R. Simultaneous Measurement of Amyloid Fibril Formation by Dynamic Light Scattering and Fluorescence Reveals Complex Aggregation Kinetics. PLoS ONE 2013, 8 (1), e54541.
(34) Suzuki, Y.; Brender, J. R.; Soper, M. T.; Krishnamoorthy, J.; Zhou, Y.; Ruotolo, B. T.; Kotov, N. A.; Ramamoorthy, A.; Marsh, E. N. G. Resolution of Oligomeric Species during the Aggregation of Aβ 1–40 Using 19 F NMR. Biochemistry (Mosc.) 2013, 52 (11), 1903–1912.
(35) Chan, F. T. S.; Pinotsi, D.; Gabriele, S.; Schierle, K.; Kaminski, C. F. Structure-Specific Intrinsic Fluorescence of Protein Amyloids Used to Study Their Kinetics of Aggregation. In Bio-nanoimaging; Elsevier, 2014; pp 147–155.
27
(36) Luiken, J. A.; Bolhuis, P. G. Primary Nucleation Kinetics of Short Fibril-Forming Amyloidogenic Peptides. J. Phys. Chem. B 2015, 119 (39), 12568–12579.
(37) Maji, S. K.; Amsden, J. J.; Rothschild, K. J.; Condron, M. M.; Teplow, D. B. Conformational Dynamics of Amyloid β-Protein Assembly Probed Using Intrinsic Fluorescence †. Biochemistry (Mosc.) 2005, 44 (40), 13365–13376.
(38) Hsieh, M.-C.; Liang, C.; Mehta, A. K.; Lynn, D. G.; Grover, M. A. Multistep Conformation Selection in Amyloid Assembly. J. Am. Chem. Soc. 2017, 139 (47), 17007–17010.
(39) Smith, J. E.; Liang, C.; Tseng, M.; Li, N.; Li, S.; Mowles, A. K.; Mehta, A. K.; Lynn, D. G. Defining the Dynamic Conformational Networks of Cross-β Peptide Assembly. Isr. J. Chem. 2015, 55 (6– 7), 763–769.
(40) Liang, C.; Ni, R.; Smith, J. E.; Childers, W. S.; Mehta, A. K.; Lynn, D. G. Kinetic Intermediates in Amyloid Assembly. J. Am. Chem. Soc. 2014, 136 (43), 15146–15149.
(41) Arosio, P.; Knowles, T. P. J.; Linse, S. On the Lag Phase in Amyloid Fibril Formation. Phys Chem Chem Phys 2015, 17 (12), 7606–7618.
(42) Breydo, L.; Uversky, V. N. Structural, Morphological, and Functional Diversity of Amyloid Oligomers. FEBS Lett. 2015, 589 (19PartA), 2640–2648.
(43) Pouget, E.; Fay, N.; Dujardin, E.; Jamin, N.; Berthault, P.; Perrin, L.; Pandit, A.; Rose, T.; Valéry, C.; Thomas, D.; et al. Elucidation of the Self-Assembly Pathway of Lanreotide Octapeptide into β-Sheet Nanotubes: Role of Two Stable Intermediates. J. Am. Chem. Soc. 2010, 132 (12), 4230–4241.
(44) Valéry, C.; Artzner, F.; Paternostre, M. Peptide Nanotubes: Molecular Organisations, Self-Assembly Mechanisms and Applications. Soft Matter 2011, 7 (20), 9583.
(45) Nespovitaya, N.; Gath, J.; Barylyuk, K.; Seuring, C.; Meier, B. H.; Riek, R. Dynamic Assembly and Disassembly of Functional β-Endorphin Amyloid Fibrils. J. Am. Chem. Soc. 2016, 138 (3), 846– 856.
(46) Miles, A. J.; Wallace, B. A. Circular Dichroism Spectroscopy of Membrane Proteins. Chem Soc Rev 2016, 45 (18), 4859–4872.
(47) Bousset, L.; Bonnefoy, J.; Sourigues, Y.; Wien, F.; Melki, R. Structure and Assembly Properties of the N-Terminal Domain of the Prion Ure2p in Isolation and in Its Natural Context. PLOS ONE 2010, 5 (3), e9760.
(48) Bartolini, M.; Bertucci, C.; Bolognesi, M. L.; Cavalli, A.; Melchiorre, C.; Andrisano, V. Insight Into the Kinetic of Amyloid β (1-42) Peptide Self-Aggregation: Elucidation of Inhibitors’ Mechanism of Action. ChemBioChem 2007, 8 (17), 2152–2161.
(49) Wallace, B. A. Synchrotron Radiation Circular-Dichroism Spectroscopy as a Tool for Investigating Protein Structures. J Synchrotron Rad 2000, 7, 289–295.
(50) Wallace, B. A. Conformational Changes by Synchrotron Radiation Circular Dichroism Spectroscopy. Nat. Struct. Mol. Biol. 2000, 7 (9), 708.
(51) Wallace, B. A.; Janes, R. W. Synchrotron Radiation Circular Dichroism Spectroscopy of Proteins: Secondary Structure, Fold Recognition and Structural Genomics. Curr. Opin. Chem. Biol. 2001, 5, 567–571.
(52) Micsonai, A.; Wien, F.; Kernya, L.; Lee, Y.-H.; Goto, Y.; Réfrégiers, M.; Kardos, J. Accurate Secondary Structure Prediction and Fold Recognition for Circular Dichroism Spectroscopy. Proc. Natl. Acad. Sci. 2015, 112 (24), E3095–E3103.
(53) Bulheller, B. M.; Rodger, A.; Hirst, J. D. Circular and Linear Dichroism of Proteins. Phys. Chem. Chem. Phys. 2007, 9 (17), 2020.
(54) European Medicines Agency - Find medicine - Tractocile
http://www.ema.europa.eu/ema/index.jsp?curl=pages/medicines/human/medicines/000253 /human_med_001101.jsp&mid=WC0b01ac058001d124 (accessed Sep 20, 2017).
(55) Åkerlund, M.; Carlsson, A.-M.; Melin, P.; Trojnar, J. The Effect on the Human Uterus of Two Newly Developped Competitive Inhibitors of Oxytocin and Vasopressin. Acta Obstet Gynecol Scand 1985, 64, 499–504.