Université de Montréal
Morphologic Evaluation of Ruptured
Abdominal Aortic Aneurysm by 3D Modeling
par An Tang, MD
Département de radiologie Faculté de médecine
Mémoire présenté à la Faculté de médecine
en vue de l’obtention du grade de maîtrise en sciences biomédicales option recherche clinique biomédicale
Août 2012
Université de Montréal
Faculté des études supérieures et postdoctorales
Ce mémoire intitulé :
Morphologic Evaluation of Ruptured Abdominal Aortic Aneurysm by 3D Modeling
Présenté par : An Tang
a été évalué par un jury composé des personnes suivantes : Isabelle Trop, MD, MPH, président-rapporteur Gilles Soulez, MD, MSc, directeur de recherche
Claude Kauffmann, PhD, co-directeur Rafik Ghali, MD, membre du jury
Résumé
Un anévrysme de l'aorte abdominale (AAA) est défini par une dilatation de plus de 50% par rapport au diamètre normal. La méthode standard et largement répandue pour mesurer la dimension d'un AAA consiste à mesurer le diamètre maximal (Dmax). Présentement, les principaux prédicteurs de risque de rupture sont le Dmax, le sexe et le taux d'expansion d'un anévrysme.
Toutefois, le Dmax a certaines limitations. Des AAAs de formes très différentes peuvent avoir le même diamètre maximal. Le Dmax manque de sensibilité pour détecter le risque de rupture, en particulier pour les petits anévrysmes. Par conséquent, il y a un besoin d'évaluer de manière spécifique et individuelle la susceptibilité de rupture d'un AAA.
Nous présentons le concept et le flux de travail d'un logiciel de segmentation des AAAs développé à notre institution. Nous décrivons les étapes antérieures de validation: évaluation de la reproductibilité du Dmax manuel, comparaison de Dmax par logiciel avec Dmax manuel, validation de la reproductibilité du Dmax et volume par logiciel dans des études transversale et longitudinale pour la détection de croissance et évaluation de la reproductibilité de mesures sur angiographie par tomodensitométrie et en présence d'endoprothèse.
En vue d’identifier de nouveaux paramètres géométrique associés avec le risque de rupture, nous avons réalisé une étude cas-témoin comparant 63 cas avec AAA rompu ou symptomatique et 94 contrôles avec AAA asymptomatique. Une analyse de régression logistique univariée a identifié 14 indices géométriques associés avec une rupture de AAA. Dans l'analyse de régression logistique multivariée, en ajustant pour le Dmax et le sexe, les AAA avec un bombement plus haut situé et une surface moyenne plus élevée étaient associés à une rupture.
Nos résultats préliminaires suggèrent que l'inclusion d'indices géométriques obtenus par segmentation de tomodensitométrie tend à améliorer la classification de AAA avec un risque de rupture par rapport à un modèle traditionnel seulement basé sur le Dmax et le sexe.
De plus larges études longitudinales sont requises pour vérifier la validité du modèle proposé. Des simulations de flux et biomécaniques devraient être envisagées pour améliorer la prédiction du risque de rupture basée sur la modélisation d'anévrysmes.
Mots-clés : Aorte, Anévrysme de l'aorte abdominale, analyse quantitative, diamètre, volume, imagerie tridimensionnelle, segmentation, angiographie par tomodensitométrie, humains
Abstract
Abdominal aortic aneurysm (AAA) is defined as a dilatation of the abdominal aorta exceeding the normal diameter by more than 50%. The standard and widely used approach to assess AAA size is by measuring the maximal diameter (Dmax). Currently, the main predictors of rupture risk are the Dmax, sex, and the expansion rate of the aneurysm.
Yet, Dmax has some limitations. AAAs of vastly different shapes may have the same maximal diameter. Dmax lacks sensitivity for rupture risk, especially among smaller AAAs. Thus, there is a need to evaluate the susceptibility of a given AAA to rupture on a patient-specific basis.
We present the design concept and workflow of the AAA segmentation software developed at our institution. We describe the previous validation steps in which we evaluated the reproducibility of manual Dmax, compared software Dmax against manual Dmax, validated reproducibility of software Dmax and volume in cross-sectional and longitudinal studies for detection of AAA growth, and evaluated the reproducibility of software measurements in unenhanced computed tomographic angiography (CTA) and in the presence of stent-graft.
In order to define new geometric features associated with rupture, we performed a case-control study in which we compared 63 cases with ruptured or symptomatic AAA and 94 controls with asymptomatic AAA. Univariate logistic regression analysis revealed 14 geometric indices associated with AAA rupture. In the multivariate logistic regression analysis, adjusting for Dmax and sex, the AAA with a higher bulge location and higher mean averaged surface area were associated with AAA rupture.
Our preliminary results suggest that incorporating geometrical indices obtained by segmentation of CT shows a trend toward improvement of the classification accuracy of AAA with high rupture risk at CT over a traditional model based on Dmax and sex alone.
Larger longitudinal studies are needed to verify the validity of the proposed model. Addition of flow and biomechanical simulations should be investigated to improve rupture risk prediction based on AAA modeling.
Keywords : Aorta, Aortic Rupture, Abdominal Aortic Aneurysm, Quantitative Analysis, Diameter, Volume, Three-Dimensional Imaging, Segmentation, CT angiography, Humans
Table of Contents
Résumé ... i
Abstract ... iii
Table of Contents ... v
List of Tables ... viii
List of Figures ... ix
List of Appendix ... xi
List of Abbreviations and Symbols ... xii
Dedication ... xiii
Acknowledgements ... xiv
1 ! Introduction 1! 1.1 ! The Size Problem in Vascular Surgery ... 2!
1.2 ! Trends in Abdominal Aortic Aneurysm Treatment ... 5!
1.3 ! 3D Modeling ... 7!
1.4 ! Thesis Structure ... 10!
2 ! Abdominal Aortic Aneurysms 12! 2.1 ! Definition ... 12!
2.2 ! Epidemiology ... 13!
2.3 ! Growth ... 14!
2.4 ! Rupture Risk and Outcome ... 16!
2.5 ! Screening and Surveillance ... 18!
2.6 ! Diagnosis of unruptured and ruptured AAA ... 21!
2.7 ! Management of AAA ... 26!
2.7.1 ! Current Thresholds for Treatment ... 27!
2.7.2 ! Medical Treatment ... 27!
2.7.3 ! Surgical Treatment ... 27!
2.7.4 ! Endovascular Aortic Repair ... 29!
2.8! 3D Modeling ... 37! 2.8.1! Geometrical parameters ... 37! 2.8.2! Biomechanical Simulations ... 39! 2.8.3! Mechanical properties ... 42! 3! Segmentation Software 43! 3.1 ! Software Concept ... 44! 3.2 ! Segmentation Workflow ... 51!
3.3 ! Software Validation Strategy ... 55!
3.4 ! Reproducibility of Manual Dmax Measurements ... 56!
3.5 ! Clinical Validation of Software vs. Manual Dmax Measurements ... 61!
3.6 ! Reproducibility and Accuracy of Software Dmax and Volume Growth Measurements ... 65!
3.7! Impact of Contrast Injection and Stent-graft Implantation on Volume Reproducibility ... 69!
3.8! Geometrical Indices ... 72!
3.9! Potential Clinical Applications of Segmentation Software ... 73!
4! Morphologic Evaluation of Ruptured and Unruptured AAA by 3D Modeling 74! 4.1 ! Abstract ... 74!
4.2 ! Introduction ... 75!
4.1.1 ! Hypothesis ... 76!
4.1.2 ! Aim ... 76!
4.3 ! Materials and Methods ... 76!
4.3.1 ! Study Design ... 76!
4.3.2 ! Study Population ... 77!
4.3.3 ! Data Collection ... 78!
4.3.4 ! CT Imaging Techniques ... 78!
4.3.5 ! Segmentation Methods ... 79!
4.3.6 ! Size and Shape Indices ... 81!
4.3.7 ! Statistical analysis ... 81!
4.4 ! Results ... 82!
4.4.2 ! Geometric Characteristics ... 84!
4.4.3 ! Results of Univariate Logistic Regression Analysis ... 85!
4.4.4! Results of Multivariable Logistic Regression Analysis ... 85!
4.4.5 ! Classification Accuracy ... 86!
4.4.6 ! ROC Curve Analysis ... 87!
4.5! Discussion ... 87! 4.5.1 ! Main Findings ... 87! 4.5.2 ! Interpretation of Results ... 89! 4.5.3 ! Clinical Implications ... 90! 4.5.4 ! Limitations ... 90! 4.5.6! Conclusion ... 91! 5! Conclusion 92! 5.1! Closing Words ... 92! 5.2! Future Work ... 94! Bibliography 95! Appendix cix!
List of Tables
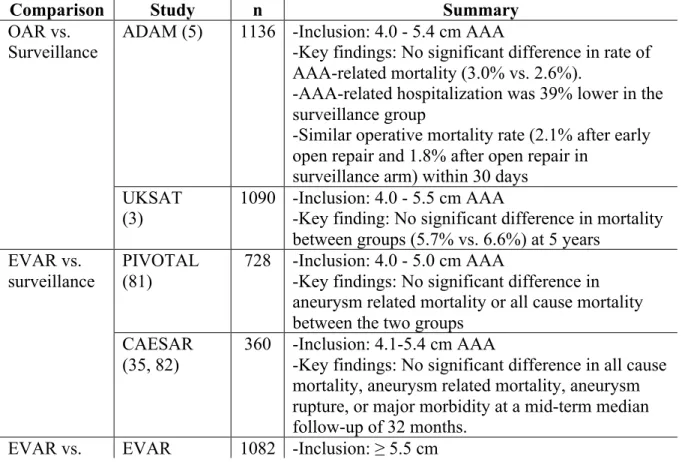
Table 1.1: Summary of imaging findings on CT indicating completed, impending or contained AAA rupture. ... 22! Table 2.1: Summary of randomized trials comparing AAA treatment: endovascular aortic repair (EVAR), open aortic repair (OAR), or surveillance. ... 35! Table 2.2: Features expected from a modern AAA segmentation solution ... 44! Table 3.1: Intraclass correlation coefficient by diameter measurement method at baseline and follow-up (102). ... 59! Table 3.2: Inter-observer reproducibility of manual Dmax measurements (36). ... 62! Table 3.3: Intra-observer reproducibility of software and manual Dmax measurements (36). ... 62! Table 3.4: Intra- and inter-observer reproducibility Dmax and volume growth measurements (36). ... 66! Table 4.1: Patient characteristics in case and control groups (157 subjects) ... 83! Table 4.2: Geometric characteristics of AAA in case and control groups (157 subjects) ... 84! Table 4.3: Results of multivariate logistic regression analysis ... 85! Table A.1: One-dimensional size indices ... cxi! Table A.2: Two-dimensional size indices ... cxii! Table A.3: Three-dimensional size indices ... cxii! Table A.4: Three-dimensional shape indices ... cxii! Table A.5: Second order curvature-based indices ... cxiii!
List of Figures
Figure 1.1: Qualitative description of normal aorta and AAA shapes. ... 2!
Figure 1.2: Discrepancies between diameter and volume growth in two AAAs. ... 4!
Figure 1.3: Comparison of 2 AAAs with similar maximal diameter. ... 5!
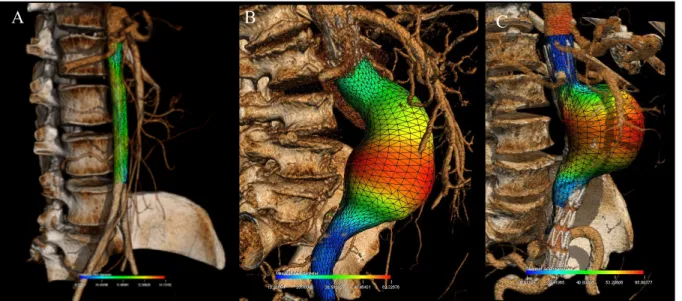
Figure 1.4: Color-coded parametric maps overlaid on AAA outer wall mesh. ... 8!
Figure 1.5: Roadmap. ... 10!
Figure 2.1: 3D model of an AAA in a 79-year-old female. ... 13!
Figure 2.2: Three-dimensional mesh rendering of AAA at baseline and follow-up. ... 15!
Figure 2.3: Before/after rupture comparison in 78-year-old woman with AAA. ... 16!
Figure 2.4: AAA surveillance on abdominal ultrasound. ... 19!
Figure 2.5: AAA rupture diagnosis on axial CT angiography. ... 23!
Figure 2.6: Signs of AAA rupture on CT in different patients. ... 25!
Figure 2.7: AAA measurements for stent graft sizing. ... 26!
Figure 2.8: Schematic of open surgical repair. ... 28!
Figure 2.9: Schematic of endovascular aortic repair (EVAR). ... 29!
Figure 2.10: Fenestrated endovascular aortic repair (FEVAR). ... 32!
Figure 2.11: Finite volume analysis (FVA). ... 41!
Figure 2.12: 3D rendering showing AAA wall shear stress simulation at peak velocity. Flow direction is indicated by a white arrow. (Image courtesy of Florian Joly. Generated in Fluent, Ansys). ... 42!
Figure 3.1: Manual segmentation workflow on axial images. ... 43!
Figure 3.2: Axial unenhanced CT showing low contrast situation. ... 48!
Figure 3.3: AAA model in a 72-year-old man with a Dmax of 6.97 cm. ... 50!
Figure 3.4: Overview of software interaction. ... 51!
Figure 3.5: Radial and longitudinal stretch views for segmentation. ... 53!
Figure 3.6: AAA model in a 72-year-old man with a Dmax of 6.97 cm. ... 54!
Figure 3.7: Sequential approach to double-oblique (DO) reformation method. ... 58!
Figure 3.8: Inter-reader agreement. ... 63!
Figure 3.10: Inter-reader agreement for volume measurements. ... 67! Figure 3.11: 3D renderings of AAA models. ... 70! Figure 4.1: Study Flowchart. ... 78! Figure 4.2: 3D volume rendering with parametric maps on model overlay based on a contrast-enhanced CT in a patient with ruptured AAA. ... 80! Figure 4.3: ROC analysis. ... 87! Figure A.1. Definition of 1 D geometrical indices, modified from Martufi et al. (91). ... cx!
List of Appendices
Appendix 1. Mathematical definitions of geometric indices ... cix! Appendix 2. Manuscript 1: Reproducibility of AAA diameter measurement and growth.
... cxiv! Appendix 3. Manuscript 2: Clinical validation of a software for quantitative follow-up of AAA maximal diameter and growth by CTA. ... cxxiv! Appendix 4. Manuscript 3: Measurements and detection of abdominal aortic aneurysm growth: Accuracy and reproducibility of a segmentation software. ... cxxxii!
List of Abbreviations and Symbols
3D = Three-dimensional
AAA = Abdominal aortic aneurysm
AAVS = American Association for Vascular Surgery
ANOVA = Analysis of variance
AUC = Area under the ROC curve
CHUM = Centre Hospitalier de l'Université de Montréal
CI = Confidence interval
CSD = Computational fluid dynamics
CT = Computed tomography
CTA = Computed tomography angiography
Dmax = Maximal diameter
EVAR = Endovascular aortic repair
eEVAR = Emergency endovascular aortic repair
FEA = Finite element analysis
FEVAR = Fenestrated endovascular aortic repair FSI = Fluid structure interaction
ICC = Intraclass correlation coefficient
ILT = Intraluminal thrombus
MDCT = Multidetector computed tomography
NPV = Negative predictive value
OR = Odds ratio
PPV = Positive predictive value
PWS = Peak wall stress
ROC = Receiver operating characteristic
SD = Standard deviation
For my father and mother who made so many sacrifices for me
Acknowledgments
I feel tremendously privileged to have had the opportunity to work with Dr. Gilles Soulez and Dr. Claude Kauffmann on this research program. I would like to thank Gilles, whose generosity in time and experience is only exceeded by his kindness, and who has been my mentor for the past ten years. He showed me the way by taking time to review my manuscripts and research proposals despite his numerous commitments. He is leading by example and always cheerfully planning the next study.
I am grateful to Dr. Claude Kauffmann for developing the software and conceptual tools necessary to perform these studies together. Claude has always had a vision of preserving the richness of anatomical information from multiplanar imaging. Also, he was always eager to immerse himself in the technical intricacies of the segmentation process. Without his help, this study would not have been possible. The majority of renderings in these pages are the result of his artistry. These diagrams also mirror the passion we share for visual display of quantitative information.
I would like to acknowledge the essential contribution of Dr. Stéphane Elkouri, vascular surgeon at CHUM, and Dr. Oren Steinmetz, vascular surgeon at McGill, who identified the AAA surgical candidates eligible for this study.
I am grateful to Dr. Trop and Dr. Ghali for serving as jury members to my Master's thesis.
Attending the courses on the university campus for my formal training required support from my abdominal section chief. Special thanks to Dr. Jean-Sébastien Billiard for outstanding support and for allowing me to balance the requirements of a master's degree with those of a full clinical workload.
I addition, I would like to thank Dr. Miguel Chagnon, biostatistician at University of Montreal, for his expertise and judgment.
I would like to thank four wonderful residents and medical students: Sophie Tremblay-Paquet, Laurie Cloutier-Gill, Stéphanie Lam, and Florence Morin-Roy for their precious help in data collection and in AAA segmentation. They were very generous with their time and commitment.
Finally, I would like to thank my parents, Tang Quoc Kiet and Nguyen Thi Hon, for their love and support. Three decades ago, my parents made the bold move to leave Vietnam as boat people, hoping for a better future for their son. In the following years, they have made countless sacrifices for me, and have provided me with support and encouragement. This dissertation is dedicated to them.
1
Introduction
This dissertation introduces a new software approach to describe the morphology of abdominal aortic aneurysms (AAA). Modern multiplanar imaging methods such as computed tomography angiography (CTA) provide a vast data set depicting human anatomy with high resolution. Once loaded in post-processing workstations, this data set can be viewed in orthogonal, oblique or curved planes, displayed as maximum intensity projections, or volume rendered with realistic color palettes, surface shading and lighting.
Despite the sophistication of modern imaging techniques, the geometry of AAA is often summarized qualitatively in reports according to its shape ("fusiform" or "saccular"), its superior extension above or below renal arteries, and its inferior extension to the iliac arteries. The maximum diameter (Dmax) is often the only objective quantitative measurement reported. For surgical planning, additional length, diameter and angle measurements are also reported.
The root of the problem is not missing data acquisition or insufficient visualization capabilities. Instead, the problem is access to existing, but unreported information. To accurately describe the morphology of AAA in terms of objective metrics, an intermediate step must first be accomplished: the boundaries of its outer wall and its lumen must first be delineated. This process is called segmentation. The price to pay is additional work to collect geometric information. In the process, we will generate a three-dimensional model representing the AAA wall, thrombus, and lumen.
Of course simply tracing the contour of AAA wall and lumen on each individual image is not a complete solution to the modeling problem. A manual approach may be feasible for a proof of concept on a limited number of cases. However, to scale this method to a large database of AAA cases either for research purpose or eventually for clinical purpose, segmentation automation is an essential ingredient. The idea is to find the right balance between user interaction, automated software tasks and graphic display to complete the task in a reasonable time.
1.1
The Size Problem in Vascular Surgery
The aorta is the largest artery coursing from the thorax and extending down to the abdomen, where it bifurcates into the common iliac arteries. The normal diameter of the aorta is approximately 2 cm (1). An abdominal aortic aneurysm (AAA) is defined as a dilatation of the aorta by a diameter of 3 cm or more (2). While AAAs may affect any segment of the aorta, most involve the segment below the renal arteries. AAAs may be qualitatively described as fusiform if they maintain a cylindrical shape or saccular if they are spherical in shape (Figure 1.1).
Figure 1.1: Qualitative description of normal aorta and AAA shapes. (A) Normal aorta. (B) Fusiform AAA. (C) Saccular AAA.
The majority of AAAs are true aneurysms that involve all three layers of the arterial wall (intima, media, and adventitia). Pseudoaneurysms (or false aneurysms) may also occur, which are characterized by a discontinuity in the inner layers of the arterial wall and is only contained by the adventitia or surrounding soft tissues.
AAAs of vastly different shapes may have the same maximal diameter. Furthermore, although growth occurs in three dimensions, it is a well-entrenched practice to report the maximal diameter (Dmax), a one-dimensional measure, as a surrogate measure of AAA
size. The main predictors of rupture risk are the maximal diameter (Dmax) and the expansion rate of the aneurysm.
This practice of categorizing AAAs according to their Dmax has been widely used in randomized controlled trials. For instance, to address the uncertainty about whether prophylactic repair is the best management for smaller symptomless aneurysms of 4.0 - 5.9 cm in diameter, the United Kingdom Small Aneurysm Trial randomly assigned 1090 patients to undergo early elective open surgery or ultrasonographic surveillance and followed them for a mean of 4.6 years (3). The results did not support a policy of open surgical repair for AAAs of this size range.
Whereas studies support watchful surveillance of small AAAs (<5.5 cm), randomized clinical trials suggest that the risk of AAA rupture warrants intervention when the maximal diameter reaches 5.5 cm (4, 5).
Based on the rupture risk, mortality rate in elective procedure and life expectancy of the patient, the American Association for Vascular Surgery (AAVS) in association with the Society for Vascular Surgery (SVS) have issued recommendations regarding AAA treatment (6). The main indications for a procedure are Dmax ≥ 5.5 cm in men, ≥ 4.5-5.0 cm in women, rapid expansion > 1cm/year, or symptomatic AAA. The different size threshold for men and women reflect the higher risk of rupture among women.
For larger AAAs, the annual rupture risk of 6 to 7 cm aneurysm is 10 to 20% (7). There are several advantages to using Dmax. First, it is practical: Dmax is widely used, validated, and can be measured and compared with different imaging modalities (ultrasound, computed tomography, magnetic resonance imaging). Second, it is useful: in a large prospective observational study of large AAAs at least 5.5 cm in diameter, Dmax was the strongest predictor of rupture (8).
Yet, Dmax has a major limitation: its lack of sensitivity for rupture risk, especially among smaller AAAs (9). The rupture rate of AAAs < 5 cm was 12.8% (34/265) according to an autopsy study by Darling et al. (10). However, the mean risk of rupture of aneurysms of 4.0 - 5.5 cm in diameter was deemed to be lower, in the range of 1.0% per year, according to the United Kingdom Small Aneurysm Trial, in which study participants were randomised to early elective surgery or ultrasonographic surveillance (3). This estimate was
supported by a population-based study of patients with AAAs followed by ultrasound, which found an estimated rupture risk of 0% per year (95% confidence interval [CI], 0%-5%) when less than 4.00 cm, 1.0% per year (95% CI, 0%-0%-5%) when 4.00 to 4.99 cm, and 11% per year (95% CI, 1%-21%) when 5.00 to 5.99 cm (11).
Clearly, these numbers indicate a limitation to a "one-size-fits-all" approach to selecting patients at higher risk for rupture and highlight the need for evaluating the susceptibility of a given AAA to rupture on a patient-specific basis (Figure 1.2). The goal of a custom-tailored approach would be to improve the clinical management of these patients.
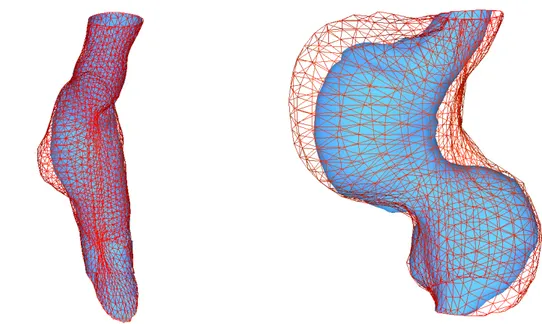
Figure 1.2: Discrepancies between diameter and volume growth in two AAAs.
Baseline mesh is delineated in blue and follow-up mesh in red. (A) Diameter grows by 18%
due to focal bulge, but volume grows by only 5%. (B) In a different patient, the diameter
also increases by 18%, but this is accompanied by a 45% volume increase due to global growth.
In addition, two AAAs may have a similar Dmax, but markedly different geometries (Figure 1.3). The implied observation is that these aneurysms may have different rupture risks by virtue of different volumes, shapes, thrombus thickness and presumably different wall stress.
In summary, Dmax is a tried and true method for predicting rupture risk. Dmax thresholds have been used to determine rupture risk in clinical trials and are widely used in clinical practice to stratify patient risk. However, Dmax should not be seen as an end in itself, but as a surrogate measure.
Figure 1.3: Comparison of 2 AAAs with similar maximal diameter.
(A) Asymmetrical, saccular, and curved AAA. (B) Relatively symmetrical, fusiform, and
angulated AAA.
1.2
Trends in Abdominal Aortic Aneurysm Treatment
AAA open surgical repair was first performed in 1951 by Dubost et al. (12). In 1952, Michael de Bakey and Denton Cooley were the first to use a homograft in repairing a large aneurysm of the thoraco-abdominal aorta (13). With the aid of textile engineers, surgical innovators experimented with synthetic tube grafts. Eventually, Dacron polyester proved superior to other fabrics (14). Open surgical repair is performed by a vascular surgeon and requires a laparotomy. The aorta is clamped and a graft is sewn to act as a bridge for blood flow, thus preventing arterial pressure to further expand the native AAA wall.
Minimally invasive endovascular aneurysm repair was first reported in 1986 (15). The concept is to reline, rather than to remove, the diseased portion of the aorta to achieve a more physiological repair. By preserving the integrity of the aneurysmal wall, blood loss and trauma to surrounding tissues are minimized. An interventional radiologist and/or a vascular surgeon perform this procedure. Incisions are first made at the groin to insert catheters via the femoral arteries to the AAA. Using fluoroscopy, catheters and guide wires are positioned in the aorta and a stent graft made of a metallic stent covered with a prosthetic fabric is deployed in the AAA. Endovascular aortic repair (EVAR) eliminates the need to perform a laparotomy and clamp the aorta during the procedure. This reduces the hemodynamic stress and is most commonly considered in patients at increased surgical risk.
Technical success of more than 95% and perioperative mortality rates between 1 and 2% are reported (16, 17). In randomized studies, lower perioperative mortality and morbidity rates have been reported after EVAR as compared with open surgical repair (2.1-4 versus 5.7-7%) (18, 19) even though mid term and long term survival rate following EVAR and open repair are not different (17, 20, 21). The main limitations of EVAR are the durability of aneurysm exclusion and the occurrence of endoleaks (leakage of blood between the graft and AAA) (22).
In the setting of ruptured AAAs, emergency EVAR (eEVAR) has been proposed by Yusuf et al. (23). Its application requires overcoming additional practical and logistical barriers: the patient must be stable during the anatomical CT imaging required prior to EVAR and the hospital must provide coverage of interventional radiology and vascular surgery services (24).
EVAR cannot be performed on everyone. The patient's anatomy must fit the graft. Ideal characteristics of an AAA for EVAR require a complete seal at the proximal (infra-renal aorta) and distal (iliac arteries) landing zones of the stent graft. The proximal neck, defined as the healthy aortic portion (neck) between the lower renal artery and the aneurysm, should not be dilated, have a minimal length (10-15 mm), low angulation and minimal thrombus infiltration (25). Regarding iliac arteries, high angulation should also be avoided and have a minimal diameter to accommodate the delivery device. The distal
portion of the graft is preferentially deployed in the common iliac artery if there is a landing zone above the origin of the internal iliac arteries. If not, the internal iliac artery can be covered or embolized and the stent extended into the external iliac artery. Recently, more complex EVAR procedures with short or angulated neck involving the preservation of renal or digestive arteries by fenestrated stent grafts or internal iliac arteries by branched iliac stent grafts were performed (26-28).
In summary, open surgical repair and EVAR are two treatment options to large AAA (≥5.5 cm in diameter). Open surgical requires an abdominal incision. EVAR is less invasive, has lower perioperative mortality and morbidity rates, but no mid term and long term improvement in survival rate. To determine anatomical suitability to EVAR, a CT-scan must be performed to evaluate the candidate's arterial anatomy.
1.3
3D Modeling
Our proposed solution to the size problem in vascular surgery exploits the need to perform a CT-scan for surgical planning of patients' anatomy. Nowadays, data is acquired with high resolution and nearly isotropic voxels suitable for multiplanar reconstructions.
With modern post-processing methods, it is possible to perform AAA segmentation. In addition to exquisite 3D rendering, segmentation allows calculation of AAA volumetry. Given the three-dimensional nature of AAA growth, Prinssen et al. have shown that volumetric assessment was more sensitive than diameter measurement in the detection of changes in aneurysm size (29).
Recently, using a semiautomated segmentation method, we have confirmed that volume measurements were more sensitive than Dmax to detect AAA growth while providing an equivalent and high reproducibility (30).
An indirect benefit of performing segmentation for volumetry is the ability to generate a model of the AAA outer wall, thrombus, and lumen. From a clinical perspective, this allows visual depiction of the geometric diversity of AAAs and reveals the anatomical relationship with renal and iliac vessels that are critical for EVAR planning. From a
CHAPTER 1.INTRODUCTION
8
research perspective, the AAA mesh is a prerequisite for extracting geometric parameters and performing biomechanical simulations.
Potential discrepancies may exist between Dmax and volume progression. A diameter increase is necessarily accompanied by a volume increase, but the converse is not true. Figure 1.2 shows that a volume increase can theoretically occur with minimal diameter increase. This highlights the potential need to report both diameter and volume growth.
The main limitation of AAA volumetry is the absence of an absolute gold standard for the measurement of the aneurysm sac volume. Additional limitations include the time-consuming nature of segmentation methods and the current inability to co-register interval studies.
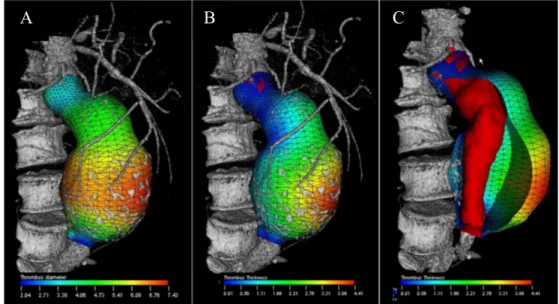
Figure 1.4: Color-coded parametric maps overlaid on AAA outer wall mesh.
(A) AAA surface model with color-coded Dmax values at each location of the AAA wall.
(B) Color-coded thrombus thickness map, (C) illustration of the thrombus thickness
computed as the closest distance between the outer aneurysm wall and the lumen represented in red (31).
From the segmented lumen a smooth luminal path is extracted and used to compute a stretched image volume. For each point on the path, a perpendicular plane is computed and used to interpolate a new image.
2.4 Semi-Automatic Segmentation of Aneurysm Wall
The aneurysm outer wall is segmented and validated by a supervised process. The GPU-based reformatted volume is represented on two orthogonal views shown on figure 5, an axial view (a) centered on the luminal path and as a longitudinal view (b) along the path. The lumen wall is then segmented interactively in longitudinal half planes using an active contour (snake) process (green curve on figure 5b), initialized automatically, on the lumen border, or interactively by the user. The snake can be redirected interactively if needed in order to correct local false detection of the aneurysm wall.
Figure 6. Luminal path-based stretched image volume represented on two orthogonal views, an axial view (a) centered on the luminal path and a longitudinal view (b) along the path. The axial view (a) position is given by the pink line in (b), and the longitudinal view (b) corresponds to the red half-plane in (a).
Using this approach, the outer aneurysm wall can be represented by a u-v parametric model, where u represents the closed curves in axial plane and v the open curves in longitudinal plane. The success of our segmentation method lies in the separation of the geometrical and topological features of the AAA in the u-v space. The v-curves contains the bumpy and rough shape of the aneurysm while the u-curves contains the smooth one. The snake delineates the complex geometry and topology of the AAA from which the rest of the form can be interpolated in the u-space without loss of accuracy (figure 5) because the shape of AAA is always elliptic or circular in the u-planes.
Figure 7. AAA surface model with color-coded D-max values at each location of the AAA wall (a). Color-coded thrombus thickness map (b) and illustration of the thrombus thickness computed as the closest distance between the outer aneurysm wall and the lumen represented in red (c).
Proc. of SPIE Vol. 7624 76240N-7
Once the AAA is segmented and the outer wall mesh generated to compute the aneurysmal volume, this surface can also be used to display color-coded geometric parameters such as the local diameter (mm) (Figure 1.4). Thus, Dmax can be visually depicted as a surrogate measure of rupture risk.
Additional morphological features have been proposed to predict the rupture risk. Stenbaek et al. suggested that thrombus growth may be a better predictor of AAA rupture than increase in maximal diameter (32). While the effect of intraluminal thrombus on rupture risk remains controversial (33), there is no doubt that the segmentation of a thrombus remains essential to simulate the peak wall stress.
Ultimately, rupture occurs when the mechanical stresses (expressed in force/unit area) exceed wall strength or reaches wall failure threshold. Thus, a rupture prediction index may be mapped on the AAA outer wall to indicate areas with higher wall stress/strength ratio (9). The basic principles in terms of computational modeling of AAA will be discussed later in this thesis.
In summary, the high resolution, nearly isotropic voxels, and volumetric nature of CT data is suitable for multi-planar and three-dimensional reconstructions of AAA anatomy. With modern post-processing methods, it is possible to perform AAA segmentation. This may become clinically useful since volume is emerging as a more sensitive measure of growth than Dmax. While outer wall and thrombus segmentation require additional work to generate a 3D model, this is rewarded by the possibility of extracting quantitative geometric information and performing wall stress simulations to estimate an individual rupture risk.
1.4
Thesis Structure
I have written this master's thesis in a manner that will be accessible to a broad range of readers, including medical students, general radiologists, vascular surgeons, software engineers and computer graphics researchers.
Figure 1.5 is a roadmap of the territory covered in the various chapters. Medical students should read this document sequentially. Radiologists will be most interested in the images and 3D renderings throughout the text, and may begin their exploration by approaching this master's thesis like a photography book. Vascular surgeons and interventional radiologists with intimate knowledge of AAA may wish to jump directly to Chapter 3. The collaborators to our previous papers may focus on Chapter 4 and 5.
Finally, the mathematically inclined will be most interested in Appendix 1, which provide the definitions for the 1D, 2D and 3D size indices and the 3D shape indices used in the study described in Chapter 4.
Chapters Descriptions
• Chapter 2 introduces abdominal aortic aneurysms and reviews the epidemiology, rupture risk, imaging methods, rationale for treatment and treatment options. It contains a succinct overview of computational fluid dynamics methods that require 3D modeling as a prerequisite to perform simulations.
• Chapter 3 presents the design concept and workflow of the AAA segmentation software developed at our institution. It also describes the orderly validation steps completed over the past 3 years, from reproducibility of manual maximal diameter (Dmax) measurements, validation of software Dmax against the manual reference standard, reproducibility of software Dmax and volume measurements in a cross-sectional study, in a longitudinal study for detection of AAA growth, reproducibility of software measurements in unenhanced CTA and in the presence of stent-graft. The last section describes the geometric indices that can be computed and the potential clinical benefits from this software.
• Chapter 4 applies segmentation and geometrical indices developed previously to a case-control study that compares ruptured and unruptured AAAs. This study is the result of collaborative work between radiologists and vascular surgeons from two universities: Université de Montréal and McGill University.
• Chapter 5 summarizes the lessons learned, the challenges ahead and points to future research directions.
2
Abdominal Aortic Aneurysms
2.1
Definition
The normal aortic diameter varies depending on age and sex. According to Ouriel et al. (1), the mean diameter of normal aorta, as measured by abdominal CT, was 2.1 ± 0.05 cm at the infra-renal level, and 2.5 ± 0.05 cm at the supra-celiac level. These values varied according to sex: 2.3 ± 0.1 cm and 2.6 ± 0.1 cm respectively for men, and 1.9 ± 0.1 cm and 2.3 ± 0.1 cm for women. The diameter increased with age at a rate of 0.1 mm/year for both sexes.
Abdominal aortic "ectasia" is defined as a focal dilatation less than 50% the normal diameter, whereas an abdominal aortic aneurysm is defined as a permanent dilatation more than 50% above the expected normal diameter (2) (Figure 2.1).
Small AAA is defined as <5.5 cm in diameter because the risk of rupture is low (3, 34, 35).
AAA morphology is characterized by loss of parallelism of the outer walls, either saccular (20%), or more frequently fusiform (80%).
CHAPTER 2.ABDOMINAL AORTIC ANEURYSMS 13
Figure 2.1: 3D model of an AAA in a 79-year-old female.
(A) 3D volume rendering with color-coded diameters: the smallest diameters are
represented in blue and the largest in red. (B) The outer wall mesh is semi-translucent and
the lumen mesh is revealed underneath. The automatically calculated Dmax is displayed as a red line (36).
2.2
Epidemiology
The prevalence of AAA is three times higher among men than women. The age-related increase in diameter of the infrarenal aorta is more marked in men than in women. The prevalence of aneurysms increases by about 6 percent by decade. Clinically relevant aneurysms (> 4 cm in diameter) are found in about 1 percent of men 55 to 64 years of age, and the prevalence increases by 2 to 4 percent per decade afterwards (37, 38).
Smoking is the strongest independent risk factor: 90 percent of patients with aneurysms have smoked (38). As compared with those who have never smoked, the incidence of aneurysm is increased by a factor of six among those who have smoked for more than 40 years and by a factor of seven among those who have smoked more than 20 cigarettes per day (39).
Fig. 1. Overview of software interaction. User tasks, software tasks and graphic display are illustrated in the left, middle and right column, respectively.
2.6.3. Validity
For the validity analysis, linear regression and Bland–Altman analysis were used to assess agreement between the two (software and manual DO) methods of measurement. Linear regression anal-ysis was performed separately for measurement taken on baseline
and follow-up examinations. Means of the two readings (sessions 1 and 2) were calculated for the software and for each of the two radiologists (1 and 3). The 95% CI for the slope and intercept are reported. If the slope of the line is close to unity and the intercept close to zero, this implies that the two methods of measuring D-max
Fig. 2. Abdominal aortic aneurysm in a 79-year-old female. Left picture shows 3D volume rendering displays with 3D AAA model overlay. Different diameter values are color-coded, the smallest diameters are represented in blue and the largest in red. The automatically calculated D-max is displayed in the right picture by the red line.
Additional risk factors include: male sex, age > 75 years, Caucasian race, hypertension, family history, and hyperlipidemia (40).
An etiologic classification of arterial aneurysms is important (2). AAAs are most commonly arteriosclerotic aneurysms. Alternatively, aneurysms may develop as a result of an arterial dissection, and may be associated with cystic medial necrosis, a pathologic process characterized by an accumulation of basophilic substance in the media with cyst-like lesions, which occur in connective tissue disease such as Marfan's syndrome, and Ehlers-Danlos type IV. Inflammatory aneurysms occur in younger patients and may result from retroperitoneal fibrosis, collagen disease, fibromuscular dysplasia, or autoimmune diseases such as rheumatoid arthritis, lupus, Behçet's disease and giant cell arteritis. Infected (mycotic) pseudoaneurysms may result from hematogenous seeding or direct spread from an adjacent vertebral ostemyelitis or from retroperitoneal abscesses.
False aneurysms may result from a trauma. In patients with a history of aortic surgery, an anastomotic aneurysm may result from an infection, arterial wall failure, suture failure, or graft failure.
2.3
Growth
The natural history of AAA growth has been evaluated with serial ultrasound or CT in patients who were not surgical candidates, either because of small size, high surgical risk, or patient refusal (41).
Growth has been studied in terms of Dmax (Figure 2.2), the most commonly used measurement to establish growth rate, rupture risk, and treatment indication. AAA growth in diameter results from forces applied on the arterial wall according to Laplace's law and gradual wall weakening due to decreased elastin concentration, increased metalloproteinase (MMP) and action of proteolytic enzymes produced by macrophages (9).
Two patterns of AAA growth have been observed: accelerating or linear expansion expansion (40, 42). Accelerating (triphasic) growth is characterized by a quiescent phase of long duration, an inflexion where Dmax reaches a threshold (between 45 and 55 mm),
followed by an accelerated growth as the aneurysm enlarges. Linear growth, which is less common, occurs without acceleration.
In addition to a Dmax > 5.5 cm, a "rapid" growth characterized by an expansion rate of 1.0 cm or more within 6 months is often used as an indication for surgery.
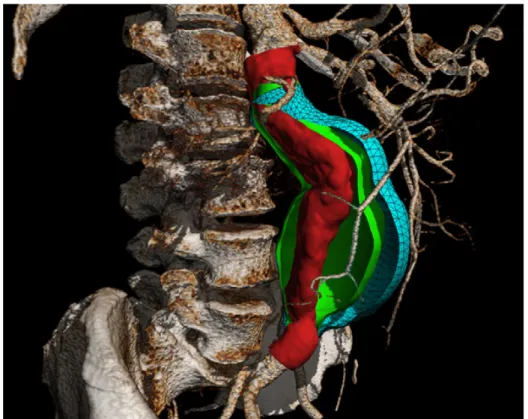
Figure 2.2: Three-dimensional mesh rendering of AAA at baseline and follow-up.
The lumen (red), outer wall at baseline (green), and 3 years follow-up (blue) are shown in a 69-year-old man. The Dmax was 58.5 mm at baseline and 74.3 mm at follow-up (27% relative growth). The volume was 202.9 ml at baseline and 327.3 ml at follow-up (61% relative growth). 3D-3D co-registration of baseline and follow-up examinations allow instantaneous volume comparison on the same dataset (30).
Please cite this article in press as: Kauffmann C, et al. Measurements and detection of abdominal aortic aneurysm growth: Accuracy and reproducibility of a segmentation software. Eur J Radiol (2011), doi:10.1016/j.ejrad.2011.04.044
ARTICLE IN PRESS
G ModelEURR-5517; No. of Pages 7
C. Kauffmann et al. / European Journal of Radiology xxx (2011) xxx–xxx 3
Intravenous contrast media was given in all studies with at 3–5 ml/sec, for a total of 80–120 ml.
2.3. Measurement methods
Four observers, 1 experienced senior radiologist with 20 years of experience in vascular imaging who represented the reference standard (R) and 3 first-year medical students with no prior expe-rience in imaging (T1, T2, T3), all blinded to previous radiological reports, independently segmented aneurysms on each of the 56 studies. The medical students had 5 days of training to manipulate the software and learn the CT anatomy of AAA with serial feedback sessions from the senior radiologist using a separate 20 AAA patient CTA database. Hence, they were considered to have no particular expertise.
All segmentations were performed using a semi-automated software method (A3Dmax; Object Research System, Montreal,
Canada) previously validated for D-max measurements [16]. The
segmentation algorithm is described in detail elsewhere[17]. The
main steps of our interactive method consisted of: (1) user identifi-cation of AAA lumen entry and exit points (2) software calculation of 3D lumen, (3) creation of a curved-MPR following a luminal path with minimization of curvature, (4) automated aneurysm wall segmentation on 4–8 radial MPR reformations along the path axis initialized by the operator with an active contour based pro-cess and (5) interactive contour editing on the same radial MPR reformations may be performed by the user, if needed. Once the segmentation was approved by the user, (6) a centerline based on the outer wall of the AAA and a 3D mathematical model of the AAA with distinct display for the thrombus and lumen were recon-structed and automatic calculation of D-max perpendicular to the new central line was processed. Finally, (7) manual markers were positioned at the level of the inferior renal artery at the neck of the aneurysm and aorto–iliac bifurcation (separation of common iliac arteries) to delineate AAA upper and lower limit planes for volume calculation (Fig. 1). The senior radiologist performed seg-mentations twice, on two separate sessions, at least one month apart. The first segmentation session was performed as a reference standard by reviewing the accuracy of the segmentation on all MPR views and doing any necessary correction to reach the same quality as a manual segmentation. The second segmentation session was performed to measure intra-observer reproducibility and record segmentation time. Segmentations were performed only once by unsupervised medical students to calculate inter-observer repro-ducibility.
Once the baseline and follow-up CT studies were segmented, those examinations were co-registered to allow longitudinal diameter and volume comparison. A 3D-3D registration pro-cess based on mutual information allowed superposition of
baseline and follow-up CTs with minimal entropy [18,19].
Quality control of the registration was determined by visual inspection. Following the registration, the proximal and distal landmarks positioned at baseline were automatically localized on the follow-up examination. Three-dimensional rendering of the AAA outer wall on the baseline and follow-up examination reveals shape and volume change over time for every patient (Fig. 2).
2.4. Statistical analyses
2.4.1. Patient demographics and aneurysm characteristics
Descriptive statistics of patient baseline demographics, interval between 2 MDCTs and mean AAA D-max at baseline and follow-up were calculated, with standard deviations. Paired Student’s t-tests were used to compare the D-max and volume obtained
Fig. 2. Three-dimensional mesh rendering of AAA lumen (red) and outer wall at baseline (green) and 3 years follow-up (blue) in 69-year-old man. The D-max was 58.5 mm at baseline and 74.3 mm at follow-up (27% relative growth). The volume was 202.9 ml at baseline and 327.3 ml at follow-up (61% relative growth). 3D-3D co-registration of baseline and follow-up examinations allow instantaneous volume comparison on the same dataset.
by medical students (T1, T2, T3) with the senior radiologist (R) (Fig. 3).
2.4.2. D-max and volume growth
D-max growth was compared in absolute difference (mm) and in relative difference (%) of baseline value. Relative D-max changes
were calculated using the following formula: [(D2− D1)/D1× 100].
Volume growth was also compared in absolute difference (ml) and in relative difference (%) of baseline value. Relative volume changes
were calculated using the following formula: [(V2− V1)/V1× 100].
Paired Student’s t-tests were used to compare absolute differences in D-max and volume growth between baseline and follow-up examinations.
2.4.3. Intra-observer and inter-observer reproducibility
Inter-observer (4 readers) and intra-observer reproducibility (senior radiologist) was assessed by the intraclass correlation coef-ficient (ICC) for D-max, volume calculation and their progression between examinations obtained by repeated segmentation for each reader.
2.4.4. Assessing agreement between readers
Bland–Altman analysis was performed to determine the agree-ment measureagree-ments by the senior radiologist (reference standard) and three unsupervised medical students. The bias was calculated as the average difference between the results of pairs of observers and the limits of agreement as the bias ± two standard deviations.
The repeatability coefficient CR = 1.96 ×
!"
(d2− d1)2/(n − 1)[20]was also calculated to compare our performance with previous
studies using manual segmentation. 2.4.5. Assessing growth significance
The significance of individual size changes was classified based on the repeatability coefficient.
Differences were considered significant at p < 0.05. Statistical analyses were performed using the SPSS software, version 18.0 (SPSS Inc., Chicago, IL).
2.4
Rupture Risk and Outcome
AAA rupture can be manifested along a continuum extending from impending rupture, contained rupture, intramural hemorrhage, to uncontained retroperitoneal or intraperitoneal blood extravasation (Figure 2.3).
Figure 2.3: Before/after rupture comparison in 78-year-old woman with AAA.
(A) Large unruptured AAA. (B) The same patient presented 5 days later, with signs of AAA
rupture: focal gap and displacement of mural calcifications (two arrows) and retroperitoneal hematoma adjacent to the rupture site (asterisk).
The rupture risk of small aneurysms is low, but the natural history of an untreated aneurysm is one of progressive expansion (43). The risk of rupture increases markedly when the Dmax exceeds 5.5 cm. AAA tend to rupture at a lower diameter in women than men, hence the lower threshold (4.5 - 5.0 cm) for treatment.
Among patients with AAA, few die from a ruptured aneurysm; most (66%) will die from another cardiovascular cause (34). However, a ruptured AAA has a grim prognosis, with a 90% mortality rate (9, 44). Death may occur before arrival to the hospital, during
*
surgical repair or after surgical repair. Since only 10-15% of patients survive an AAA rupture, there is a need to identify predictors of rupture risk (45).
AAA rupture risk increases with larger diameters. A prospective cohort study performed in 47 Veterans Affairs medical centers on 198 patients revealed a 1-year incidence of rupture of 9.4% for AAA 5.5 to 5.9 cm, 10.2% for AAA of 6.0 to 6.9 cm (19.1% for the subgroup of 6.5-6.9 cm), and 32.5% for AAA of 7.0 cm or more (8). The cumulative incidence of probable rupture, stratified by initial AAA diameter, revealed that the proportion of patients with AAA rupture in the ≥ 7.0 cm stratum was significantly higher than the other two strata (both p <0.01).
Similar results were found by Powell et al. in their meta-analysis of large AAA not considered for open repair, stratified by size < 6.0 and > 6.0 cm, and sex (46). The pooled rupture rates for the endovascular aneurysm repair unfit for open repair of AAA (EVAR 2) study was 9.7 per 100 person-years for AAA < 6.0 cm and 17.4 per 100 person-years for AAA ≥ 6.0 cm.
It has been suggested that the presence of thrombus within an AAA may increase the risk of rupture (47). Since this initial publication, the effect of intraluminal thrombus on rupture risk remained controversial and debated. The proponents of thrombus as a risk factor of rupture argue that intraluminal thrombus reduces oxygen supply to AAA wall, which leads to cell dysfunction, extracellular matrix degrading factors, and wall weakening (48, 49). Stenbaek et al. reported that a rapid increase of thrombus area may be a better predictor of AAA rupture than increase in maximal diameter in a cohort of 67 patients who underwent at least 2 CT examinations (32).
The proponents of a protective role hypothesize that thrombus may reduce and redistribute the stresses in the aortic wall (50), that the incompressibility and isotropic nature of this tissue has a mechanical cushioning effect (51) and reduces peak wall stress (52). Using a numerical method based on fluid solver for flow and solid solver for intraluminal thrombus and wall, Bluestein et al. suggested that a well-oriented thrombus generates a channel like geometry with streamlined flow patterns and appears to reduce the stress in the AAA wall significantly (33).
A recent study comparing the geometry of 10 ruptured and 66 unruptured aneurysms favored a protective role for thrombus since they identified lower ratios of intraluminal thrombus volume to aneurysm volume among their ruptured AAA than among unruptured AAA (53).
2.5
Screening and Surveillance
AAAs are not always symptomatic and may be difficult to detect on physical examination. Abdominal palpation does not have the sensitivity nor the specificity of ultrasound in screening for aneurysm (54). Two studies suggest that one-time ultrasound screening of men, at the age of 65, is sufficient to identify nearly all those who are at risk (55, 56). A trial involving 67 800 men in the United Kingdom demonstrated that screening halves the rate of aneurysm-related death within four years, but did not reduce overall mortality (4).
Ultrasound
Once aneurysms are identified, follow-up surveillance with ultrasound is indicated to monitor growth beyond diameter thresholds for surgery (34). In the United Kingdom Small Aneurysm Trial, the proposed screening intervals were 24 months for aneurysms AAA with diameters of 3.5 cm at baseline, 12 months for 4.0 cm, and 6 months for 5.0 cm (3).
Using an abdominal ultrasound probe (curved probe with a frequency range of 3 to 5 MHz) on a fasting patient lying in dorsal decubitus allows detection and measurement of AAA. An anterior approach allows the acquisition of longitudinal and transverse images of the aorta. Even when the aorta is obscured by intra-luminal gas in bowel structures, a left lateral approach may be used to record coronal and transverse images of the aorta. B-mode grayscale images allow detection of mural thrombus and calcifications (Figure 2.4). A color Doppler mode may help improve delineation of the thrombus and lumen. In addition, the pulsed Doppler mode allows assessment of patency of the main arterial branches originating from the aorta (renal arteries, celiac trunk, superior mesenteric artery, inferior mesenteric artery, and common iliac arteries).
Figure 2.4: AAA surveillance on abdominal ultrasound.
(A) Midline sagittal and (B) transverse images. Lumen is indicated by asterisks and
thrombus by arrows.
In a screening setting, ultrasound is the preferred modality due to its non-invasive nature, the absence of radiation, low cost, wide availability, and high patient acceptance. The Canadian Society for Vascular Surgery has issued the following guidelines for screening patients for AAA (57): population based screening program recommended for men 65 to 75 years of age who are candidates for surgery and are willing to participate, individualized investigation with ultrasound of women >65 years old with multiple risk factors for AAA (smoking history, cerebrovascular disease, family history of AAA), yearly abdominal ultrasound recommended for individuals with aneurysm 3.0 to 4.4 cm.
The precision of aortic diameter measurements by ultrasound is considered good. In a study performed on 112 patients by 4 different observers, the inter-observer variability on the measurement of the infra-renal aortic diameter was < 4 mm, and variability was similar for measurements in the antero-posterior and transverse planes (58). Variability was greater for measurements at the renal level than at the aortic bifurcation.
*
*
B A
Limitations of ultrasound include its operator-dependence, need for an unobscured acoustic window, and limited utility for identifying an impending rupture or a contained rupture in an acute clinical setting.
Ultrasound vs. Computed Tomography
The accuracy of screening for AAA by ultrasound has been compared with CT. In a study performed on 64 patients with AAA larger than 4.5 cm, the mean difference between ultrasound and CT measurements was 4 mm and the limit of variability was 12 mm (59). More importantly, no false negative ultrasound scans were found using a threshold of 3 cm as abnormal, which justified the use of this modality as a screening and surveillance tool.
However, in the follow-up of patients after endovascular aortic repair (EVAR), CT is the preferred modality. In a retrospective study performed on 125 patients with AAA treated by EVAR who underwent serial ultrasound and CT, the sensitivity and specificity of ultrasound compared to that of CT was 25% and 89% for endoleak detection (60). Considering the significant disagreement in AAA diameter change between the two modalities, CT remains the primary imaging study for endoleak surveillance post-EVAR.
Computed Tomography
In the setting of screening and surveillance of AAA, CT is considered a second-line modality given its higher cost and associated radiation. First-line evaluation of AAAs may occur occasionally in the setting of indicental discovery on CTs performed for other clinical indications, such as CT urography performed for evaluation of hematuria or CT colonography for detection of colorectal polyps (61).
However, in the setting of acute aortic syndrome, CT is the preferred modality for evaluation of a suspected or known AAA and is used to detect signs of rupture and surgical planning. This modality is favored for evaluation of acute aortic syndrome due to its widespread availability, proximity to emergency departments, rapid acquisition, ease of interpretation, and volumetric nature of the dataset that allows multi-planar reconstructions (62).
Magnetic Resonance Imaging
The advent of fast gradient-recalled echo (GRE) sequences allowed rapid acquisition of images during gadolinium bolus injection, similar to CT in quality. However, the longer acquisition time, additional contra-indications, and high cost reduce the availability and convenience of this imaging modality. Therefore, MR imaging is seldom used for evaluation of AAA and only reserved for patients who have a contraindication to CT such as iodinated contrast allergy or renal failure (63).
Computed Tomography vs. Magnetic Resonance Imaging
In a study comparing the accuracy and reliability of AAA diameter measurement based on multidetector CT and magnetic resonance angiography, the intermodality agreement was good to excellent (intraclass correlation coefficient of 0.62 to 0.98) with small differences between methods (range of agreement from -4.1 to 2.1 mm by Bland-Altman analysis) (64).
2.6
Diagnosis of unruptured and ruptured AAA
Symptoms and signs of unruptured AAA
Patients with unruptured abdominal aneurysms may be symptomatic and present with back pain, abdominal pain, and intermittent claudication. Physical examination may reveal a pulsatile abdominal mass, tenderness on aortic palpation, or groin pain (65).
Symptoms of ruptured AAA
Patients with ruptured AAA may present with the triad of hypotension (45%), abdominal pain (72%), and a pulsatile abdominal mass (83%) (66). Additional signs may include hypovolemia or shock due to hemorrhage.
Imaging findings in ruptured AAA
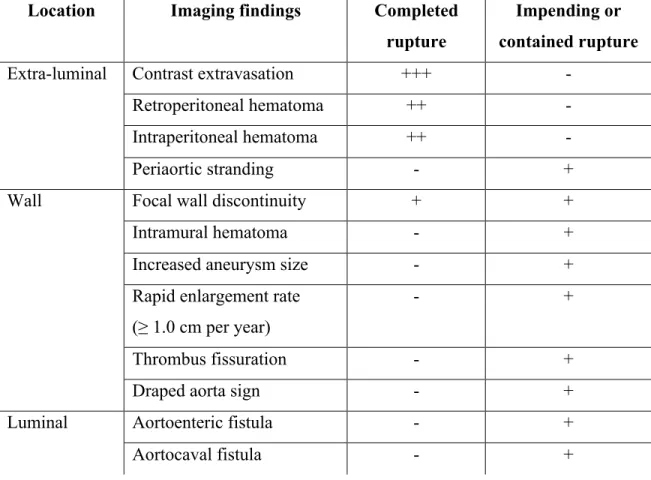
Table 1.1 lists the spectrum of imaging findings that may be observed in completed, impending or contained AAA rupture.
Table 1.1: Summary of imaging findings on CT indicating completed, impending or contained AAA rupture.
Location Imaging findings Completed
rupture
Impending or contained rupture
Extra-luminal Contrast extravasation +++ -
Retroperitoneal hematoma ++ -
Intraperitoneal hematoma ++ -
Periaortic stranding - +
Wall Focal wall discontinuity + +
Intramural hematoma - +
Increased aneurysm size - +
Rapid enlargement rate (≥ 1.0 cm per year)
- +
Thrombus fissuration - +
Draped aorta sign - +
Luminal Aortoenteric fistula - +
Aortocaval fistula - +
Legend: +++ very specific, ++ specific, + suggestive
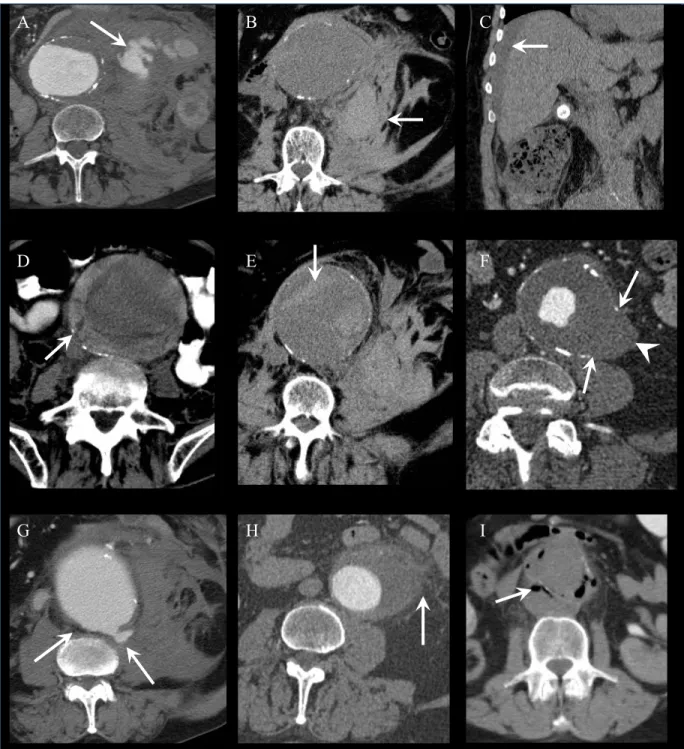
The most specific sign of rupture is the demonstration of contrast extravasation beyond the AAA outer wall (Figure 2.5 and 2.6.a). Examples of the most common signs of AAA rupture seen on CT are shown in Figure 2.6.
Figure 2.5: AAA rupture diagnosis on axial CT angiography.
Contrast-enhanced lumen is indicated by white asterisk, luminal calcification by arrowhead, rupture site by white arrow, contrast extravasation by black arrow, and retroperitoneal hematoma by black asterisk.
Since injection of iodinated contrast agent is often contraindicated in patients presenting with AAA due to uncertain history of allergy or acute renal failure, unenhanced CT may help depict several other signs of rupture. The most common sign is the demonstration of a retroperitoneal hematoma adjacent to an AAA (Figure 2.6.b). Blood may be found in the perirenal space, posterior pararenal space along the psoas, or anterior pararenal space. In severe bleeding, intraperitoneal blood (Figure 2.6.c) may also be seen along the mesenteric folds, paracolic gutters, perihepatic space, rectouterine, or rectovesical recesses.
Impending rupture may also be manifested by thrombus fissuration (Figure 2.6.d). This represents internal dissection of blood into the mural thrombus and may evolve toward an intramural hematoma, manifested by a hyperattenuating crescent sign (Figure 2.6.e).
*
Appearance of a new focal discontinuity in circumferential wall calcifications and focal bulge may indicate an unstable or ruptured aneurysm (Figure 2.6.f) (67, 68). A very large (>7 cm) aneurysm and an enlargement rate of ≥1.0 cm per year indicate a high likelihood of rupture. Another imaging sign that indicates impending or contained rupture is the "draped aorta sign" (Figure 2.6.g). This sign is considered present when the posterior wall of the aorta molds the contour of adjacent vertebral bodies and becomes indistinct from adjacent structures (62).
Inflammatory aneurysms, caused by retroperitoneal fibrosis or autoimmune diseases such as rheumatoid arthritis, lupus, and giant cell arteritis, may reveal periaortic stranding (Figure 2.6.h). Similarly, infected (mycotic) pseudoaneurysms that result from hematogenous seeding or direct spread from an adjacent vertebral ostemyelitis or from retroperitoneal abscesses may show periaortic stranding, periaortic gas, and abscess.
Although very rare, an AAA may erode into adjacent structures and fistulize. A primary aortoenteric fistula represents a complication of atherosclerotic AAA, and secondary a complication of AAA surgery. Aortoenteric fistulas most commonly involve the duodenum in its third and fourth portions. They will show periaortic gas (Figure 2.6.i). An aortoenteric fistula presents clinically with abdominal pain and gastrointestinal tract bleeding. Exceptionally, an AAA may erode into the inferior vena cava and result in an aortocaval fistula (not shown).
Figure 2.6: Signs of AAA rupture on CT in different patients.
(A) Contrast extravasation. (B) Retroperitoneal hematoma. (C) Intraperitoneal hematoma.
(D) Thrombus fissuration. (E) Intramural hematoma. (F) Focal wall discontinuity (arrow)
and focal bulge (arrowhead). (G) Draped aorta sign. (H) Periaortic stranding. (I) Periaortic
gas secondary to an aortoenteric fistula.
A B C
D E F
2.7
Management of AAA
Patients with large aneurysms should be referred to vascular specialists for optimization of medical treatment and evaluation for surgical repair or AAA suitability for EVAR (Figure 2.7).
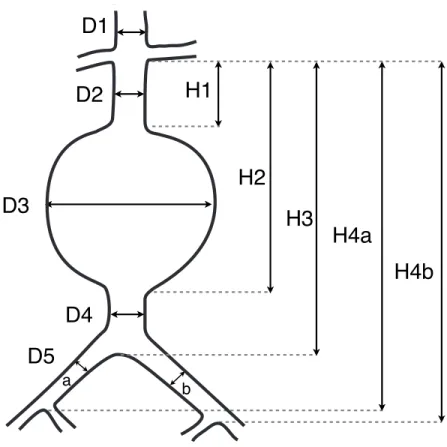
Figure 2.7: AAA measurements for stent graft sizing.
Schematic of the diameters and lengths AAA model. D1 = diameter of supra-renal aorta, D2 = diameter of aortic neck, D3 = maximum diameter of AAA, D4 = diameter of infra-renal aorta, D5 = diameter of common iliac artery (a, right; b, left), H1 = length of aortic neck, H2 = length from lowest renal artery to end of AAA, H3 = length from lowest renal artery to aortic bifurcation, H4 = length from lowest renal artery to iliac bifurcation (a, right; b, left).
D3
D2
H1
H2
D5
D1
D4
a bH3
H4a
H4b
2.7.1 Current Thresholds for Treatment
The American Association for Vascular Surgery (AAVS) in association with the Society for Vascular Surgery (SVS) have issued recommendations regarding AAA treatment (6). Current criteria to determine AAA treatment eligibility include: Dmax ≥ 5.5 cm in men, ≥ 4.5-5.0 cm in women, rapid expansion rate > 1 cm/year, or symptomatic AAA. These indications should be adapted to patient rupture risk, estimated mortality rate during an elective procedure, and life expectancy of patients.
2.7.2 Medical Treatment
The goal of medical therapy is to prevent small aneurysms below the treatment thresholds from reaching sizes at which rupture risk is high.
Smoking has been shown to be a risk factor of development and growth of AAA (39, 42). In a longitudinal study performed on 1743 patients, aneurysms had a higher growth rate in current smokers than in former smokers. The risk of rupture and death attributable to rupture were higher among current than former smokers and patients who never smoked. The corollary is that smoking cessation aims to reduce the growth rate and rupture risk of AAA.
There is limited or conflicting evidence on the impact of drug treatment on AAA growth rate. Several studies have explored the role of antihypertensive (angiotensin converting enzyme inhibitors, ß-blockers), statins, low dose aspirin, antioxidants, and antibiotics (doxycycline) in the reduction of AAA growth rate or peri/postoperative cardiovascular morbidity and mortality.
2.7.3 Surgical Treatment
Open aneurysm repair was first described by Charles Dubost in 1951 (12) when he first treated an aortic aneurysm with a homograft to prevent rupture.
Open aneurysm repair, the standard treatment, requires general anesthesia, a large incision, and extensive operative dissection of the retroperitoneal space to suture a Dacron graft to the aorta above and below the aneurysm (Figure 2.8). The perioperative mortality is high. The best centers perform open surgical repair at aneurysm-related mortality rates <5%, although the risk of death can be >10% in patients with poor renal function or comorbidities (34, 69, 70).
In addition to mortality directly related to open surgical repair, secondary surgical procedures required to treat complications may also contribute to mortality (69).
Figure 2.8: Schematic of open surgical repair.
(A) Schematic of infrarenal AAA before, and (B) after open surgical repair with
aorto-biiliac graft. (Medical illustrations by Ivan Dominguez for An Tang)
Postoperative complications may be related to aortic cross-clamping or a hypovolemic state (renal insufficiency, ureteral necrosis), the patient condition (pulmonary complications, myocardial ischemia), the surgical procedure (anastomotic pseudo-aneurysms, anastomotic stenosis, graft thrombosis, graft infection), or delayed complications (recurrent aneurysms, peri-prosthetic effusion).