HAL Id: tel-03159383
https://hal.univ-lorraine.fr/tel-03159383
Submitted on 4 Mar 2021
HAL is a multi-disciplinary open access
archive for the deposit and dissemination of sci-entific research documents, whether they are pub-lished or not. The documents may come from teaching and research institutions in France or abroad, or from public or private research centers.
L’archive ouverte pluridisciplinaire HAL, est destinée au dépôt et à la diffusion de documents scientifiques de niveau recherche, publiés ou non, émanant des établissements d’enseignement et de recherche français ou étrangers, des laboratoires publics ou privés.
production de kaolin
Q. Dehaine
To cite this version:
Q. Dehaine. Récupération des Terres Rares (La, Ce, Nd) et métaux rares (Sn, Nb, W) à partir de résidus micacés issus de la production de kaolin. Chemical Sciences. Université de Lorraine, 2016. English. �NNT : 2016LORR0019�. �tel-03159383�
AVERTISSEMENT
Ce document est le fruit d'un long travail approuvé par le jury de
soutenance et mis à disposition de l'ensemble de la
communauté universitaire élargie.
Il est soumis à la propriété intellectuelle de l'auteur. Ceci
implique une obligation de citation et de référencement lors de
l’utilisation de ce document.
D'autre part, toute contrefaçon, plagiat, reproduction illicite
encourt une poursuite pénale.
Contact : ddoc-theses-contact@univ-lorraine.fr
LIENS
Code de la Propriété Intellectuelle. articles L 122. 4
Code de la Propriété Intellectuelle. articles L 335.2- L 335.10
http://www.cfcopies.com/V2/leg/leg_droi.php
Ecole Doctorale RP2E
Thèse de doctorat présentée en vue d’obtenir le titre de
Docteur de l’Université de Lorraine (Spécialité: Géosciences)
par Quentin DEHAINE
Récupération des Terres Rares (La, Ce, Nd) et
métaux rares (Sn, Nb, W) à partir de résidus
micacés issus de la production de kaolin
Rare Earths (La, Ce, Nd) and rare metals (Sn, Nb, W) recovery from
micaceous waste of china clay production
Thèse soutenue publiquement le 31 Mars 2016 Membres du Jury:
Hylke J. Glass, Professor, University of Exeter, CSM . . . .Rapporteur Claude Bazin, Professeur, Université Laval . . . Rapporteur François Martin, Professeur, Université Paul Sabatier . . . Examinateur Stéphane Brochot, Docteur, CASPEO . . . .Examinateur Michel Cathelineau, Directeur de recherches CNRS, Laboratoire GéoRessources . .Examinateur Pierre Daniellou, Industrial Manager Kaolin Activity, Imerys . . . Invité Lev Filippov, Professeur, Université de Lorraine . . . .Directeur
Vandoeuvre-lès-Nancy, France April 5, 2016
Romain Gary, Charge d’âme
jet préoccupant pour l’industrie européenne. Les granites à métaux rares, en rai-son de leurs faibles teneurs en métaux, ont toujours été considérés comme ayant une faible valeur économique mais, lorsqu’ils sont altérés, ils sont souvent exploités pour les minéraux industriels. L’objectif du présent travail est d’évaluer la potentialité des résidus micacés issus de la production de kaolin pour la récupération des Terres Rares légères (LREE), Nb, W et Sn, au travers du développement d’un procédé de valorisation de ces résidus dans le cas des kaolins de St Austell.
Le granite de St Austell, à l’origine des dépôts de kaolin, est composé de 6 types de granites ayant chacun leur propre cortège de minéraux accessoires. Ces derniers, libérés par le processus de kaolinisation, sont majoritairement pré-concentrés dans le résidu micacé du procédé de traitement de kaolin, notamment pour les zones couvrant le granite à biotite. Les teneurs en CRMs atteignent 170 ppm LREE (Ce, La, Nd), 140 ppm Sn, 94 ppm Nb et 70 ppm W, ceux-ci étant principalement distribués dans les fractions fines (-100 µm). Une approche statistique combinée aux observations minéralogiques a montré que les LREE sont uniquement portés par la monazite et que Sn, Nb et W sont respectivement portés par la cassiterite, le rutile et la wolframite.
La prise en compte de la variabilité des propriétés du flux de résidu considéré, tels que les teneurs, la granularité, etc., est primordiale. Le développement du mul-tivariogramme a permis de résumer la variabilité globale de l’ensemble des propriétés considérées en une fonction unique soulignant les structures communes à ces propriétés. Un procédé de traitement du résidu micacé combinant concentration gravimétrique (spirale, table à secousses, Falcon) et flottation a été testé sur les fractions 53-180 µm et -53 µm. Une modélisation par la méthode des plans d’expériences montre que le débit d’eau de lavage de la spirale est le facteur le plus significatif pour la récupération des minéraux denses. De la même manière, la modélisation des courbes de distribution par taille via des modèles de régression permet de mieux comprendre les mécanismes de séparation ayant lieu au sein de la spirale (effet de Bagnold, circulations secondaires). Jusqu’à 70% des minéraux denses peuvent être récupérés après trois passages de spirale tandis que le même niveau de récupération pour les LREE est obtenu en un seul passage. Le traitement du concentré de spirale par table à secousses permet d’obtenir un concen-tré à 1.6% LREE. La flottation de la monazite dans la fraction -53 µm est globalement plus performante que la séparation centrifuge (Falcon UF). L’utilisation de dispersant lors du deschlammage élimine l’effet néfaste des argiles et augmente l’efficacité de la flottation, en particulier avec l’oléate de sodium, permettant de récupérer jusqu’à 80% des LREE avec une teneur de 0.54% LREE.
Une méthode d’évaluation des ressources, intégrant les résultats de caractérisation et des tests de valorisation, est proposée afin de prédire les performances du procédé de récupération des CRMs, ce qui permettra d’aller vers l’établissement d’un modèle géométallurgique.
Light Rare Earth Elements (LREE) became a concern for the European industry. Rare metals granites have always been considered of poor economic value due to their low grades but, when altered, they are often exploited for their industrial minerals. This work addresses the recovery of LREE (La, Ce, Nd) and rare metals (Sn, Nb, W) from St Austell (UK) kaolin residues though the development of a dedicated beneficiation process.
The St Austell granite is composed of six major granite types, each one having its own accessory mineral assemblage. As a consequence of the kaolinisation process, these accessory minerals are partially liberated from the gangue which allows their pre-concentration in some residues of the kaolin production route. Results shows that when processing material from biotite granite, 40% to 60% of the CRMs goes to the micaceous residue stream with CRM grades around 170 ppm LREE, 140 ppm Sn, 94 ppm Nb et 70 ppm W. The overall CRMs grade increases in the fines fractions of the residue in which the majority of the CRMs are distributed. A combined statistical/mineralogical approach has allowed identifying monazite as the only LREE-bearing mineral as well as cassiterite, wolframite and rutile as the major host for Sn, Nb and W respectively.
Taking into account the variability of the properties of the residue treated such as grade or particle sizes is essential. A multivariate variographic approach has been developed to summarize the overall spatial variability of a set of properties by one structural function and thus highlight their common spatial structures.
A CRMs beneficiation process combining gravity (spiral, shaking table, Falcon) and flotation has been tested on the 53-180 µm and –53 µm fractions of the micaceous residue. Modelling of the influence of the operating parameters on spiral performance using the design of experiments methodology (DOE) shows that wash water flow rate as the most significant effect on heavy minerals recovery. Similarly, modelling size recovery curves through particle size distribution and DOE regression model fitting allow a better understanding of the effect of wash water on separation mechanism (Bagnold effect and secondary flows). Up to 70% heavy minerals recovery is achieved after three spiral passes at low wash water addition whereas the same recoveries are obtained for the LREE in only one pass. Processing of spiral concentrate by shaking table allow to obtain a 1.6% LREE concentrate. Froth flotation of monazite in the -53 µm fraction is generally more efficient than centrifugal separation (Falcon UF). The use of dispersant in the desliming step eliminates the negative effect of clay-coating and increases flotation efficiency, especially with sodium oleate, allowing to recover 80% of the LREE in the floated product with a 0.54% LREE grade.
A resources evaluation method, using results from characterisation and metallur-gical testing, is proposed to predict the performance of spiral concentration and goes towards the development of a geometallurgical model.
Organization of this manuscript
This manuscript includes one introductory chapter, a chapter dedicated to materials and methods, five chapters presenting the main results of this PhD work, a general discussion, a conclusion and seven appendices.
The five results chapters are presented under the form of scientific articles, pub-lished, submitted or to be submitted to international journals. These papers can be addressed independently from the rest of the manuscript, and have their own introduc-tion, materials and methods and discussion with sometimes an independent bibliogra-phy (published articles only).
Organisation de ce manuscrit
Ce manuscrit comporte un chapitre introductif, un chapitre dédié aux matériels et méthodes, cinq chapitres présentant les principaux résultats de cette thèse, une discus-sion générale, une concludiscus-sion et sept annexes.
La plupart des chapitres partagent des références bibliographiques communes, réper-toriées en fin de manuscrit. Les cinq chapitres centraux sont organisés sous forme d’articles scientifiques, publiés ou soumis à des revues internationales ou en voie de soumission. Ces articles peuvent être abordés indépendamment du reste du manuscrit, et comporte une introduction, des matériels et méthodes et une discussion avec parfois leur propres références bibliographiques (articles publiés uniquement).
fait preuve tout au long de ma thèse, pour son expertise et ses conseils avisés qui m’ont permis d’aller dans la bonne direction.
J’adresse mes plus vifs remerciements à Claude Bazin et Hylke J. Glass pour avoir accepté de rapporter ce mémoire ainsi qu’aux autres membres du jury: François Martin, Stéphane Brochot, Michel Cathelineau et Pierre Daniellou, pour avoir accepté d’évaluer ce travail de thèse.
Je souhaite remercier les membres du projet STOICISM au sein d’Imerys Ltd. UK, notamment David Moseley, Maretva Baricot et Becky Prall, pour la gestion du projet, et plus particulièrement Saeid Moradi, Pankaj Chauhan et Alex Coe qui ont assuré la préparation et l’envoi d’échantillons et pour l’aide apportée lors de mes nombreuses visites au Par Moor Center. Je tiens aussi à remercier les membres de l’équipe géolo-gie, Jonathan Hodgins, Richard Hooper, Ben Thompson et Éric Sennavoine pour leur accueil chaleureux et leur aide lors des missions d’échantillonnage. Un grand merci également à Steve Lightfoot et Peter Budge pour le soutien logistique et technique lors de l’échantillonnage de l’usine de traitement.
Je suis reconnaissant envers Robert Joussemet, aka Bob, pour ses nombreux conseils et critiques concernant la concentration par gravité ainsi que son aide précieuse pendant les essais. Je remercie chaleureusement tout le personnel du bâtiment A. En particulier Christophe, Fred et Jean-Marie pour leur aide au cours de mes nombreuses manips’ à la station STEVAL, les meilleures comme celles du vendredi car comme dit l’adage « manip’ du vendredi, manip’ pourrie » (Gauthier et al., 2015). Je tiens également à m’excuser pour les longues heures passées à tamiser, quarter, sécher près de 4 tonnes d’échantillons en cumulé pour l’ensemble de ses travaux ! Une bonne ambiance de travail et une bonne humeur générale facilitent grandement la vie au laboratoire. Aussi, je n’oublie pas mes voisines de bureau, les irréductibles du rez-de-chaussée: les chimistes Pabla et Christine, ainsi que Monique pour leur bonne humeur, le café (et les gâteaux) qui aident à tenir le rythme au quotidien. J’adresse mes plus vifs remerciements à mes amis de thèse ayant déjà soutenu ou qui soutiendront bientôt. Un grand merci donc à Agathe, Guillaume & Guillaume, Léo, Mathilde, Olga, Oumar, Patrice, Rémi, Sébastien, Viacheslav et Zineb ainsi qu’aux étudiants que j’ai pu encadrer lors de projets labos ou stages master: Khan, Alix, Baptiste, Eglantine et Cecilia. Enfin je remercie également les chercheurs avec qui j’ai eu l’occasion de collaborer et d’échanger au cours de ces 3 années, Jean Jacques Royer, Inna Filippova, Jacques Yvon, Philippe Marion et j’en oublie sûrement.
Je tiens à remercier mes parents, mes frères et sœurs ainsi que tous mes proches qui m’ont épaulé tout au long de ma scolarité et qui, j’en suis sûr, sont heureux de pouvoir dire que j’ai (enfin) terminé mes études ! Merci aussi à Floriane qui partage ma vie (et même mon travail sur la fin de cette thèse), qui m’a soutenu (et supporté!) tout au long de ces 3 années.
Ce travail a reçu le support financier du projet “ Sustainable Technologies for Industrial Minerals Calcined in Europe” (STOICISM) du 7e Programme Cadre (FP7) européen,
1 Introduction 1
1.1 Scope of the study . . . 1
1.1.1 The European Raw Material Initiative . . . 2
1.1.1.1 Raw materials supply in Europe. . . 2
1.1.1.2 Defining Critical Raw Materials . . . 2
1.1.1.3 Applying the methodology : list of critical raw materials 3 1.1.2 CRMs (LREE, Nb-Ta, W) and Sn consumption . . . 5
1.1.3 The STOICISM project . . . 8
1.1.3.1 Project summary . . . 8
1.1.3.2 Project partners and consortium structures . . . 9
1.1.3.3 Task 2.6 CRM Recovery . . . 10
1.2 Geological background . . . 11
1.2.1 The Cornubian Sn-W province . . . 11
1.2.2 The St Austell rare-metal granite . . . 13
1.2.3 Similarities with granites-based kaolin deposits worldwide . . . . 15
1.3 Kaolin from St Austell . . . 17
1.3.1 St Austell Kaolin deposits . . . 17
1.3.2 Kaolin extraction . . . 19
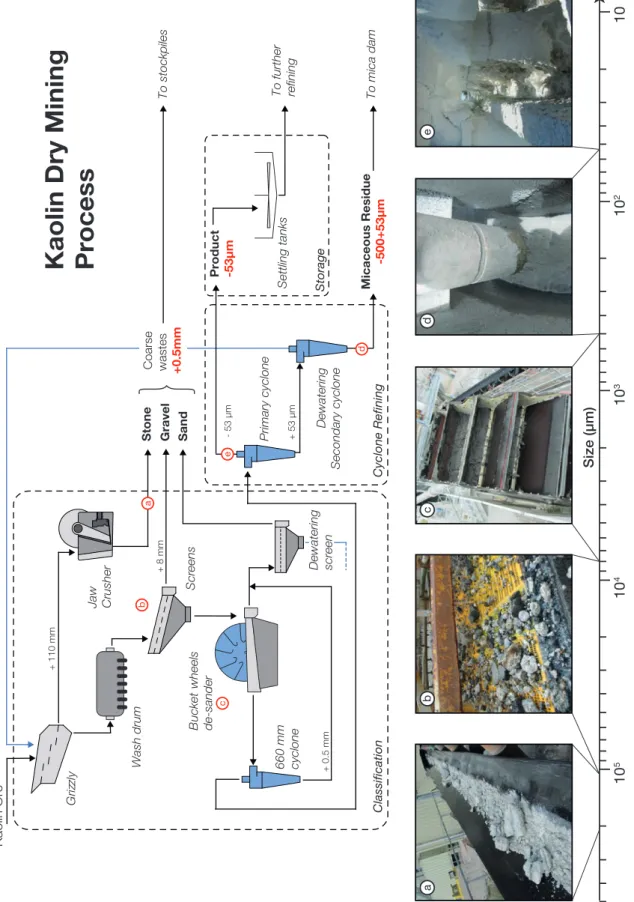
1.3.3 Kaolin dry mining processing . . . 20
1.3.4 Waste management . . . 22
1.4 Literature review . . . 22
1.4.1 CRMs (LREE, Nb-Ta, W) and Sn as by-products . . . 22
1.4.2 CRM-bearing minerals processing overview . . . 25
1.4.2.1 Monazite processing . . . 26 1.4.2.2 Cassiterite processing . . . 27 1.4.2.3 Columbite-tantalite processing . . . 29 1.4.2.4 Wolframite processing . . . 30 1.4.3 Gravity concentration . . . 31 1.4.3.1 Principle . . . 33
1.4.3.2 The unit processes of gravity concentration/choice of equipment . . . 34
1.4.3.3 Gravity processing of fine particles . . . 37
1.4.4 By-product recovery of CRMs and Sn from kaolin production . 38 1.4.4.1 Beneficiation of Sn as by product of Beauvoir kaolins . 38 1.4.4.2 Previous work at St Austell . . . 40
1.5 Study objectives. . . 41
1.5.1.1 Process development for CRMs recovery from kaolin
residue. . . 42
1.5.1.2 Evaluate representativeness of process samples . . . 45
1.5.1.3 Geometallurgy and by-product resource estimation . . 46
1.5.2 Industrial challenge . . . 46
2 Materials and methods 49 2.1 Materials sampling and sample preparation. . . 50
2.1.1 Waste streams sampling for waste selection and characterisation 50 2.1.1.1 Sampling of waste streams . . . 50
2.1.1.2 Sub-sampling and sample preparation . . . 52
2.1.2 Micaceous residue sampling for metallurgical testing and vario-graphic analysis . . . 52
2.2 Chemical analysis . . . 54
2.2.1 Inductively Coupled Plasma (ICP) analysis . . . 54
2.2.2 X-Ray Fluorescence (XRF) analysis . . . 55
2.3 Material Characterisation . . . 59
2.3.1 Particle size analysis . . . 59
2.3.2 Heavy medium separation . . . 59
2.4 Mineral Characterisation . . . 60
2.4.1 X-Ray diffraction (XRD) analysis . . . 60
2.4.2 Zeta potential . . . 61
2.4.3 Scanning electron microscopy . . . 61
2.4.4 Electron microprobe analysis. . . 62
2.5 Mineral processing . . . 63 2.5.1 Sample pre-treatment. . . 63 2.5.2 Gravity processing . . . 64 2.5.2.1 Spiral concentrator . . . 64 2.5.2.2 Shaking table . . . 66 2.5.2.3 Falcon concentrator . . . 67 2.5.3 Jar-tests . . . 69 2.5.4 Froth flotation. . . 70
3 Selection and characterisation of the most valuable stream 73 3.1 Introduction . . . 74
3.2 Selection and characterisation of the valuable stream from WADM plant 74 3.3 Comparison with other locations. . . 88
3.4 Conclusion . . . 91
4 Sampling representativeness for metallurgical testing 93 4.1 Introduction . . . 94
4.1.1 Theory of Sampling . . . 94
4.1.2 Classical variographic approach . . . 95
4.1.3 On the multivariate aspects of heterogeneity . . . 97
4.1.4 Application of multivariate variograms to process sampling . . . 98
4.2 Materials and methods . . . 99
4.2.1 Material sampling . . . 99
4.2.3 Chemical analysis . . . 99
4.2.4 Particle size analysis . . . 100
4.3 Results . . . 100
4.3.1 Experimental individual variograms . . . 100
4.3.2 Variograms on PCA scores . . . 103
4.3.3 Multivariogram . . . 105
4.3.3.1 Multivariogram applied to heterogeneity contributions 105 4.3.3.2 Multivariogram applied to PCA scores . . . 108
4.4 Discussion . . . 110
4.5 Conclusion . . . 111
5 Gravity processing of the selected residue 113 5.1 Gravity processing of the micaceous residue . . . 114
5.1.1 Introduction . . . 114
5.1.1.1 Gravity processing of low grade ores . . . 115
5.1.1.2 Response surface method (RSM) . . . 115
5.1.2 Materials and methods . . . 116
5.1.2.1 Material . . . 116
5.1.2.2 Chemical analysis. . . 117
5.1.2.3 X-Ray Diffraction (XRD) . . . 117
5.1.2.4 Gravity concentration set-ups . . . 117
5.1.2.5 Experimental designs . . . 118
5.1.3 Results . . . 119
5.1.3.1 Spiral pre-concentration . . . 119
5.1.3.2 Table testing . . . 126
5.1.3.3 Overall performance of the tested flowsheet for metal recovery . . . 130
5.1.4 Conclusion . . . 130
5.2 Modelling heavy and gangue mineral size recovery curves in spiral con-centration . . . 132
5.2.1 Introduction . . . 132
5.2.2 Materials and methods . . . 132
5.2.2.1 Materials . . . 132
5.2.2.2 Spiral set-up . . . 133
5.2.2.3 Particle size analysis and modelling . . . 134
5.2.2.4 Partition curve calculation . . . 135
5.2.2.5 Design of experiments . . . 136
5.2.3 Results . . . 136
5.2.3.1 Size recovery curve modelling . . . 138
5.2.4 Discussion . . . 144
5.2.5 Conclusion . . . 146
6 Processing of fines 149 6.1 Introduction . . . 150
6.1.1 Froth flotation of monazite . . . 151
6.1.2 Falcon UF concentrator . . . 151
6.1.3 Effect of clay slimes on mineral processing . . . 151
6.2.1 Material . . . 152 6.2.2 Jar tests . . . 152 6.2.3 Chemical analysis . . . 153 6.2.4 Zeta potential . . . 153 6.2.5 Flotation . . . 153 6.2.6 Falcon concentrator . . . 153 6.3 Results . . . 154
6.3.1 Selection of the dispersing agent . . . 154
6.3.2 Flotation . . . 155
6.3.2.1 Comparing flotation performance with different reagents 155 6.3.2.2 Enhancing flotation performance with dispersion . . . 156
6.3.3 Falcon UF results . . . 159
6.3.3.1 Saturation tests . . . 159
6.3.3.2 Effect of rotation speed . . . 161
6.4 Discussion . . . 162
6.5 Conclusion . . . 165
7 Towards a geometallurgical model 167 7.1 Introduction . . . 168
7.2 Materials and methods . . . 169
7.2.1 Sampling . . . 169
7.2.1.1 Sample processing protocol . . . 169
7.2.1.2 Sub-sampling of core samples for calibration . . . 170
7.2.2 Pilot-scale gravity concentration testing. . . 170
7.2.3 Multivariate calibration/PLS regression . . . 170
7.2.4 Methodology . . . 171
7.3 Chemical database correction . . . 172
7.3.1 Metal grade calibration . . . 172
7.3.2 Multivariate LREE grade calibration . . . 173
7.3.3 Relationship between some elements and oxides . . . 176
7.4 Prediction of process performance . . . 176
7.4.1 Effect of feed grade . . . 176
7.4.2 Effect of particle size . . . 180
7.5 Potential application to core sample data . . . 182
7.6 Conclusion . . . 184
8 General discussion 185 8.1 CRM recovery process proposal . . . 185
8.2 Evaluating project profitability . . . 189
8.2.1 Capital costs estimation . . . 189
8.2.2 Revenue . . . 190
8.3 On the micaceous residue commercial potential . . . 192
9 Conclusions and Perspectives 195 9.1 General Conclusion . . . 195
9.2 Perspectives . . . 198
Appendices i
A Introduction appendices iii
A.1 CRMs applications and uses . . . v
B Materials and methods appendices vii B.1 Rotational divider setups . . . ix
B.2 ICP analysis uncertainties . . . x
B.3 XRF analysis calibration (major elements) . . . xi
B.4 XRF analysis calibration (trace elements). . . xii
B.5 Comparison of particle size analysis techniques . . . xiii
B.6 Operating conditions of flotation tests. . . xiv
C Multivariate variographic study appendices xvii C.1 Summary statistics of variogram model fitting . . . xix
D Size recovery curves modelling appendices xxi D.1 Example of size recovery curve calculation . . . xxiii
D.2 Analyses of variance (ANOVA) . . . xxiv
E Geometallurgical modelling appendices xxv E.1 Calibrated GT53 core sample data . . . xxvii
F Discussion appendices xxix F.1 Global material balance . . . xxxi
F.2 Process equipment selection and costs estimations . . . xxxii
G List of publications xxxv G.1 Articles . . . xxxvii
1.1 Criticality diagram . . . 4
1.2 World map of major CRMs (and Sn) producers . . . 5
1.3 The main global uses of CRMs (Nb, Ta, W) and Sn in 2010 . . . 7
1.4 Consortium structure . . . 9
1.5 Spatial relationship at distinct geological scales between Variscan gran-ites and Sn-W deposits . . . 12
1.6 Geological map of the St Austell granite . . . 14
1.7 Trace-element characteristics of peraluminous and peralkaline granites . 16 1.8 Geological E-W cross section through a typical kaolin deposit . . . 19
1.9 Imerys kaolin extraction methods at St Austell . . . 21
1.10 Simplified flowsheet of the Western Area Dry Mining (WADM) process 23 1.11 Simplified flowsheet for the extraction of monazite and xenotime from placer deposits . . . 27
1.12 Generalised Nb-Ta minerals gravity concentration flowsheet. . . 30
1.13 Simplified flowsheets illustrating the generic steps of CRMs processing. 32 1.14 The major classifications of gravity concentration methods . . . 34
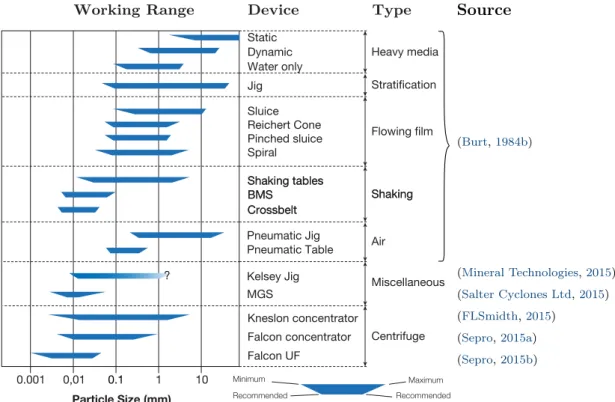
1.15 Working particle size range of gravity concentration equipments . . . . 35
1.16 Comparison of the performance of various fine gravity concentrators . . 37
1.17 Flowsheet of the Beauvoir kaolin beneficiation and by-product concen-tration process . . . 39
1.18 Comparison of distinct size-classified products from the St Austell and Beauvoir kaolin plants . . . 40
1.19 The increasing importance of low grade ores for metal supplies . . . 43
1.20 Relative change of terminal velocity with enhanced gravity . . . 44
2.1 Simplified flowsheets of the dry mining and hydraulic mining processes 50 2.2 Weal Martyn sampling exercise . . . 51
2.3 Sample preparation protocol for chemical analysis for each kaolin waste streams . . . 53
2.4 Sampling of micaceous residue . . . 54
2.5 Typical XRF spectra . . . 56
2.6 Sample pre-treatment flowsheet for the micaceous residue . . . 63
2.7 Partition curves for the 1stand 2nd screening operations . . . . 64
2.8 Pilot scale experimental set-up for closed-circuit spiral testing . . . 65
2.9 Experimental set-up for Wilfley shaking table testing . . . 67
2.10 Falcon L40 SB and UF bowls schematics . . . 68
2.11 Laboratory scale experimental set-up for Falcon L40 testing.. . . 69
2.13 Agitair flotation machine . . . 71 3.1 CRMs concentration patterns of the 3 investigated locations . . . 88 3.2 Distribution of CRMs and Sn within the output of 3 investigated locations 89 4.1 Schematic representation of the 3 sampling modes for 1D processes . . 95 4.2 Scheme illustrating the information that can be exploited from the
var-iogram plot . . . 97 4.3 Analytical results that show the variations of the selected properties vs.
unit number . . . 101 4.4 Individual heterogeneity contributions of the 8 selected properties . . . 101 4.5 Experimental variograms, average first and second order integrals of the
8 selected properties . . . 102 4.6 Standard deviation of the sampling error for LREE content vs. number
of units collected . . . 103 4.7 3D biplot of the 3 first principal components . . . 104 4.8 Experimental variograms, average first and second order integral of the
4 first PCs . . . 106 4.9 Multivariograms computed with MD for each property’s class. . . 107 4.10 Global relative standard deviation of the sampling error vs. number of
units collected. . . 108 4.11 Influence of the number of principal components on the multivariogram
shape and standard deviation of the sampling error . . . 109 5.1 Typical washability of the micaceous residue sample . . . 118 5.2 Comparison between observed and predicted results using regression
models . . . 121 5.3 Residual plot for predicted recovery and grade . . . 122 5.4 Response surface plots showing the influence of wash water flow rate
and pulp density on heavy minerals grade and recovery . . . 124 5.5 Iso-response surface of heavy minerals grade and recovery in spiral
con-centrate as a function of wash water flow rate and feed pulp density . . 124 5.6 Cumulated yield, recovery and heavy minerals mean grade of the spiral
concentrates as a function of the number of passes . . . 125 5.7 Evolution of the XRD pattern of the sink fraction (SG>2.89) in spiral
concentrates as a function of the number of passes . . . 126 5.8 Comparison between observed and predicted recovery using empirical . 128 5.9 Effect of deck angle and motion frequency on shaking table performance 129 5.10 Cumulative LREE grade and recovery of gravity concentrates of all the
spiral tests and shaking table tests . . . 131 5.11 Typical particle size distribution of the raw micaceous residue and 3
specific gravity fractions . . . 133 5.12 Illustration of the fitting procedure for particle size analysis data. . . . 135 5.13 Effect of wash water flow rate on size recovery curves for a constant pulp
density value . . . 138 5.14 Effect of pulp density on size recovery curves for a constant wash water
5.15 Relationship between observed and predicted heavy mineral recovery results . . . 139 5.16 Heavy mineral and gangue mineral partition curve variations for
increas-ing wash water flow rates with fixed pulp density . . . 141 5.17 Comparison between observed and predicted size-by-size recoveries of
heavy and gangue minerals . . . 141 5.18 3D surface plot of heavy and gangue mineral size recovery curves as a
function of wash water flow rate . . . 142 5.19 Heavy mineral and gangue mineral size enrichment ratio variations for
increasing wash water flow rates with fixed pulp density . . . 143 5.20 Summary of the pulp density influence on gangue mineral size recovery
curves . . . 144 5.21 Schematic of the effect of wash water on particle distributions along the
spiral trough flow with respect to their size and specific gravity. . . 146 6.1 Flowsheet of the flotation experiments . . . 154 6.2 Effect of dispersant type and dosage on sedimentation curves . . . 155 6.3 LREE grade and recovery in the flotation products . . . 156 6.4 Comparison of LREE flotation performance with and without dispersion 157 6.5 Zeta potential of kaolinite, biotite and muscovite, completed with zeta
potential of monazite . . . 158 6.6 Effect of feed mass on Falcon UF concentrate mass and yield sith raw
and deslimed -53 µm residue samples . . . 159 6.7 Effect of bowl saturation on Falcon UF separation performance on raw
and deslimed -53 µm residue samples . . . 160 6.8 Effect of bowl rotation speed on LREE grade and recovery . . . 162 6.9 Comparison of the performance of the different beneficiation methods
tested in this study . . . 164 7.1 Sample treatment protocol of the geometallurgical program . . . 169 7.2 Subsampling procedure . . . 171 7.3 Outline of the methodology used in this work . . . 172 7.4 ICP vs. PT XRF analysis regressions plots for calibration. . . 173 7.5 PLS Regression model for LREE prediction . . . 175 7.6 Binary linear correlation plots and trend lines between elements using
ICP analysis chemical data . . . 177 7.7 Prediction of the performance of the rougher spiral concentration process
for LREE as a function of normalised LREE feed grade . . . 178 7.8 Comparison between predicted and measured spiral performance . . . . 179 7.9 Mean particle size distribution of the GT53 core samples, the spiral feed
and the spiral concentrate . . . 181 7.10 Distribution of LREE Recovery applied to GT53 core samples for Melbur
and Wheal Remfry pits . . . 182 7.11 Graphic log showing the application of the data calibration and process
performance prediction models to the ML11S041 drill core . . . 183 8.1 Flowsheet proposal for the beneficiation of CRMs from micaceous residue 186
8.2 Quantitative flowsheet proposal for the beneficiation of CRMs from mi-caceous residue . . . 188 8.3 Estimated material balance of the micaceous residue beneficiation process 189 B.1 Rotational divider setups . . . ix B.2 Uncertainties and limits of detection (LOD) for trace and major element
analysis by ICP . . . x B.3 Relationship between the estimated concentrations obtained by XRF
analysis against concentration measured by ICP-OES analysis for major elements . . . xi B.4 Relationship between the estimated concentrations obtained by XRF
analysis against concentrations measured by ICP-MS for trace elements xii B.5 Comparison between particle size analysis obtained with the Rotap
ap-paratus (seiving) and with laser light scattering . . . xiii E.1 Distribution and Box and Whisker plots of calibrated GT53 Nb, Sn and
1.1 Rare Earth Elements consumption by application . . . 6 1.2 Mineralogy of the six major granite types of the St Austell rare-metal
granite . . . 15 1.3 Classification of the kaolin resources. . . 18 1.4 Production of rare earth elements as by-product in 2009 . . . 24 1.5 Proportions of each sources for the global tantalum supply in 2008 and
2012 . . . 25 1.6 List of potential CRM-bearing minerals of the St Austell granite and
their physical properties . . . 26 1.7 Comparison between operating size range, capacity, energy and water
consumption of various gravity concentration devices . . . 36 2.1 List of samples and sample weights for the 3 considered locations . . . 52 2.2 XRF analysis measurement method information . . . 57 2.3 Evaluation of the efficiency of the external calibration for the classical
XRF analysis method using the validation set . . . 58 2.4 Specifications of the Malvern Mastersizer 3000 . . . 59 2.5 Specifications of Zetaphoremeter IV . . . 61 2.6 Structure of water-soluble polymers used in this study. . . 70 3.1 Average distributions (in wt.%) by ore grade . . . 88 3.2 CRM content of the output streams of the 3 investigated locations . . . 90 4.1 Eigenvalues, explained variability and significance of the score
vari-ograms of each PC . . . 105 4.2 Comparison summary that lists the advantages and disadvantages of the
3 variographic approaches in this study . . . 111 4.3 Summary of the distinct objectives behind all the approaches presented
in this study . . . 112 5.1 Independent factors and corresponding levels for the experimental designs 119 5.2 32 factorial design used for the spiral tests and experimental results . . 120
5.3 Analysis of variance (ANOVA) for spiral heavy minerals grade and re-covery models . . . 121 5.4 Parameter estimates for the concentrate heavy minerals grade and
re-covery . . . 123 5.5 3² factorial design used for the shaking table tests and experimental
5.6 Analyses of variance (ANOVA) for shaking table heavy minerals grade and recovery models . . . 127 5.7 Mineralogical composition of the micaceous residue and specific gravity
data . . . 134 5.8 Results of heavy and gangue mineral recovery experiments as a function
of wash water and solid pulp density . . . 137 5.9 Parameter estimates for the recovery, α- and β-values for heavy and
gangue minerals . . . 140 6.1 Estimated mineralogical composition of the -53 µm micaceous residue
fraction . . . 152 6.2 Stability constants for metal hydroxamates at 20 °C . . . 157 6.3 Chemical analysis of flotation process water . . . 159 7.1 Summary statistics of the initial and calibrated GT53 content for LREE,
Sn, Nb and W without outliers . . . 176 7.2 Values of fitted parameters a, b and c in Equation (7.2) for the models . 179 8.1 All unit capital cost (UCC) estimations . . . 190 8.2 Estimation of the total investment cost (TIC) for the hypothetical CRM
recovery plant . . . 191 8.3 Estimation of the potential CRMs production for the WADM plant only 192 8.4 Summary of the arguments in favour or against the by-product recovery
of CRMs . . . 193 A.1 Principal industrial applications of the CRMs of interest and Sn . . . . v B.1 Operating conditions for the 8 flotation experiments . . . xiv C.1 Summary statistics and characteristics of the theoretical models that
were fitted to the (multi)variogram curves . . . xix D.1 Illustration of the heavy mineral fraction (RX)ihsize recovery calculation
for the test n°1 . . . xxiii D.2 Analyses of variance (ANOVA) for heavy minerals recovery and
Gom-pertz parameters models . . . xxiv D.3 Analyses of variance (ANOVA) for gangue minerals recovery and
Gom-pertz parameters models . . . xxiv F.1 Simulated material balance of the CRMs recovery process. . . xxxi
Introduction
Contents
1.1 Scope of the study . . . 1 1.1.1 The European Raw Material Initiative . . . 2
1.1.2 CRMs (LREE, Nb-Ta, W) and Sn consumption . . . 5
1.1.3 The STOICISM project . . . 8 1.2 Geological background . . . 11 1.2.1 The Cornubian Sn-W province . . . 11 1.2.2 The St Austell rare-metal granite . . . 13 1.2.3 Similarities with granites-based kaolin deposits worldwide . 15 1.3 Kaolin from St Austell . . . 17 1.3.1 St Austell Kaolin deposits . . . 17 1.3.2 Kaolin extraction . . . 19 1.3.3 Kaolin dry mining processing . . . 20 1.3.4 Waste management . . . 22 1.4 Literature review . . . 22 1.4.1 CRMs (LREE, Nb-Ta, W) and Sn as by-products . . . 22 1.4.2 CRM-bearing minerals processing overview . . . 25 1.4.3 Gravity concentration . . . 31 1.4.4 By-product recovery of CRMs and Sn from kaolin production 38 1.5 Study objectives . . . 41 1.5.1 Scientific objectives . . . 42 1.5.2 Industrial challenge . . . 46
1.1
Scope of the study
The role of raw materials is fundamental to Europe’s (EU) economy, as it has a di-rect influence on growth and jobs and they are essential for maintaining and improving quality of people’s life. The number of materials used across products manufacturing
has significantly increase in the recent years and ensuring a safe and steady supply to certain raw materials is of growing concern within the EU and across the globe.
1.1.1
The European Raw Material Initiative
1.1.1.1 Raw materials supply in Europe
EU has many raw material occurrences or deposits but their exploration and ex-traction faces accrued competition, a highly regulated environment and technological limitations regarding the access to mineral deposits (European Commission, 2008). Moreover, the EU is deeply dependant on raw material importation, which can be critical for the high-tech metals due to their economic value and their high supply risks. The production of some materials is concentrated in a small number of coun-tries, e.g. in 2012, 97% of the global supply of Rare Earth Elements (Rare Earth Elements (REE)) was produced by China (Massari and Ruberti, 2013) which also pro-duces 84% of tungsten global supply while 91% of niobium production was ensured by Brazil (US Geological Survey, 2013). Under these conditions the metal supply risk increases, such as the rush for tantalum in 2000 during the boom of mobile phones or, more recently, the significant increase in consumption of REEs (while their supply has suffered a severe diminution).
Given that our Earth’s surface and subsurface have not been completely explored and is large enough to contain many hidden deposits, or that some large potential deposits are not currently considered because of technological limitations, it appears that it is not the geological availability but the criticality of mineral raw materials which must be considered as an issue (Rosenau-Tornow et al., 2009). The criticality of a material refers to its uncertainty or risk in supply that could affect the national economy. To address this situation the European Commission launched in November 2008 the “European Raw Material Initiative” with the first objective to identify critical raw materials at the European Union level (European Commission, 2008). The main difficulty in defining Critical Raw Material (CRM)s was to develop a methodology to assess criticality and to select raw materials which could be considered as critical using this methodology.
1.1.1.2 Defining Critical Raw Materials
Material availability
The resources are defined by mining companies, which usually only define the re-serves regarding their short to middle-term needs. Therefore the published rere-serves cannot be considered as reliable indicators of long-term availability. For some materi-als, mined as by-product, the availability is also conditioned by the major metal of the ore in which they occurred usually in low concentration. This by-product can generate additional revenue but in some cases they are considered to be impurities that can lower the product value or drive up production cost. Another consideration regarding the geological availability is that some metals can occur as accompanying element in some deposits, as the platinum group elements or PGMs (platinum, palladium, os-mium, iridium ruthenium and rhodium) in ultramafic deposits or REE ores which are generally mined and processed for all these metals together. Technological
develop-ment can have an important impact on the future availability of certain materials by improving processing, manufacturing or recycling methods.
A more efficient use of resources and recycling thanks to technological advances could increase the existing reserves. That’s why rather than using a static view of geological availability, a more dynamic model was chosen by the European Commis-sion. This model take in consideration not only the general trends in reserves, but also technological developments and changes in the geopolitical-economic framework that impact on supply and demand of raw materials (European Commission, 2010).
Main parameters and definition of criticality
Previous studies all defined criticality on the basis of both supply risk and the associated impact on country’s economy. In 2008, the Committee on Critical Mineral Impacts for the US Economy suggested in an expert report a framework for identifying critical minerals (Committee on Critical Mineral Impacts of the US Economy, 2008). In this report the raw materials are considered critical if there are both important in use and subject to potential supply restrictions. In agreement with this approach, the expert work group of the European Commission has also put forward a relative concept of criticality. They consider that a raw material is “critical” when the risk of supply shortage and their impact on the economy are higher than for most of the other raw material (European Commission, 2010).
This innovative approach uses three main indicators to determine criticality, i.e. the supply risk, the economic importance and the environmental country risk:
• The assessment of the supply risks for a raw material was achieved using widely recognised indexes which evaluate the level of concentration of worldwide pro-duction and are linked to the economic and political stability of the producing countries. The supply risks could also be linked to “company concentration”. For example the high corporate concentration of mine production of niobium and tantalum means that a few companies control the global market, increasing the supply risk for these materials. However, the company concentration was not included in the assessment of supply risks because of the limited information regarding the studied materials (European Commission, 2010),
• The measurement of the economic importance of each candidate raw material was performed by breaking down its main uses and attributing to each of them the value added of the economic sector that has this raw material as input, • The last indicator relates to the environmental country risk, i.e. the risk that
measures might be taken by a country in order to protect its environment and thus endanger the supply of raw materials to the EU. The importance of this indicator is perfectly illustrated by the global supply of REE by China, which has decided in 2010 to drastically decrease its export quotas in order to protect its environment (Massari and Ruberti, 2013).
Based on the methodology described above, a raw material can be considered as critical if it is of high economic importance and faces both high supply and environmental risks.
1.1.1.3 Applying the methodology : list of critical raw materials
First evaluations of the criticality of the 41 material candidates have been made using the previously described method (European Commission, 2010). In 2014, this evaluation has been extended to 54 non-energy, non-agricultural materials (European Commission, 2014). In total this new evaluation defines 20 Critical Raw Materials (CRMs), with more detail provided to the REE by splitting them into ‘heavy’ (HREE) and ‘light’ (LREE) categories and scandium (Figure 1.1). These evaluations are based on their economic importance for the EU economy (represented on the x-axis) and their supply risks (represented on the y-axis) only, since environmental country risks did not add significant changes. The results range from low (pulpwood, diatomite) to very high (vanadium, tungsten) economic importance and from very low to very high (LREE and HREE) supply risks.
Three groups of raw materials have been distinguished by the expert work group (European Commission,2014), see Figure 1.1. The CRMs are located in the top right corner sub-group, i.e. every material with a supply risk superior to 1 and an economic importance higher than 5 is qualified as critical.
Supply risk threshold
Eco no mic im po rtance thre sh old HREE LREE Magnesium Nb Sb Magnesite W Ge In Ga Co Fluorspar Silicon metal Be PGM Coking coal Borate Phosphate rock Cr Sn Se Fer Ta Al Natural rubber Natural Graphite Hf V Bauxite Zn Ni Potash Mn Mo Li Gypsum Feldspar Talc Sawn Softwood Ag Rh Sc Pulpwood Barytes Diatomite Bentonite Au PerliteClays Cu Te Ti Limestone Silica sands Economic importance Supply risk
Critical Raw Materials
Low supply risk & high Economic importance
Low supply risk & Economic importance 1 2 3 4 0 5 4 3 2 6 7 8 9
Figure 1.1: Criticality diagram based on the economic importance and supply risk, slightly modified from European Commission (2014).
Their high supply risk is mainly due to the high production concentration. Indeed, the share of the worldwide production is dominated by China (antimony, coking coal, fluorspar, gallium, germanium, indium, magnesium, natural graphite, phosphate rock, LREE, HREE, tungsten). For the remaining CRMs the worldwide production is di-vided between Brazil (niobium), Democratic Republic of Congo (cobalt), Kazakhstan (chromium), Russia (PGM), South Africa (chromium, PGM), Turkey (borates) and the United States (beryllium, borates), see Figure 1.2.
Brazil 92% Niobium South Africa 43% Chromium 61% PGM United States 90% Beryllium 30% Borates Kazkhstan 20% Chromium DRC 56% Cobalt Indonesia 32% Tin Russia 27% PG¨M China 87% Antimony 51% Coking coal 56% Fluorspar 69% Gallium 59% Germanium 58% Indium 69% Magnesite 56% Magnesium 69% Natural graphite 38% Phosphate rock 99% HREE 87% LREE 56% Silicon metal 37% Tin 85% Tungsten Turkey 38% Borates
Figure 1.2: World map of major CRMs (and Sn) producers with critical metals of interest (LREE, Nb, W) and Sn highlighted in bold (European Commission, 2014; US Geological Survey,2015).
The two other sub-groups are not considered as critical but it is important to notice that regarding the sub-group on the lower right corner (i.e. low supply risk and high economic importance materials) a small variation in the supply risk may result in a translation upward in the CRMs sub-group.
Although tin does not fall into the criticality zone, its economic importance is largely above the economic importance threshold whereas the associated supply risk is close to the supply risk threshold. As a result, comparatively small changes in tin supply risk can make this material move into the “critical” region. Thus tin can be properly considered as a “near-critical raw material” (Oakdene Hollins and Faunhofer ISI, 2014).
1.1.2
CRMs (LREE, Nb-Ta, W) and Sn consumption
All the CRMs of interest and Sn have a wide variety of uses, which have varied over time mainly in the metallurgical, electronics, automotive and chemical industry. Appendix A.1 lists the principal industrial applications of the CRMs of interest and Sn for each industry in which they are used.
LREE
The demand for rare earth elements has "skyrocketed" in recent years due to their increasing usage in numerous high-technology markets. The global market shares are distributed between high strength permanent magnets (21%), alloying agents in metals (21%), catalysts (19.5%), polishing (13%), glass (7%), phosphors for electronic displays (6.5%), ceramics (6%) and others (Kingsnorth, 2014b). The industrial application of LREE are numerous in economic areas such as aeronautic, automotive (hybrid and electric vehicles), defence, renewable energy technologies (wind turbine, solar panels),
medicine (medical imagery) and other economic areas for which they became essential. This wide variety of application for REE came from the configuration of their electrons in the atomic structure, which give them many desirable features: (1) ability of forming alloys with other metals, very strong and light magnetic materials; (2) valuable and distinctive optical properties, including fluorescence and emission of coherent light, essential for laser devices; (3) other unique nuclear, metallurgical, chemical, catalytic, electrical, magnetic, and optical properties (Massari and Ruberti,2013). However, each REE has its particular uses as the lanthanides are not all interchangeable (Table 1.1). For instance La is the main REE used in nickel metal hybrid (NiMH) rechargeable batteries that powers many electronic products. Along with cerium (Ce), it is used in fluid cracking catalysts in the petroleum industry for the crude oil refining process. Ce is mainly used for autocatalysts and chemical catalysts as cerium carbonate and cerium oxide to increase effectiveness of chemical reactions and reduce the amount of platinum and other precious metal required. Glass and polishing is also a major use of Ce due to its ability to adsorb ultraviolet light. Neodymium (Nd) is mainly used for permanent magnets in neodymium-iron-boron (NIB) magnets for low temperature applications (Curie point at 310°C) and possesses a magnetic energy of up to 2.5 times greater than the former samarium-cobalt magnets (Walters and Lusty,2011). Accord-ing toKingsnorth(2014b) demand of Nd (and praseodymium) for rare earth permanent magnets will be the market driver for the foreseeable future.
Table 1.1: Rare Earth Elements consumption by application (Lynas Corporation Ltd.,2010).
Application La (%) (%) Ce (%) Pr (%) Nd (%) Sm (%) Eu (%) Gd (%) Tb (%) Dy (%) Y Other (%) Magnets - - 23.4 69.4 - - 2 0.2 5 - - Battery alloys 50 33.4 3.3 10 3.3 - - - - Metal alloys 26 52 5.5 16.5 - - - - Auto catalysts 5 90 2 3 - - - - Petroleum refining 90 10 - - - - Polishing compounds 31.5 65 3.5 - - - - Glass additives 24 66 1 3 - - - 2 4 Phosphors 8.5 11 - - - 4.9 1.8 4.6 - 69.2 - Ceramics 17 12 6 12 - - - 53 - Other 19 39 4 15 2 - 1 - - 19 - Sn
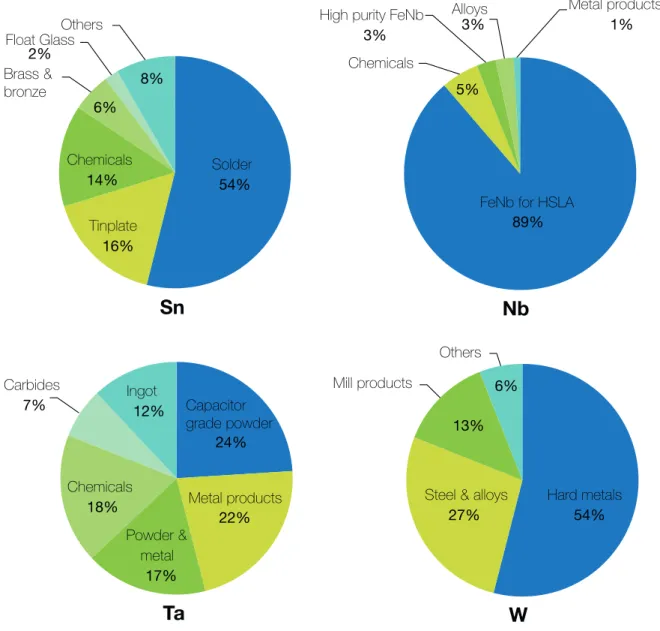
Tin has been in use since ancient times and its consumption by different sectors is varying with time. Since 2000, consumption of tin for electronic soldering application increases in Asian countries, especially China and Japan (Angadi et al., 2015). Tin is primarily used worldwide, in descending order, in solders, tin plates, chemicals, tin alloys (brass, bronze, etc.) and float glass (Figure 1.3). Tin is employed in a wide range of specialised solders of higher or lower melting temperature, and physical properties to support the electronics and industrial sectors. Solders are used in almost every elec-tronic product for conductive joints, and for traditional industrial applications such as joining copper water pipes. Tinplate (i.e. steel with a thin tin coating) is used in
pack-Solder 54% Tinplate 16% Chemicals 14% Brass & bronze 6% Float Glass 2% Others 8%
Sn
FeNb for HSLA 89% Chemicals
5% High purity FeNb
3% Alloys 3% Metal products 1%
Nb
Capacitor grade powder 24% Metal products 22% Powder & metal 17% Chemicals 18% Carbides 7% Ingot12%Ta
Hard metals 54% Steel & alloys27% Mill products 13% Others 6%
W
Figure 1.3: The main global uses of CRMs (Nb, Ta, W) and Sn in 2010 using data from (ITRI,2010;Roskill Consulting Group,2010;Schwela,2010). Abbreviations are given in the text.
aging in the food industry for food and beverages (e.g. tin cans), product containers and various other items (ITRI,2010). Tin chemicals represent also an important share of tin consumption, primarily used in organic compounds in PVC (doors, windows) to prevent degradation by heat and sunlight. Other uses of tin include non-smelting alloys of tin such as brass, bronze, pewter and even superconductor. Tin as also an essential role in the float glass technology for flat glass manufacturing process (De Cuyper and Delwasse, 1999).
Nb-Ta
Niobium and tantalum are vital components in a diverse range of products and applications due to their unique properties which include superconductivity, corrosion-resistance, very high melting temperature, shape memory properties, high coefficient of
capacitance and bio-compatibility (Shaw and Goodenough,2011). The majority of nio-bium is consumed in the form of ferro-nionio-bium (FeNb) utilised in the production of high strength low alloy steels (HSLA) used to manufacture vehicle bodies, railway tracks, ship pull, bridges or pipelines. The remaining share is used in manufacturing niobium chemicals, high purity ferro-niobium, niobium alloys and other niobium metal products (Schwela,2010), seeFigure 1.3. The end uses for tantalum are more balanced between capacitor-grade and metallurgical grade tantalum powder, metal products, tantalum chemicals, ingot and carbides (Figure 1.3). Tantalum powders are used in a wide range of applications, primarily for the production of capacitors in mobile phones, due to their ability to hold electric charge.
W
The unique properties of tungsten are a very high density and melting point, an extreme strength, a high wear resistance, a low coefficient of expansion, a high thermal and electrical conductivity (Pitfield and Brown,2011). However the global end-uses of tungsten are less diverse comparing to the above-mentioned uses of other CRMs. Tung-sten is primarily used worldwide, in descending order, in hard metal, steel and alloys, mill products and other products (Roskill Consulting Group, 2010), see Figure 1.3. The term hard metals refer to tungsten and cemented carbides used to manufacture very hard materials used for cutting, drilling and wear-resistant coatings in the metal-working, mining and petroleum industry. There is a wide variety of tungsten alloys, the more common being the steel alloys, such as high speed steel, heat resistant steel and tool steel used for metal cutting and other specialised engineering application where hardness and strength are required (Pitfield and Brown,2011). The term mill products refer to tungsten wire, sheets or rods used in electrical application, electronics, notably in incandescent light bulb filaments, vacuum tubes and heating elements. Other ap-plications include chemical products used as colouring agents in the porcelain industry or in catalysts, phosphors and absorbent gels, as reagents for chemical analysis during medical diagnosis, or as a corrosion inhibitors (Pitfield and Brown, 2011).
1.1.3
The STOICISM project
1.1.3.1 Project summary
The European Seventh Framework Programme for Research (FP7) launched in mid-2011, offered to support large projects under the umbrella of Nanosciences, Nanotech-nologies, Materials and New Production Technologies (NMP) including “NMP.2012. 4.1-1: New environmentally friendly approaches to mineral processing”. It was rec-ognized through the EU Raw Materials Initiative and Europe 2020 that there was also a need to improve all raw materials efficiency to remain as sufficient and self-sustainable as possible (EU,2015).
Europe is a major global producer of industrial minerals with around 180 million tonnes per year of products extracted in the EU, with an estimated contribution of e10 billion to European Gross Domestic Product (GDP). In global terms, EU produces 35% of perlite, 20% of calcined kaolin and 20% of diatomite of world demand (EU, 2015). Key markets for these minerals are beverage filtration, coatings, plastic, rubber, cosmetics, insulation and construction materials. Any strategy based on sustainable
use of mineral resources has to reduce the impact on the environment through improved efficiency and effectiveness of the entire value chain of raw materials.
In this context the STOICISM (Sustainable Technologies for Calcined Industrial Minerals in Europe) project was launched in 2013 with 4-years duration, with the specific objective to enhance the competitiveness of the European industrial minerals industry by developing cleaner, more energy efficient extraction and processing tech-nologies reducing the carbon footprint of several calcined industrial minerals, thereby looking at the whole supply chain from the extraction, beneficiation, waste valorisation and optimisation of the functionality for the end users.
Three industrial minerals, i.e. diatomaceous earth (DE), perlite and kaolin have been selected but results should be directly transferable to many other industrial min-erals.
1.1.3.2 Project partners and consortium structures
The STOICISM Consortium is led by a major industrial mineral producing com-pany (Imerys minerals Ltd) and consists of 17 partners from 8 different European countries. Key contributors on this multidisciplinary platform include several univer-sities, specialized SMEs & corporations, an industry association, as well as applied technology and research institutes. The project is structured in 9 work packages (WP) with associated tasks and with clearly identified milestones and outcomes. The 6 first work packages are complementary and correspond to the main steps of the whole in-dustrial materials supply chain (Figure 1.4).
END WP9: Management
WP8: Dissemination and exploitation WP1: Raw Material Extraction
WP2: Beneficiation
WP3: Dewatering and drying WP4: Calcining
WP5: High temperature waste recycling WP6: Online monitoring and control of
calcined industrial minerals processes
WP7: Demonstration
activities
START
Figure 1.4: Consortium structure and list of work packages, after EU (2015).
This work is incorporated within the framework of WP2 "beneficiation" the leader of which is the Université de Lorraine (UL). The others partners involved in this work package are:
• Imerys Minerals Ltd, the wholly-owned UK entity of Imerys, world leader in mineral-based specialties for industry, active in 47 countries with more than 240 industrial locations. Imerys is the lead participant in the project and ensure that the industrial partnership, with its academic support, meets the aims and
objectives of the project on time and within the budget. They are involved in all of the Work Packages, thus providing leadership and continuity throughout the project.
• University of Exeter’s Camborne School of Mines (CSM), which has an interna-tional reputation for research related to the understanding and management of the Earth’s natural processes, mineral resources, energy, and the environment. The core of Exeter’s involvement is participating in WP1 (Extraction) but it also participates across WP2, investigating opportunities for renewable energy. The strategic objective of WP2 is to develop and apply new beneficiation techniques to allow the use of low quality DE, perlite and kaolin ore and to recover CRMs from waste streams. This is expected to reduce waste production and increase useful mine volumes. UL led this activity with support and input from Imerys and CSM. The specific objectives of WP2 are to:
1. Advance technological development of high intensity flotation devices for better flotation recovery with investigation of pulsation, vibration and ultrasonic fields. Thus a considerable diminution of energy and reagents consumption by unit volume of material processed will be obtained.
2. Develop a process for selective flocculation of DE to remove impurities. 3. Identify alternative and new uses for industrial mineral waste streams.
4. Identify processes to extract useful CRMs from raw materials and waste such as physical separation, advanced flotation technology, and embrittlement by high power electromagnetic pulses.
5. Assess opportunities for the use of renewable energy in the beneficiation process stages.
This PhD thesis is linked to the fourth objective through the task 2.6 untitled “CRM Recovery”.
1.1.3.3 Task 2.6 CRM Recovery
This task is dedicated to CRM recovery from waste streams of kaolin production of the St Austell kaolin workings of Imerys in Cornwall, UK. T2.6 itself is subdivided into specific subtasks:
• T2.6.1 Analysis of materials streams and definition of the samples to be characterised: analyse raw materials/waste streams and evaluate their avail-ability to extract the critical CRMs.
• T2.6.2 Identification of valuable minerals and metals: identify the CRM-bearing minerals and the degree of dissemination in the ore and waste streams to evaluate the way of processing. The classical and advanced analytical techniques for mineral characterisation (XRD, high resolution SEM and TEM, etc.) will be used by UL to identify the mineral composition and mineral associations. University of Exeter will apply the new QEMSCAN technique to establish the mineral and size by size associations in order to direct to the best separation method.
• T2.6.3 Feasibility studies of pre-concentration by physical methods and extraction of CRMs. UL will test the physical separation techniques such as gravity (i.e., centrifuge) and high intensity magnetic separation, advanced flotation technique and leaching (all available in STEVAL pilot plant) to extract the CRMs from various type of streams. For low grade rare metals-containing ore (W, Sn, Ta, Nb, REE) a high capacity pre-concentration method will be searched and tested.
• T2.6.4 Feasibility studies on advanced flotation technique for low grade and fine grained ores: For low grade and fine grained ores (or waste products) the high intensity flotation machine will be used. In order to decrease the reagent consumption, P4 will develop a new formulation of flotation reagents based on the synergistic effects in the mixed collector system. Thus, the combination of new formulations of surfactants with pulsed fields in the high intensity flotation machine will result in the enhanced separability of CRMs from waste streams. In particular it will allow rare metals (W, Ta and Nb) to be processed economically from low grade, high volume ores.
• T2.6.5 “Go/No Go” evaluation: UL will carry out a “Go/No Go” evaluation at M24.
• T2.6.6 Validation of CRMs extraction methods at laboratory and pilot scale: UL will validate the promising CRM extraction methods at laboratory and pilot scale.
• T2.6.7 Assessment of scale-up potential for the technologies developed: Imerys and UL will assess the potential for scale-up of the technologies developed based on the results of (M36-M42).
1.2
Geological background
The Cornubian granite province is well known for its historically important deposits of tin and base metals (Manning and Hill, 1990), and for its current international importance as a major producer of china clay (kaolin).
1.2.1
The Cornubian Sn-W province
Tin is distributed on the continents in relatively narrow continent-sized belts ( Schuil-ing, 1967). For instance, most of tin deposits across Europe are related to Variscan granites (Figure 1.5). The major tin belt passes from the Cornubian massif (Redruth, Camborne, etc.) in UK through the French Massif Central (Echassières) and con-tinues towards Italy with tertiary tin deposits (Elbe, Tuscany and Scilly). Other tin belts are also related to varsican granites, like the one which pass from Northen Por-tugal (Panasqueira) through Spain or the one around the Bohemian massif (Cinovec-Altenberg). Indeed most of these tin deposits are associated with Sn-W cupolas located at the top of tardi- to post-orogenic plutons emplaced at shallow depths (Jébrak and Marcoux, 2008).
Bohemian Massif Iberian Massif Massif Central Rhenish Massif Armorican Massif Cornubian Massif Redruth, Camborne, etc. St Austell Granite Podlesí Granites Cinovec Altenberg Nevas Corvo Panasqueira Echassières Beauvoir granite Tin deposit Tungsten deposit Granitic rock Variscan massif Tin "belts" Town Active pit Tin "center" Cornubian Peninsula Variscan belt
Copper vein swarms Kaolinised area
Estimated pluton extent
Land's End Carnmenellis St Austell Bodmin Moor Dartmoor PLYMOUTH ST AUSTELL FALMOUTH CAMBORNE PRINCETOWN PENZANCE 40 km 20 0 Ilses of Scilly Luxulyan St-Austell 5 km 0 a b c N N Sn-W lodes Elvans dykes Roche
Figure 1.5: Spatial relationship at distinct geological scales between Variscan granites and Sn-W deposits. (a) Tin belts in Europe and their spatial connection to the Variscan belt modified from Schuiling(1967). Main Sn-W deposits are from the PROMINE project (BRGM,2011). (b) Outline geologic map of south west England peninsula showing the location of the major plutons of the Cornubian batholith, the kaolinised areas and the active kaolin pits, modified fromČerný et al.(2005). (c) Distribution of the felsite dykes (elvans) and Sn-W mineral lodes around and within the St Austell rare-metal granite afterBray and Spooner (1983).
The batholith of SW England was formed during late Variscan orogeny in the Late Carboniferous to Early Permian (270-300 Ma) intruding deformed Devonian-Carboniferous terrestrial to marine sediments. The batholith has a 200-km-long ex-tension (Willis-Richards and Jackson, 1989), comprising six major and several minors granite bodies. The major bodies, from east to west, are Dartmoor, Bodmin Moor, St Austell, Carnmenellis, Land’s End and the Scilly Isles (Figure 1.5b).
The outcrops are dominated by biotite-bearing monzogranite, with minor intrusions of tourmaline-bearing aplites, pegmatites and local fine-grained facies (Manning et al., 1996). In addition there is some occurrences of other granite types, resulting from multiple intrusive episodes, such as the lithium-mica granites or the topaz-bearing granite in the Tregonning-Godolphin Granite and the St Austell Granite (Manning and Exley, 1984; Manning and Hill, 1990; Manning et al., 1996). The batholith was affected by several episodes of alteration including quartz-tourmaline veining associated with greisening, intrusion of rhyolite dykes, quartz-hematite veining. Kaolinisation is the last alteration event, which is believed to have a meteoric origin (Psyrillos et al., 1998), and was relatively extensive in the western part of the St Austell pluton where the majority of the active kaolin pits are located (Figure 1.5b).
According toWillis-Richards and Jackson(1989) there is a close spatial association between the batholith and the rich Sn, Cu mineralization of the Cornubian Peninsula. Most of the ores of Sn, Cu, W, Zn and As came from vein deposit type minerali-sation, along or parallel to the axis of the batholith (Moon, 2010). Within the St Austell granite zones of intense kaolinisation are spatially related to swarms of steeply dipping, quartz-tourmaline±cassiterite±wolframite sheeted veins with greisen (quartz-muscovite-tourmaline±topaz±wolframite) alteration selvages (layered alteration zones), observable at Goonbarrow pit (Bray and Spooner, 1983). These mineral lodes are lo-cated South (and North) of the St Austell granite, but some of them actually occurred within the St Austell granite kaolinised area (Figure 1.5b and Figure 1.6). Figure 1.5 illustrate the multi-scale spatial relationship between Variscan granites and Sn-W de-posits from the Variscan belt to the St Austell district. This shared relationship is confirmed by the numerous similarities between the St Austell rare-metal granite and several rare-metal granites worldwide, that will be discuss further inSection 1.2.3.
1.2.2
The St Austell rare-metal granite
Rare-metal granites are so-called because of their mineralisations being dissemi-nated through the granites rather than concentrated in layers, lodes, etc. The St Austell rare-metal granite share numerous characteristics with other granites of SW England, summarised in many reference papers and textbooks (Floyd et al., 1993; Manning and Hill, 1990; Manning et al., 1996). These granites were originally de-scribed by four different granite types, all observed in distinct SW England granites: biotite granite, lithium mica granite, tourmaline granite and topaz granite (Hill and Manning, 1987). Additional granite types were added later based on field and textural observations within the St Austell granite, indicating complex late-stage magmatic and hydrothermal processes (Manning et al., 1996). The St Austell rare-metal granite is composed of six major granite types, each unit being characterised by a specific mineral assemblage and textures (Manning et al., 1996), see Figure 1.6.
The biotite granite (BG) is the main lithology, which represent up to 70% of the outcrop of the St Austell granite, exposed in the Western Area, at the eastern part of the pluton and intermittently within the Central Area. It corresponds to the megacrys-tic biotite granite observed at Land’s End and Dartmoor (Manning and Exley, 1984; Manning et al.,1996). It is coarse grained, mainly composed of quartz, K-feldspar and micas with tourmaline and topaz as minor phases. Biotite is the main mica, but mus-covite is also present. The main accessory phases are rutile, topaz, apatite, monazite,
0
1 2 3 5 4 6 7 8 9 11 10 12 13 14 15 16 17 18 19 20 21 22 23 24 25 M M M M M M M M 0 2 4 km Biotite granite Lithium Mica granite Tourmaline granite (Fine-grained) Topaz granite Tourmaline(Globular quartz & equigranular)
Intrusive ( dolerite, gabbro) & extrusive ( basalt, spilite) Igneous Rocks
BASIC IGNEOUS ROCKS ST AUSTELL GRANITE China Clay (Kaolin)
Sn-W mineralisations
Micaceous residue dams Measured and indicated resources
Inferred resources MelburVirginia Maggi pie Kernick Wheal Remfry Goonvean Treviscoe Rostowrack Trelavour Dubbers Blackpool Longstone Dorothy - Littlejohns 1 2 3 4 5 6 7 8 9 10 Great Longstone Greensplat Wheal Martyn Goonbarrow Rocks Gunheath Ninestones Penhale Great Treverbyn 11 14 15 12 13 16 17 19 20 21 22 West Carclaze China clay pits
Active mica dam
18 Great Wheal Prosper 23 Baal 24 25 CHINA CLAY WORKING AREAS WITHIN THE ST AUSTELL GRANITE 0 40 km Land's End Carnmenellis St Austell Bodmin Moor Dartmoor PLYMOUTH ST AUSTELL FALMOUTH CAMBORNE PRINCETOWN PENZANCE 20 Granitic rock Cornubian Peninsula Kaolinised area
Lithology from Manning et al.,1996 N breccia pipe ST AUSTELL BAY Nanpean Stock Central Area Western Area Hensbarrow St Austell Roche Mineral lodes Contact aureole Felsite dykes (elvans)
Luxulyan
M
Figure 1.6: Geological map of the St Austell granite showing the distribution of the various granite types fromManning et al.(1996), the major kaolin resources and the micaceous residue dams after British Geological Survey(1997), as well as the main Sn-W mineralisations after Bray and Spooner (1983).
cassiterite, zircon and uraninite (Manning et al., 1996). The main host for the LREE differs depending on the authors. Works of Jefferies (1985) on Carnmenellis biotite granite describe monazite as the main LREE-bearing mineral accounting for approx-imately 75% of the total LREE content. In contrast microprobe analysis on samples from Cornubian granites by Alderton et al. (1980) show significant concentrations (up to 0.5%) of LREE in other phases, particularly apatite, but also zircon and sphene.
The lithium mica granite (LMG) has a similar grain size and texture than the bi-otite granite (Manning et al., 1996). It is characterized by the presence of lithium mica (zinnwaldite) and plagioclase (albite component). The accessory minerals are present as inclusion in zinnwaldite (apatite, monazite, zircon and rutile) or in