HAL Id: hal-02626083
https://hal.inrae.fr/hal-02626083
Submitted on 26 May 2020HAL is a multi-disciplinary open access
archive for the deposit and dissemination of sci-entific research documents, whether they are pub-lished or not. The documents may come from teaching and research institutions in France or abroad, or from public or private research centers.
L’archive ouverte pluridisciplinaire HAL, est destinée au dépôt et à la diffusion de documents scientifiques de niveau recherche, publiés ou non, émanant des établissements d’enseignement et de recherche français ou étrangers, des laboratoires publics ou privés.
Genetic differentiation in functional traits among
European sessile oak populations
Jose Torres Ruiz, Antoine Kremer, M. R. Carins-Murphy, T. J. Brodribb,
Laurent Lamarque, Laura Truffaut, Fabrice Bonne, Alexis Ducousso, Sylvain
Delzon
To cite this version:
Jose Torres Ruiz, Antoine Kremer, M. R. Carins-Murphy, T. J. Brodribb, Laurent Lamarque, et al.. Genetic differentiation in functional traits among European sessile oak populations. Tree Physiology, Oxford University Press (OUP): Policy B - Oxford Open Option B, 2019, 39 (10), pp.1736-1749. �10.1093/treephys/tpz090�. �hal-02626083�
Version preprint
Genetic differentiation in functional traits among European sessile oak
1populations
2JM Torres-Ruiz1*, A Kremer2, MR Carins-Murphy3, TJ Brodribb3, LJ Lamarque2, L
3
Truffaut2, F Bonne4, A Ducousso2 and S Delzon2.
4 5
1Universite Clermont-Auvergne, INRA, PIAF, 63000, Clermont-Ferrand, France. 6
2Unité Mixte de Recherche Biodiversité Genes & Communautés (UMR 1202 BIOGECO), Institut National 7
de la Recherche Agronomique (INRA) – Université de Bordeaux, 69 route d’Arcachon, Cestas F-33610,
8
France.
9
3School of Natural Sciences, University of Tasmania, Private Bag 55, Hobart, Tasmania 7001, Australia. 10
4UMR SILVA, INRA, Nancy, France. 11
12 13
*author for correspondence: 14
José M. Torres-Ruiz. 15
Université Clermont-Auvergne, INRA, PIAF, 63000, Clermont-Ferrand, France. 16 Email : torresruizjm@gmail.com 17 Telephone: +33 4 43 76 14 06 18 19 20
Running title: Differentiation in functional traits among oak populations.
21 22
23
Keywords: Climate change, adaptive capacity, phenology, embolism resistance, plant
24
ecophysiology, plant functional traits. 25
26
27
Version preprint
Abstract
29The vulnerability of forest species and tree populations to climate change is related to the 30
exposure of the ecosystem to extreme climatic conditions and to the adaptive capacity of 31
the population to cope with those conditions. Adaptive capacity is a relatively under-32
researched topic within the forest science community and there is an urgent need to 33
understand to what extent particular combinations of traits have been shaped by natural 34
selection under climatic gradients, potentially resulting in adaptive multi-trait 35
associations. Thus, our aim was to quantify genetic variation in several leaf and woody 36
traits that may contribute to multi-trait associations in which intraspecific variation could 37
represent a source for species adaptation to climate change. A multi-trait approach was 38
performed using nine Quercus petraea provenances originating from different locations 39
that cover most of the species’ distribution range over Europe and that were grown in a 40
common garden. Multiple adaptive differences were observed between oak provenances 41
but also some evolutionary stasis. Also, our results revealed higher genetic differentiation 42
in traits related to phenology and growth than in those related to xylem anatomy, 43
physiology and hydraulics for which no genetic differentiation was observed. The 44
multiple associations between those traits and climate variables resulting from 45
multivariate and path analyses suggest a multi-trait association largely involving 46
phenological and growth traits for Quercus petraea. 47
48 49 50 51
Version preprint
52 53
INTRODUCTION
54
Climate change and the associated increase in mean temperature and reduction in 55
precipitation are expected to induce significant shifts in species’ distributions due to 56
drought-induced population diebacks (Bertin 2008, Allen et al. 2010 201, Delzon et al. 57
2013, Allen 2014). This has raised important concerns not only about our ability to predict 58
population mortality and its impact on ecosystem function (McDowell et al. 2013, 59
Cailleret et al. 2017) but also about the capacity of species to adapt in a timely manner to 60
the expected warmer and drier climates (Corlett and Westcott 2013, Sáenz‐Romero et al. 61
2017, González-Muñoz et al. 2018). These concerns are especially relevant to forest 62
species given, on the one hand, the rapid rate of environmental change and, on the other, 63
the long life-span of most tree species (Aitken et al. 2008). Therefore, crucial questions 64
for evaluating and predicting the consequences of ongoing climate change are i) which 65
key traits can evolve within a few generations allowing the adaptation of trees to climate 66
change?; and ii) how fast can such adaptation occur in response to a changing 67
environment? 68
During the last decade, many studies have focused on addressing these questions by 69
monitoring woody plants under controlled or induced environmental changes (Hoffmann 70
and Sgrò 2011, Franks et al. 2014). As a result, different traits have been identified that 71
respond phenotypically to temperature, thus making them potential targets for 72
microevolution (e.g. Amano Tatsuya et al. 2010). Phenology is one of the most well– 73
known sensitive indicators of climate change. In oaks, previous studies have shown 74
genetic differentiation in bud phenology that has resulted in a shift of two to three days 75
Version preprint
in spring and 0.3 to 1.6 days in autumn per decade over the last 50 years, extending the 76
growing season (Vitasse et al. 2009). Although the benefits can vary across species, it has 77
been shown that individuals that flower early produce flowers throughout the entire 78
growing season, thus maximizing fitness compared with late-flowering individuals 79
(Anderson et al. 2012). However, much less is known about the genetic determinism of 80
leaf functional traits in oaks such as stomatal density, leaf size and leaf thickness, that 81
have significant influence on net carbon gain but also on plant water balance. The genetic 82
determinism of xylem and hydraulic traits that are related to the hydraulic failure of the 83
plant water transport system due to embolism formation is also largely unknown in oak 84
despite embolism formation being considered to be one of the main mechanism leading 85
drought-induced plant mortality (Brodribb and Cochard 2009, Urli et al. 2015, Salmon et 86
al. 2015, Choat et al. 2018). Understanding intra-specific variation in these traits would 87
therefore help us to evaluate the capacity of tree species to face and adapt to new 88
environmental conditions induced by ongoing climate change. 89
In this study, we investigated intraspecific variation of numerous traits related to leaf 90
phenology and physiology with the aim to better understand the potential for adaptation 91
of oak populations. Indeed, genetic variation could help to ensure survival of at least some 92
individuals or populations during extreme events, buffering the population or the species 93
against extinction (Meireles et al. 2017). 94
Some of these traits have previously been assessed in common garden experiments and 95
exhibited clinal genetic variation along geographic gradients as a result of diversifying 96
selection (Vitasse et al. 2009, Alberto et al. 2011). Thus, divergent intraspecific profiles 97
for “intrinsic” water-use efficiency (Farquhar and Richards 1984) have been linked to the 98
distribution of genotypes across gradients in air humidity and soil water availability for 99
different species (Pennington et al. 1999, Cregg and Zhang 2001, Aletà i Soler et al. 100
Version preprint
2009). Also, a previous study in oaks carried out in a common garden with populations 101
from different locations along an elevation gradient showed how genetic differentiation 102
accounted for up to 28% of total variation in traits such as leaf mass area and nitrogen 103
content for European oak and beech (Bresson et al. 2011). However, some studies 104
reported no evidence of genetic differentiation for growth traits between populations 105
along an aridity gradient (Deacon and Cavender-Bares 2015, Ramírez-Valiente et al. 106
2017). Environmental changes can also affect wood and water metabolism-related traits, 107
such as wood density, vulnerability to embolism and water use efficiency (Mencuccini 108
2003, Schume et al. 2004, Brienen et al. 2011). In fact, genetic differences in both wood 109
density and vulnerability to embolism have been reported for some species (Arnold et al. 110
2004, Sotelo Montes and Weber 2009, David-Schwartz et al. 2016) but not for others 111
(Lamy et al. 2011). 112
In this contribution, we purposely implemented a multitrait approach by considering 113
different functional traits related to either growth, phenology, structure (wood density), 114
and physiology. Our aim was to investigate whether diversifying selection along climate 115
gradients triggered specific associations of multiple traits whose genetic variation could 116
represent a source for adaptation. Although previous studies have shown that some traits 117
may follow clinal genetic variation along climatic gradients, their pattern of genetic 118
variation has never been investigated collectively in a single and large common garden. 119
We studied nine Quercus petraea L. provenances diverging from a common source 120
population (from the last glacial period, 15000 years BP) and originating from different 121
locations that cover most of the species’ distribution range over Europe and grown in a 122
common garden. We focused on a paneuropean oak species: Quercus petraea (sessile 123
oak). This species has been extensively monitored at the molecular level to document 124
spatial and temporal differences across Europe, but to a much lesser extent at the 125
Version preprint
phenotypic level, which was our main aim. Also, Quercus petraea is an ideal species for 126
drawing adaptive inferences based on genetic divergence. Indeed, recent 127
microevolutionary patterns of variation were shown to be less blurred by historical or 128
demographic noise in oaks in comparison to other species, due to their very low level of 129
subdivision on the basis of neutral markers (Firmat et al. 2017). 130
131
MATERIAL AND METHODS
132
Common-garden experiment 133
This study utilised a common garden experiment that was planted in 1989 and 1993 in 134
the Forêt Domaniale de Sillégny (France) which contains 107 sessile oak provenances 135
(Ducousso et al. 1996). From these, 9 provenances diverging from a common source 136
population and representing different climatic regions within the distribution range of the 137
species in Europe, from Northern Germany to Southern France, were selected for this 138
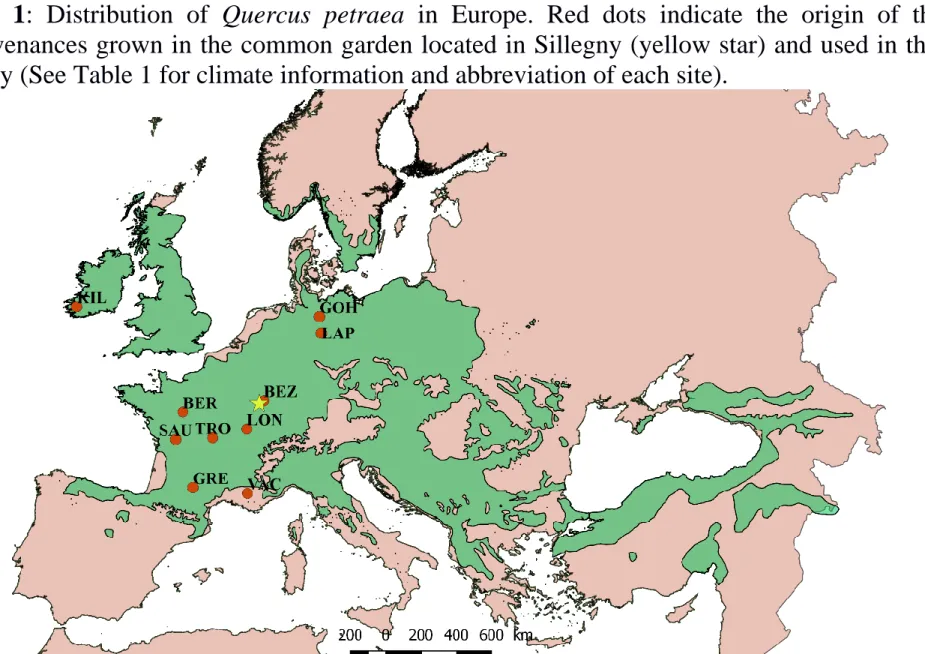
study (Fig. 1 and Table 1, climate data source: Worldclim; period: 1960-1990). The initial 139
density of the plantation was 1904 individuals per hectare (spacing 3 m × 1.75 m) with 140
each provenance replicated from ten to fifteen plots with 24 trees per plot. At the time of 141
the study, most of the trees were 25 year-old and 10 m tall on average (see details about 142
plantation years in Table 1). Although sample size differed between the different traits 143
studied because of varying complexity of measurements, all traits were evaluated in the 144
exact same set of trees per provenance. 145
Phenology and tree height
146
We monitored spring and fall phenology in the nine selected provenances in 2014. Leaf 147
unfolding (LU) in spring was monitored every ten days in 25 individuals per provenance 148
Version preprint
distributed in 7 to 12 replicated plots. Leaf senescence (LS) was monitored two times in 149
late September and mid-October 2014 in the same individuals monitored for LU. 150
Phenological observations were made using binoculars (magnifying power: 109) at a 151
distance of approximately 10 m from each tree, by the same observer. In spring, we 152
recorded the development stages from bud dormancy to leaf unfolding, using a scale with 153
five intermediate stages according to Vitasse et al. (2009). We considered that a bud had 154
reached leaf unfolding (LU) stage when at least one of its leaves was fully unfolded. At 155
the tree level, LU date was determined when 50% of the buds had reached this threshold. 156
In fall, due to the low number of field campaigns, we were not able to estimate a date of 157
LS and therefore used the score of LS obtained during the October campaign (the 158
September campaign was not discriminative enough). The senescence score corresponds 159
in percentage to the amount of non-functional leaves, either coloured or fallen according 160
to Vitasse et al. (2009). Height of all individuals was measured in January 2015. 161
Mean leaf area, specific leaf area and wood density
162
Mean leaf area (MLA, mm2) and specific leaf area (SLA, m2 kg-1) was determined for 22
163
to 28 trees per provenancerandomly selected in 7 to 12 blocks per provenance and with
164
at least 1 tree per block. Between 10 to 15 fully expanded and non-damaged leaves were 165
collected per tree. To avoid any possible effects of different light exposure within the 166
crown on leaf traits, all samples were collected from the upper and outer part of the crown 167
to ensure a similar light exposure among them. All leaves were collected within 48 hours 168
starting on June 14th, 2014. They were collected from a single branch per tree using a pole
169
pruner or by shooting them down. Immediately after being collected, leaves were placed 170
in sealed plastic bags to avoid desiccation, stored in cooling boxes and transported to the 171
lab. Once in the lab, 6 to 8 leaves per tree were scanned to measure the area of each 172
individual leaf using a desktop scanner (Expression 10000 XL, Epson, Japan) and 173
Version preprint
WinFolia software (Regent Instruments Inc., Quebec, Canada). For determining the SLA, 174
the dry mass of leaves was measured after drying them in an oven at 65°C until a constant 175
mass was reached. The SLA was assessed as the ratio of the leaf area to its mass. 176
Individual leaf data were later averaged over all leaves per tree. 177
Wood density was estimated using X-ray imagery (Polge 1966) on a section of 178
dry branch. One ca. 10-cm long branch segment per individual was collected from 4 to 179
16 individuals per provenance. As for leaves, to avoid any possible effects of different 180
light exposure within the crown on wood density, all branches were collected from the 181
upper and outer part of the crown to ensure similar light exposure conditions among them. 182
All branches had the same age (two years-old) within and between provenances. For each 183
sample, we used a double-bladed saw to cut a transverse section with a constant thickness 184
of 2 mm. Wood density was measured on the transverse section by using an x-ray image 185
calibration procedure. Sections were exposed to X rays and were then scanned with a 186
microdensitometer. Images were analysed using Windendro (Guay et al. 1992) to obtain 187
two radial density profiles per section. Ring limits were determined automatically, 188
checked manually, and then corrected with this software. We then calculated mean wood 189
density (D, g cm-3). 190
Stable C and N isotopes analysis
191
After MLA and SLA measurements, the same leaves were used for determining the 192
carbon and nitrogen content (C and N g/kg, respectively) and isotopic discrimination 193
(Δ13C and Δ15N for C and N, respectively). The dry samples were ground to powder 194
using a wood grinding sample system (Labman, Stokesley, North Yorkshire, UK) and put 195
into a tin capsule for mass spectrometry. The C and N isotope ratios as well as C and N 196
contents were measured on 3 mg samples at the Microbiology & Agronomics Platform at 197
INRA Reims (France) by using an isotope ratio mass spectrometer (Delta Advantage, 198
Version preprint
Thermo Scientific, Bremen Germany). The carbon isotopic composition expressed as 199
δ13C in ‰ (Craig 1957) was then converted into carbon discrimination Δ13C in ‰
200
(Farquhar and Richards 1984). The Δ13C values were corrected for the Suess Effect
201
(decrease in δ13C of atmospheric CO
2 since the beginning of industrialization) resulting
202
from the emission of fossil carbon dioxide, which is depleted in 13C (Francey et al. 1999,
203
McCarroll and Loader 2004) even if the sampling has been done at the same date. Δ13C
204
can be related to the ratio of CO2 assimilation (A) to stomatal conductance (gs), also
205
named the intrinsic water-use efficiency. 206
Leaf vein and stomatal density
207
Vein density (total vein length per mm2 of leaf area) was determined from paradermal
208
sections of five fresh leaves (one leaf per tree, five trees per provenance) similar to those 209
used for MLA and SLA. Sections were prepared and measured following the protocols 210
described by Carins Murphy et al. (2012). In brief, this involved removing the adaxial 211
epidermis and palisade tissue, clearing all pigment with bleach, and measuring VD from 212
slide mounts of the sections using image analysis of digital photomicrographs (5 fields of 213
view per section). Stomatal density (total stomata per mm2 of leaf area) was also
214
determined from cuticles (1 per leaf and 5 fields of view per cuticle) prepared and 215
measured following the protocols of Carins Murphy et al. (2012). 216
Vulnerability to embolism
217
Due to the complexity of these measurements, vulnerability to xylem embolism was 218
determined in three out of the 9 selected provenances and one extra provenance 219
(originally from Ireland) for which the aridity of the provenance origin was much lower 220
(Table 1). For each provenance, 15 individuals randomly selected in 7 to 9 blocks per 221
provenance and with at least 1 tree per block were evaluated in June/July 2015. These 222
Version preprint
four provenances were selected according to their aridity index (AI) which was calculated 223
as: 224
AI = MAP / MAE 225
where MAP and MAE represent the mean annual precipitation and mean annual potential 226
evapotranspiration, respectively. The four provenances selected were Grésigne 227
(Southeastern France), Killarney (Southern Ireland), Vachères (Southwestern France) and 228
Göhrde (Northern Germany), and represent different climatic regions, ranging from a dry 229
Mediterranean region in France to a continental temperate climate in Germany (plus the 230
additional provenance from a cool and humid oceanic climate in Ireland). 231
Xylem vulnerability to embolism was measured using the Cavitron technique 232
(Cochard, 2002; Cochard, 2005) at the Caviplace laboratory (GENOBOIS platform, 233
INRA-University of Bordeaux, France). To prevent artefactual losses in hydraulic 234
conductance due to the induction of embolism during the sample preparation (Torres-235
Ruiz et al. 2015) or the presence of open vessels in the samples (Torres-Ruiz, Cochard, 236
Choat, et al. 2017), >2 m-long branches were collected from the trees (one branch per 237
tree), wrapped in moist paper and plastic bags to kill transpiration and transported to the 238
laboratory. Once in the lab, branches were progressively recut under water to release the 239
xylem tension according to Torres-Ruiz et al. (2015) and to adjust them to a 1 m-long 240
length. Branches were debarked at both ends and installed in a large cavitron equipped 241
with a 1 m-diameter custom-built honeycomb rotor (DGMeca, Gradignan, France; (Lobo 242
et al. 2018). Several branches were used to test the presence of open vessels by air 243
injection at 2 bars and none of them presented open vessels in 1 m long branches. Samples 244
were spun for three minutes at a given speed to decrease the xylem pressure progressively 245
at its centre from -0.8 MPa to -10.5 MPa (those pressures correspond to centrifugation 246
rotation from 764 rpm to 2768 rpm respectively). Vulnerability curves to embolism were 247
Version preprint
generated by plotting the percentage loss of hydraulic conductivity (PLC) at the different 248
target pressures applied and fitting a sigmoidal equation (Pammenter and Van der 249
Willigen 1998). Mean P50 values, i.e. the xylem pressure inducing 50% of PLC, were
250
obtained by averaging the values of 13 to 15 samples per provenance. The P50 value is
251
commonly used as a proxy for tree drought resistance: the lower the P50 value, the more
252
drought tolerant the species (Delzon 2015, Torres-Ruiz, Cochard, Fonseca, et al. 2017). 253
Statistical analyses
254
Differences in phenological, physiological, anatomical and hydraulic traits among the 255
nine provenances of Q. petraea were tested with a generalized linear mixed model 256
(MIXED procedure, restricted maximum likelihood (REML) method in SAS, version 9.4,
257
SAS Institute, NC, USA) where plots and provenances were respectively treated as fixed
258
and random factors. The provenance effect was further assessed using a log likelihood 259
ratio test from the full and reduced models (Littell et al. 2007). The data were checked to 260
satisfy the assumptions of normality and homogeneous variance prior to analyses. The
261
ratio of the provenance variance component to total variance was estimated according to
262
Vitasse et al. (2009) using the VARCOMP procedure with the restricted maximum
263
likelihood (REML). These analyses used the following statistical model: Yijk = μ + Pi +
264
bj + (Pb)ij + εijk , with Yijk being the observed trait of the seedling k from the provenance
265
i and block j, μ the overall mean of the analysed characters, Pi the random effect of
266
provenance i, bj the fixed effect of block (here replicated plot) j, (Pb)ij the interaction
267
between provenance i and block j, and εijk the residual variation including the effect of
268
tree k belonging to combination ijk. Variances of random effects (provenance σP2,
269
interaction σbP2, residual σε2) were also computed. The overall differentiation among
270
provenances (D) was calculated as the ratio (%) of the variance component of provenance
271
to total variance estimated by analysis of variance, i.e as σP2 / (σP2 + σbP2 + σε2), and
Version preprint
varied from 0 to 100. D is an analog of Qst (Spitze 1993), which is the genetic
273
differentiation of quantitative traits (Qst = σP2 / (σP2 + 2σA2), where σA2 is the within
274
provenance additive variance. In our study based on provenance and not descendant test,
275
σA2 could not be estimated and we thus used the overall within population phenotypic
276
variance (i.e. D) rather than the overall genetic variance as it is for Qst (Vitasse et al. 2009,
277
Bresson et al. 2011). 278
The variability of each trait was evaluated by estimating both the intra- and
inter-279
provenance coefficient of variation. The CVintra was calculated for each provenance and
280
then averaged at the species level, while the CVinter was obtained from the
between-281
provenance standard deviation and the overall mean value.
282
Weighted linear regression analyses were used to assess (i) relationships between 283
the functional traits that showed significant differences among provenances, and (ii) 284
whether genetic variation was explained by the local environmental conditions (i.e. 285
latitude, temperature and precipitation) of the provenances’ origin. Also, relationships 286
between phenological and functional traits with climate variables were investigated using 287
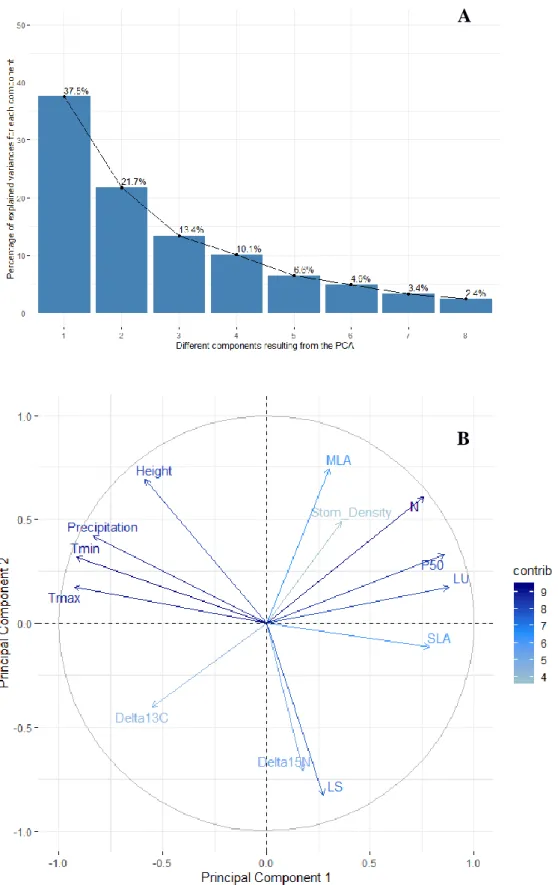
principal component analysis (PCA) in order to identify patterns of interrelationships. 288
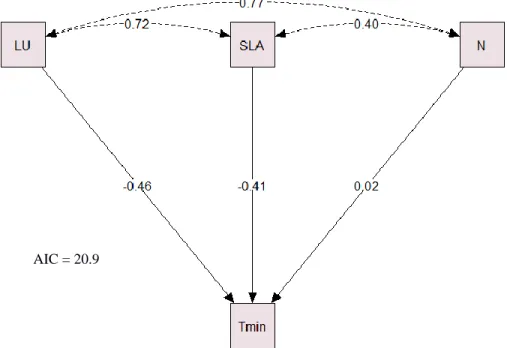
Finally, a path analysis was carried out to test different conceptual models that could 289
explain how the climate at the original location of each provenance determines the 290
variance of the different functional traits. Those models were based on different 291
hypotheses considering only the traits that were the most influenced by temperature and 292
precipitation according to the PCA analyses (Supplementary information Fig. S3). The 293
best model based on the Akaike information criterion (AIC) would therefore provide 294
valuable information about the associations of climate and multitrait values. 295
296
RESULTS
Version preprint
Genetic differentiation
298
Significant genetic differentiation between provenances was observed in four out of the 299
13 studied traits (Table 2). The provenances differ in both the timing of leaf spring and 300
autumn phenology (leaf unfolding and senescence, respectively). Tree height (H) and 301
SLA were also significantly different between provenances, whereas a lack of genetic 302
differentiation was found for MLA, Δ 13C, Δ 15N, leaf C and N content, stomatal density,
303
P50, vein density and wood density. Overall genetic differentiation for the different traits
304
evaluated ranged from 0 up to 79. Thus, SLA and leaf unfolding amounted the highest 305
values with 79 and 62, respectively, whereas it was weaker for, leaf senescence (32) and 306
MLA (5). A null (0.0) overall differentiation was observed for all the other traits (Table 307
2). Most traits showed, to a greater or a lesser extent, higher coefficient of variation across 308
provenances than within provenances (Table 2). Only leaf vein density showed a slightly 309
higher variation within (9) than across provenances (8). 310
311
Genetic clines
312
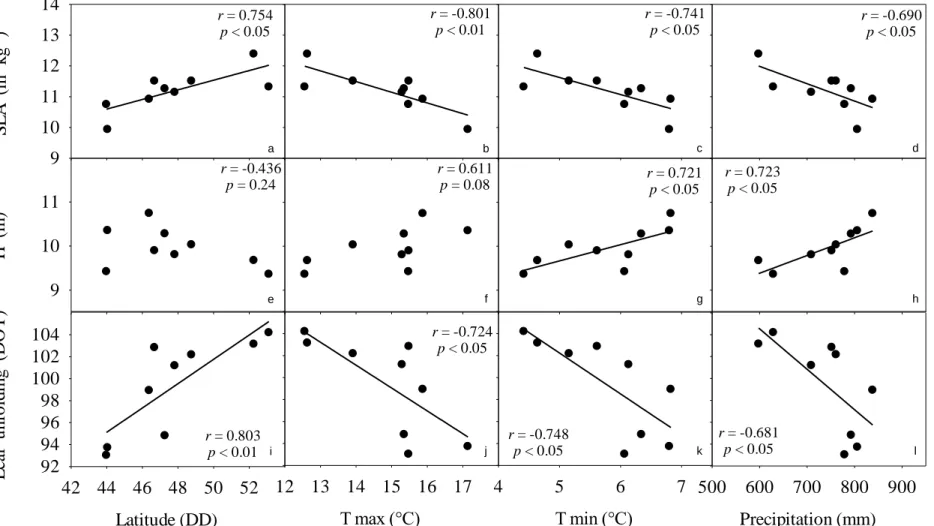
Correlations between traits and the climate and latitude of provenance origin reveal some 313
relevant trends (Fig 2). Thus, positive and negative trends were observed between leaf 314
unfolding and both latitude and temperature of the provenance origin, respectively. Thus, 315
the earliest provenance to begin leaf flushing was the one originating from the southern 316
margin (Latitude 43.98°) whereas the latest was one from northern Germany (Latitude 317
53.18°). Both the mean annual maximum and minimum temperatures correlate with the 318
date of leaf unfolding, with earlier budburst in provenances from warmer areas. Also, late 319
leaf unfolding was observed in areas with lower precipitation. Thus, for the Grésigne 320
provenance with a mean annual precipitation of 806 mm leaf unfolding occurred in DOY 321
(day of year) 93.7, whereas for Göhrde with a precipitation of 629 mm/year it occurred 322
Version preprint
in DOY 104.2, i.e 10.5 days later than for Grésigne. Concerning leaf shedding, while 323
significant genetic differentiation was observed between provenances (Table 2) no 324
significant cline with the climate of provenances was detected (Supplementary 325
information Table S1). A similar pattern as in LU was observed for SLA, with higher
326
values in provenances originating from higher latitudes and colder and drier areas. Thus, 327
mean SLA ranged from 9.95 to 12.39 m2 kg-1 within a range in temperature of 17.14 to
328
4.42°C and in total annual precipitation of 838 to 598mm. Tree height, however, was not 329
significantly affected by latitude or maximum temperature, but significantly increased 330
with increasing minimum temperature and precipitation. Thus, trees are taller (up to 10.74 331
m) in provenances with higher minimum temperatures (6.8°C) and annual precipitation 332
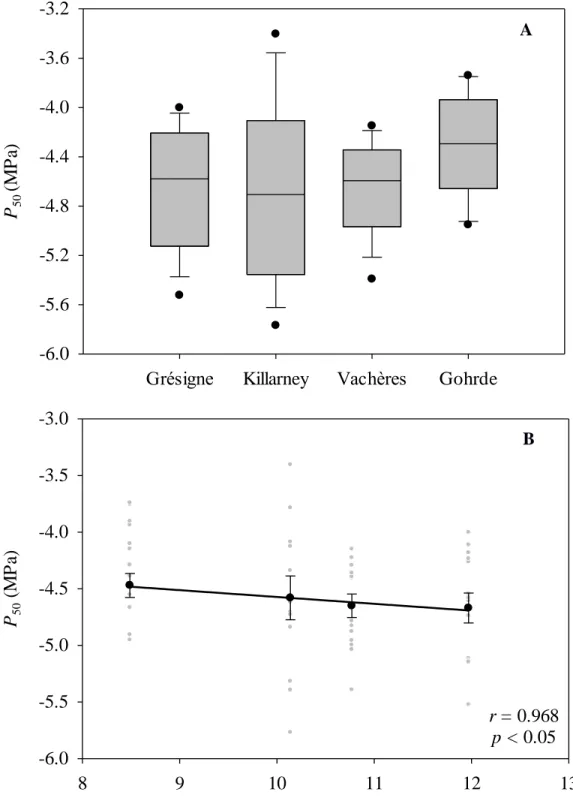
(838 mm) (Fig. 2). Interestingly, xylem resistance to embolism showed similar P50 values
333
across the four provenances evaluated (i.e. no genetic differentiation, Fig. 3A), but a 334
significant correlation with mean annual temperature (MAT), showing increased 335
resistance to embolism with higher MAT (Fig. 3B). Surprisingly, aridity index did not 336
correlate with any of the evaluated traits (Supplementary information Table S1). 337
338
Relationships between phenological and functional traits, and climate variables.
339
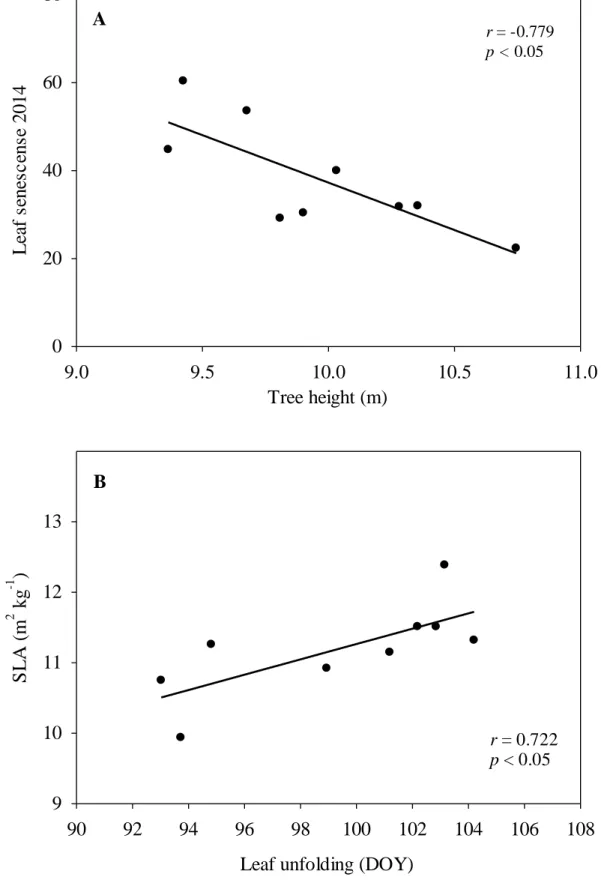
Only a few significant correlations were observed between those traits exhibiting a 340
provenance effect (Table 3). Thus, tight correlations were observed between LS and H 341
(Fig. 4A) and between SLA and leaf unfolding (Fig. 4B) . Thus, lower SLA was observed 342
in those provenances with an earlier flushing, with Grésigne having the lowest SLA value 343
(9.9 m2 kg-1) and flushing in DOY= 94. On the contrary, the highest SLA values was
344
observed for Lappwald (12.4 m2 kg-1) that flushed in DOY= 103. The correlation between
345
LS and H was observed (Fig.4A) reporting a lower percentage of coloured leaves on in 346
taller trees. The PCA showed how the first two principal components together explained 347
Version preprint
59.2% of the variance (Fig. 5A). Thus, Axis 1 (variance 37.5%) was strongly associated 348
with the main climate variables, i.e. maximum and minimum temperature and 349
precipitation, as well as with functional leaf traits leaf unfolding, P50, SLA and N content
350
(Fig. 5B). Axis 2 (variance 21.7%), on the contrary, was more defined by the variance in 351
leaf senescence, MLA, 15N and tree height than by climate variables (Supplementary 352
information Fig. S2). When running the path analyses to detect associations between the
353
main climate variables and the functional traits we found that the minimum temperature 354
at the provenance origin seemed to be the most relevant trait determining their leaf 355
unfolding, SLA and N content values (Fig. 6). 356
357
DISCUSSION
358
Nine provenances of Q. petraea originating from an extensive portion of the species’ 359
overall distribution in Europe showed significant genetic differentiation in traits related 360
to leaf phenology, morphology and growth but not in traits related to xylem anatomy and 361
hydraulics when grown in a common-garden. Phenology and some functional traits such 362
as P50 also showed significant clines with the latitude and climate of provenance origin.
363
Results from PCA and path analyses reported multiple associations between climate 364
variables and both phenology and functional traits that would be driven by a diversifying 365
selection along the studied climatic gradient. 366
Multi-trait associations
367
The effect of climate change on phenological traits has been extensively studied (Peñuelas 368
et al. 2002, Gordo and Sanz 2005), especially the effect of temperature on the timing of 369
leaf unfolding and flowering, which both occur earlier as temperature rises (Doi and 370
Katano 2008, Chung et al. 2013). However, unlike this study, many previous studies have 371
Version preprint
been carried out ‘in situ’, and thus do not allow for any attribution of trait variation to 372
either plasticity or genetic differentiation. Our results from trees grown in a common 373
garden showed a significant cline between leaf unfolding and the climate of provenance 374
origin, with earlier bud burst in provenances from the warm margin. Therefore, local 375
adaptation of phenology to the environmental conditions is observed for Q. petraea. 376
Similar results have been already reported for different tree species including oaks 377
(Menzel and Fabian 1999, Matsumoto et al. 2003, Vitasse et al. 2009), showing the 378
important role of local temperature in driving adaptation of the growing season length. 379
This may partially explain the significant differences in growth (i.e. tree height) observed 380
between provenances although a more complete understanding of the role of the 381
vegetative growth period length and assimilation rates on the final growth of the 382
populations would require a more focused study. In fact, our results also agree with a 383
previous study by Kuster et al. (2014) in which three different oak species were grown 384
on two different soils and exposed to air warming and drought. Their results showed 385
earlier leaf unfolding for trees exposed to higher air temperatures, leading to an earlier 386
start of shoot growth, in that they estimated an advance in leaf unfolding of 1-3 days °C−1.
387
Our results also agree with those reported by (Vitasse et al. 2009) who observed negative 388
genetic clines in leaf unfolding with increasing temperature at the origin of the 389
provenance for Quercus petraea. More recent studies (Alberto et al. 2011, Firmat et al. 390
2017) reported a similar genetic cline for both germination and bud burst timing with 391
provenance elevation in Q. petraea, showing that spring leaf phenological traits are 392
critical for local adaptation in oaks. Those genetic variations in leaf phenology observed 393
in oaks are probably due to differences in heat requirement for bud burst rather than 394
differences in chilling-associated with leaf shedding (Dantec et al. 2015). 395
Version preprint
In contrast with other studies (Vitasse et al. 2009), a clinal trend with temperature 396
was not observed for leaf senescence in our study despite the significant variation in this 397
trait among provenances and despite showing the highest between-provenance variation 398
value. This is confirmed by the results from the PCA showing that, contrary to leaf 399
unfolding, the variation in leaf senescence is barely determined by the temperature and 400
precipitation regimes of the provenances’ origin. 401
Significant genetic differentiation in SLA, a trait directly related to light 402
conditions and nutrient availability (Milla et al. 2008), was observed between 403
provenances, indicating genetic variation among provenances induced by the climate at 404
their original location. Similar to “in situ” observations from Bresson et al. (2011) for 405
Quercus petraea, we observed a negative correlation between SLA and both temperature
406
and precipitation. In fact, results from the PCA show exactly this: a high influence of the 407
minimum and maximum temperatures and precipitation not only on SLA, but also on 408
other traits such as P50 and leaf unfolding. Intraspecific variation in SLA with air
409
temperature and precipitation have been already reported for other species including 410
maize and wheat for which, under N fertilization and irrigation controlled conditions, 411
responses to both climate variables explained 43.7 % of the variation in SLA (Martin et 412
al. 2018). Earlier leaf unfolding would increase leaf lifespan which has been reported to 413
be correlated with SLA. Thus, across species, Reich et al. (1991) showed that species 414
with short leaf lifespan generally have thinner leaves (high SLA) than those with longer 415
leaf lifespan, which agrees with our results within species. As the authors suggested, the 416
correlation between leaf lifespan, and therefore leaf unfolding, and SLA would result 417
from different allocation trade-offs between species to enhance productivity, nutrient 418
conservation or defence. This could also be the case at the intraspecific level and may 419
explain observed differences between provenances. The relevance of the adaptation of 420
Version preprint
SLA to climate resides in the fact that it may contribute to a species’ ability to adjust to 421
different air temperatures and precipitation regimes (Albert et al. 2010, Long et al. 2011), 422
because SLA is a key plant functional trait reflecting the trade-off between resource 423
capture and conservation (Wright et al. 2004). Interestingly, no genetic differences were 424
found in leaf size between provenances. This finding links with a recent study evaluating 425
the bivariate leaf size-climate relationships for 7670 plant species from 682 sites 426
worldwide that shows how day and night time leaf-to-air temperature differences are key 427
to explaining the latitudinal gradient in leaf size (Wright et al. 2017). So, considering the 428
results from Wright et al. (2017) and our results, latitudinal changes in leaf size would be 429
likely due to phenotypic plasticity rather than to genetic variation. 430
Lack of evidence for local adaptation
431
Leaf vein and stomatal density are directly linked with plant transpiration 432
(Brodribb et al. 2007, Franks and Beerling 2009) and also highly influenced by 433
environmental factors (Woodward and Bazzaz 1988, Uhl and Mosbrugger 1999), with 434
higher stomatal and venation densities in drier areas (Herbig and Kull 1992, Carlson et 435
al. 2016). Furthermore, both traits, tend to remain proportional during leaf acclimation to 436
light intensity and VPD in woody angiosperm species (Brodribb and Jordan 2011, Carins 437
Murphy et al. 2012, 2014, 2016). However, the determinism of these traits has received 438
limited attention so far (Zhu et al. 2012). Assuming these traits varied between 439
provenances in situ, which is likely given the capacity for acclimation in vein density to 440
variation in evaporative demand among the upper and lower canopy in the closely related 441
Quercus rubra (Zwieniecki et al. 2004), our results suggest that leaf capacity to acclimate
442
to different conditions via changes to these anatomical traits is not translated into genetic 443
differences. In fact, there is no evidence for genetically driven effects on stomatal density 444
in Quercus petraea L. and Fagus sylvatica, although the phenotypic effect of temperature 445
Version preprint
is large (Bresson et al. 2011). However, contrary to this, vein density was found to be 446
genotypically fixed in Quercus variabilis (Zhu et al. 2012). A possible explanation for 447
our observation that these traits that tend to show large phenotypic variation appear to 448
have not responded to divergent selection here is that the populations sampled could have 449
not spanned all the variation within the distribution area of this species. However, an 450
efficient phenotypic plasticity response could also have had an important role in the lack 451
of variation observed for these traits since it would lead to convergence among 452
populations in trait expression when grown in a common garden. An alternative 453
explanation is that other traits not measured in this study but that also contribute to leaf 454
water supply and demand varied among provenances. For example, stomatal size, along 455
with stomatal density, determines stomatal conductance to water vapour. Likewise, the 456
distance between vein tips and stomata, along with the horizontal spacing of veins, 457
determines the length of the post-vein pathway from the end of the vascular system to the 458
sites of evaporation in the leaf which itself is correlated with leaf hydraulic conductance 459
(Brodribb et al. 2007). In this study differences were found in SLA but not in leaf size 460
implying that leaf thickness varied among provenances. This may have altered the post-461
vein pathlength for water. However, the distance between veins tends to equal the distance 462
between veins and the evaporative surface in derived angiosperms (Zwieniecki and Boyce 463
2014). More detailed study is therefore required to determine whether the lack of variation 464
in vein and stomatal density among provenances is due to strong plasticity or genetic 465
changes in other leaf traits. 466
In many cases, traits exhibiting plasticity also show genetic differentiation 467
(Kremer et al. 2013), unless their heritability is extremely low. Therefore, an interesting 468
follow up of this study would be to explore whether there is enough genetic diversity 469
Version preprint
within populations on which diversifying selection may act since it may be very important 470
for the species potential to adapt to future changes in climate. 471
Increases in shoot growth and leaf area allocation due to higher temperatures result 472
in decreases in plant N concentration and leaf N content (Weih and Karlsson 2002). This 473
explains the negative correlation reported by the PCA between leaf N content and 474
temperature and precipitation for the different provenances. In fact, from all the models 475
tested to identify which climate variable determines the variance in the functional traits 476
most influenced by climate, the one that fits best with our results suggests that minimum 477
temperature is the main climate variable determining leaf N content, SLA and leaf 478
unfolding for each provenance. 479
Water Use Efficiency (WUE), which corresponds to the ratio of biomass 480
produced to the rate of transpiration can be estimated by measuring the carbon isotope 481
discrimination. While previous studies in oak showed intraspecific genetic variations in 482
Δ13C in Quercus (Q. robur and Q. petraea, Ponton et al. 2002) (Q. robur and Q. 483
pyrenaica,Granda et al. 2018) in Pinus pinaster (Lamy et al. 2014) and in Populus nigra
484
(Guet et al. 2015), our results showed no significant genetic differentiation between 485
provenances in Quercus petraea. The lack of genetic differentiation between populations 486
might be explained by the advantage of increased efficiency of water use in conserving 487
soil moisture, which could be more predominant in Mediterranean and semiarid climates. 488
Our results however agree with those reported by Chamaillard et al. (2011) showing no 489
differences in leaf C content among three populations of Populus nigra grown in a 490
common garden, even when they were subjected to different water treatments. Whether 491
our target species, Quercus petraea, is less prone to the occurrence of genetic differences 492
for given physiological traits than other species is an emerging question that needs to be 493
addressed in future studies. 494
Version preprint
Resistance to embolism varies across plants species and helps to explain species 495
distributions across climatic gradients (i.e. water scarcity; Choat et al. 2012). However, 496
low or no variability in resistance to embolism are usually reported within species (Lamy 497
et al. 2014, González-Muñoz et al. 2018). Lamy et al. (2011) showed a strong uniform 498
selection or canalisation for this trait shaped the lack of genetic variation. There are some 499
studies showing a significant correlation between P50 and climate variables (Brodribb et
500
al. 2014, Larter et al. 2017), especially temperature (Kavanagh et al. 1999), although this 501
is not a common pattern in either ‘in situ’ studies or common garden experiments 502
(Martínez-Vilalta et al. 2009, Lamy et al. 2014). Recently, Stojnić et al. (2018) attributed 503
lack of variability to an ascertainment bias, as most populations in reported studies 504
originate from the core of the species distribution. Hence, significant differences are 505
observed when marginal populations growing in areas subject to unsuitable conditions 506
for the species are considered. In our study, despite the contrasting climate at the original 507
location of the four provenances that would induce differences in potential 508
evapotranspiration (PET, no data available), xylem resistance to embolism showed 509
similar P50 values. Therefore, contrary to Cavender-Bares (2018) our results do not
510
evidence a role of evolvability for hydraulic traits that could have allowed adaptation to 511
changing environments. The minor differences observed however, correlate with mean 512
temperature, with more resistant individuals originating from the warm margin. This 513
could affect the performance of individuals from the different populations although only 514
slightly. In fact, as for SLA, leaf unfolding and leaf N content, P50 seems to be altered by
515
the main climate variables evaluated (i.e. precipitation and maximum and minimum 516
temperatures) as the PCA shows. This result is similar to what has been observed for 517
Quercus oleoides in which variation among populations associated with climates of origin
518
have been found despite a lack of local adaptation (Cavender-Bares 2018). Blackman et 519
Version preprint
al. (2017) also showed how P50 was related to mean annual temperature across eight
520
populations of Corymbia calophylla grown in a common garden experiment. Wood 521
density has been theoretically linked with resistance to embolism based on the avoidance 522
of implosion/collapse events in the xylem vessels (Hacke et al. 2001), because it is closely 523
related to climate, and in particular precipitation and aridity, across species (Martínez-524
Cabrera et al. 2009). The lack of significant correlation between wood density and the 525
climate variables analysed and the low contribution to the principal component 1 of the 526
PCA (i.e. the one more influenced by climate), suggests that this anatomical trait is 527
differently affected by climate than resistance to embolism and that, therefore, it could 528
not work as an accurate proxy for P50 at an intra-specific level. Despite this, more studies
529
including more provenances from the marginal distribution area of the species and more 530
species with different xylem anatomical characteristics are required to definitely reject 531
wood density as proxy for embolism resistance within species. 532
533
CONCLUSIONS
534
Our results evidenced that different Quercus petraea provenances originating from an 535
extensive portion of the species’ overall distribution in Europe showed important genetic 536
variation for traits related to phenology and growth. In fact, genetic differentiation is 537
much higher for leaf phenological traits than for other functional traits directly related 538
with plant tolerance to drought such as hydraulic traits. Most anatomical, physiological 539
and hydraulics traits evaluated, except SLA, did not show any significant variation 540
between provenances, or very minor genetic differentiation, although large between trees 541
(within populations) variations were observed. This raises the question of whether the 542
multiple-trait associations are more driven by very integrated traits, i.e. by traits that can 543
give synthetic information about interactions between the plant and their environment 544
Version preprint
such as growth, phenology and SLA. Despite this, there are some less integrated traits, 545
e.g. leaf N content, highly influenced by the climate at the origin of the provenances that, 546
although they did not show genetic divergence, they could be a good target of selection 547
for individuals from marginal populations, i.e. with highly contrasted climate conditions. 548
Whether the lack of variation in certain traits in this species is due to phenotypic plasticity 549
remains to be investigated. In any case, we suspect that there is enough genetic variation 550
within populations to trigger genetic divergence among populations. While experimental 551
evolution cannot be implemented to check our hypothesis, future investigations will 552
explore whether anatomical, physiological and hydraulics traits do exhibit significant 553 selection gradients. 554 555 ACKNOWLEDGEMENTS 556
We thank the Experimental Unit of INRA Nancy (UEFL, Unité Expérimentale Forestière 557
de Lorraine) for their contribution during field assessments and field collection. 558
TREEPEACE team for field sampling and trait measurements in the lab. 559
FUNDING INFORMATION.
560
This study was supported by the ERC project TREEPEACE (FP7-339728) and the 561
‘Investments for the Future’ (ANR-10-EQPX-16, XYLOFOREST) programme of the 562
French National Agency for Research and from the Labex COTE program. JMTR was 563
supported by the Visiting Fellows & Visiting Scholars Program of the University of 564
Tasmania to carry out part of the measurements at the University of Tasmania. 565
AUTHORS’ CONTRIBUTIONS
Version preprint
AK and SDconceived the ideas and, together with R, designed methodology.
JMT-567
R, LT, FB, AD and SD collected the samples and carried out most of the measurements 568
related with phenology and anatomy. JMT-R, MRC-M and TB collected and analysed the 569
vein and stomatal density data. LJL and JMT-R ran the statistical analyses. All authors 570
contributed critically to the drafts and gave final approval for publication. 571 572 573 574 575 576 577 References 578
Aitken SN, Yeaman S, Holliday JA, Wang T, Curtis-McLane S (2008) Adaptation, migration or 579
extirpation: climate change outcomes for tree populations. Evol Appl 1:95–111. 580
Albert C, Thuiller W, Yoccoz N, Soudant A, Boucher F, Saccone P, Lavorel S (2010) Intraspecific 581
functional variability: Extent, structure and sources of variation. J Ecol 98:604–613. 582
Alberto F, Bouffier L, Louvet J-M, Lamy J-B, Delzon S, Kremer A (2011) Adaptive responses 583
for seed and leaf phenology in natural populations of sessile oak along an altitudinal 584
gradient. J Evol Biol 24:1442–1454. 585
Aletà i Soler N, Vilanova A, Díaz R, Voltas Velasco J (2009) Genetic variation for carbon isotope 586
composition in Juglans regia L.: relationships with growth, phenology and climate of 587
origin. https://repositori.udl.cat/handle/10459.1/30357 (17 June 2019, date last accessed 588
). 589
Allen CD (2014) Forest ecosystem reorganization underway in the Southwestern US: A preview 590
of widespread forest changes in the Anthropocene. U.S. Department of Agriculture: 591
Rocky Mountain Research Station. http://pubs.er.usgs.gov/publication/70156788 (13 592
June 2019, date last accessed ). 593
Allen CD, Macalady AK, Chenchouni H, Bachelet D, McDowell N, Vennetier M, Kitzberger T, 594
Rigling A, Breshears DD, Hogg EH (Ted), Gonzalez P, Fensham R, Zhang Z, Castro J, 595
Demidova N, Lim J-H, Allard G, Running SW, Semerci A, Cobb N (2010) A global 596
Version preprint
overview of drought and heat-induced tree mortality reveals emerging climate change 597
risks for forests. For Ecol Manag 259:660–684. 598
Amano Tatsuya, Smithers Richard J., Sparks Tim H., Sutherland William J. (2010) A 250-year 599
index of first flowering dates and its response to temperature changes. Proc R Soc B Biol 600
Sci 277:2451–2457. 601
Anderson JT, Inouye DW, McKinney AM, Colautti RI, Mitchell-Olds T (2012) Phenotypic 602
plasticity and adaptive evolution contribute to advancing flowering phenology in 603
response to climate change. Proc Biol Sci 279:3843–3852. 604
Arnold R, Johnson IG, Owen JV (2004) Genetic variation in growth, stem straightness and wood 605
properties in Eucalyptus dunnii trials in northern New South Wales. For Genet 11:1–12. 606
Bertin RI (2008) Plant Phenology And Distribution In Relation To Recent Climate Change. J 607
Torrey Bot Soc 135:126–146. 608
Blackman CJ, Aspinwall MJ, Tissue DT, Rymer PD (2017) Genetic adaptation and phenotypic 609
plasticity contribute to greater leaf hydraulic tolerance in response to drought in warmer 610
climates. Tree Physiol 37:583–592. 611
Bresson CC, Vitasse Y, Kremer A, Delzon S (2011) To what extent is altitudinal variation of 612
functional traits driven by genetic adaptation in European oak and beech? Tree Physiol 613
31:1164–1174. 614
Brienen RJW, Wanek W, Hietz P (2011) Stable carbon isotopes in tree rings indicate improved 615
water use efficiency and drought responses of a tropical dry forest tree species. Trees 616
25:103–113. 617
Brodribb TJ, Cochard H (2009) Hydraulic Failure Defines the Recovery and Point of Death in 618
Water-Stressed Conifers. PLANT Physiol 149:575–584. 619
Brodribb TJ, Feild TS, Jordan GJ (2007) Leaf Maximum Photosynthetic Rate and Venation Are 620
Linked by Hydraulics. Plant Physiol 144:1890–1898. 621
Brodribb TJ, Jordan GJ (2011) Water supply and demand remain balanced during leaf acclimation 622
of Nothofagus cunninghamii trees. New Phytol 192:437–448. 623
Brodribb TJ, McAdam SAM, Jordan GJ, Martins SCV (2014) Conifer species adapt to low-624
rainfall climates by following one of two divergent pathways. Proc Natl Acad Sci 625
111:14489–14493. 626
Cailleret M, Jansen S, Robert EMR, Desoto L, Aakala T, Antos JA, Beikircher B, Bigler C, 627
Bugmann H, Caccianiga M, Čada V, Camarero JJ, Cherubini P, Cochard H, Coyea MR, 628
Čufar K, Das AJ, Davi H, Delzon S, Dorman M, Gea-Izquierdo G, Gillner S, Haavik LJ, 629
Hartmann H, Hereş A-M, Hultine KR, Janda P, Kane JM, Kharuk VI, Kitzberger T, Klein 630
T, Kramer K, Lens F, Levanic T, Linares Calderon JC, Lloret F, Lobo-Do-Vale R, 631
Lombardi F, López Rodríguez R, Mäkinen H, Mayr S, Mészáros I, Metsaranta JM, 632
Minunno F, Oberhuber W, Papadopoulos A, Peltoniemi M, Petritan AM, Rohner B, 633
Sangüesa-Barreda G, Sarris D, Smith JM, Stan AB, Sterck F, Stojanović DB, Suarez ML, 634
Svoboda M, Tognetti R, Torres-Ruiz JM, Trotsiuk V, Villalba R, Vodde F, Westwood 635
AR, Wyckoff PH, Zafirov N, Martínez-Vilalta J (2017) A synthesis of radial growth 636
patterns preceding tree mortality. Glob Change Biol 23:1675–1690. 637
Carins Murphy MR, Jordan GJ, Brodribb TJ (2012) Differential leaf expansion can enable 638
hydraulic acclimation to sun and shade. Plant Cell Environ 35:1407–1418. 639
Version preprint
Carins Murphy MR, Jordan GJ, Brodribb TJ (2016) Cell expansion not cell differentiation 640
predominantly co-ordinates veins and stomata within and among herbs and woody 641
angiosperms grown under sun and shade. Ann Bot 118:1127–1138. 642
Carlson JE, Adams CA, Holsinger KE (2016) Intraspecific variation in stomatal traits, leaf traits 643
and physiology reflects adaptation along aridity gradients in a South African shrub. Ann 644
Bot 117:195–207. 645
Cavender-Bares J (2018) Diversification, adaptation, and community assembly of the American 646
oaks ( Quercus ), a model clade for integrating ecology and evolution. New Phytol 221 647
Chamaillard S, Fichot R, Vincent-Barbaroux C, Bastien C, Depierreux C, Dreyer E, Villar M, 648
Brignolas F (2011) Variations in bulk leaf carbon isotope discrimination, growth and 649
related leaf traits among three Populus nigra L. populations. Tree Physiol 31:1076–1087. 650
Choat B, Brodribb TJ, Brodersen CR, Duursma RA, López R, Medlyn BE (2018) Triggers of tree 651
mortality under drought. Nature 558:531–539. 652
Choat B, Jansen S, Brodribb TJ, Cochard H, Delzon S, Bhaskar R, Bucci SJ, Feild TS, Gleason 653
SM, Hacke UG, Jacobsen AL, Lens F, Maherali H, Martínez-Vilalta J, Mayr S, 654
Mencuccini M, Mitchell PJ, Nardini A, Pittermann J, Pratt RB, Sperry JS, Westoby M, 655
Wright IJ, Zanne AE (2012) Global convergence in the vulnerability of forests to drought. 656
Nature 491:752–755. 657
Chung H, Muraoka H, Nakamura M, Han S, Muller O, Son Y (2013) Experimental warming 658
studies on tree species and forest ecosystems: a literature review. J Plant Res 126:447– 659
460. 660
Corlett RT, Westcott DA (2013) Will plant movements keep up with climate change? Trends Ecol 661
Evol 28:482–488. 662
Craig H (1957) Isotopic standards for carbon and oxygen and correction factors for mass-663
spectrometric analysis of carbon dioxide. Geochim Cosmochim Acta 12:133–149. 664
Cregg BM, Zhang JW (2001) Physiology and morphology of Pinus sylvestris seedlings from 665
diverse sources under cyclic drought stress. For Ecol Manag 154:131–139. 666
Dantec CF, Ducasse H, Capdevielle X, Fabreguettes O, Delzon S, Desprez-Loustau M-L (2015) 667
Escape of spring frost and disease through phenological variations in oak populations 668
along elevation gradients Thrall P (ed). J Ecol 103:1044–1056. 669
David-Schwartz R, Paudel I, Mizrachi M, Delzon S, Cochard H, Lukyanov V, Badel E, 670
Capdeville G, Shklar G, Cohen S (2016) Indirect Evidence for Genetic Differentiation in 671
Vulnerability to Embolism in Pinus halepensis. Front Plant Sci 7:768. 672
Deacon NJ, Cavender-Bares J (2015) Limited Pollen Dispersal Contributes to Population Genetic 673
Structure but Not Local Adaptation in Quercus oleoides Forests of Costa Rica. PLOS 674
ONE 10:e0138783. 675
Delzon S (2015) New insight into leaf drought tolerance. Funct Ecol 29:1247–1249. 676
Delzon S, Urli M, Samalens J-C, Lamy J-B, Lischke H, Sin F, Zimmermann NE, Porté AJ (2013) 677
Field Evidence of Colonisation by Holm Oak, at the Northern Margin of Its Distribution 678
Range, during the Anthropocene Period. PLOS ONE 8:e80443. 679
Version preprint
Doi H, Katano I (2008) Phenological timings of leaf budburst with climate change in Japan. Agric 680
For Meteorol 148:512–516. 681
Ducousso A, Guyon JP, Krémer A (1996) Latitudinal and altitudinal variation of bud burst in 682
western populations of sessile oak (Quercus petraea (Matt) Liebl). Ann Sci For 53:775– 683
782. 684
Farquhar GD, Richards RA (1984) Isotopic Composition of Plant Carbon Correlates With Water-685
Use Efficiency of Wheat Genotypes. Funct Plant Biol 11:539–552. 686
Firmat C, Delzon S, Louvet J-M, Parmentier J, Kremer A (2017) Evolutionary dynamics of the 687
leaf phenological cycle in an oak metapopulation along an elevation gradient. J Evol Biol 688
30:2116–2131. 689
Francey RJ, Allison CE, Etheridge DM, Trudinger CM, Enting IG, Leuenberger M, Langenfelds 690
RL, Michel E, Steele LP (1999) A 1000-year high precision record of δ 13 C in
691
atmospheric CO 2. Tellus B Chem Phys Meteorol 51:170–193.
692
Franks PJ, Beerling DJ (2009) Maximum leaf conductance driven by CO2 effects on stomatal 693
size and density over geologic time. Proc Natl Acad Sci 106:10343–10347. 694
Franks SJ, Weber JJ, Aitken SN (2014) Evolutionary and plastic responses to climate change in 695
terrestrial plant populations. Evol Appl 7:123–139. 696
González-Muñoz N, Sterck F, Torres-Ruiz JM, Petit G, Cochard H, von Arx G, Lintunen A, 697
Caldeira MC, Capdeville G, Copini P, Gebauer R, Grönlund L, Hölttä T, Lobo-do-Vale 698
R, Peltoniemi M, Stritih A, Urban J, Delzon S (2018) Quantifying in situ phenotypic 699
variability in the hydraulic properties of four tree species across their distribution range 700
in Europe Heinze B (ed). PLOS ONE 13:e0196075. 701
Gordo O, Sanz JJ (2005) Phenology and climate change: a long-term study in a Mediterranean 702
locality. Oecologia 146:484–495. 703
Granda E, Alla AQ, Laskurain NA, Loidi J, Sánchez-Lorenzo A, Camarero JJ (2018) Coexisting 704
oak species, including rear-edge populations, buffer climate stress through xylem 705
adjustments. Tree Physiol 38:159–172. 706
Guay R, Gagnon R, Morin H (1992) A new automatic and interactive tree-ring measurement 707
system based on a line scan camera. For Chron 68 708
Guet J, Fabbrini F, Fichot R, Sabatti M, Bastien C, Brignolas F (2015) Genetic variation for leaf 709
morphology, leaf structure and leaf carbon isotope discrimination in European 710
populations of black poplar (Populus nigra L.). Tree Physiol 35:850–863. 711
Hacke UG, Sperry JS, Pockman WT, Davis SD, McCulloh KA (2001) Trends in wood density 712
and structure are linked to prevention of xylem implosion by negative pressure. Oecologia 713
126:457–461. 714
Herbig A, Kull U (1992) Leaves and ramification. http://elib.uni-stuttgart.de/handle/11682/2315 715
(19 June 2019, date last accessed ). 716
Hoffmann AA, Sgrò CM (2011) Climate change and evolutionary adaptation. Nature 470:479– 717
485. 718
Kavanagh KL, Bond BJ, Aitken SN, Gartner BL, Knowe S (1999) Shoot and root vulnerability 719
to xylem cavitation in four populations of Douglas-fir seedlings. Tree Physiol 19:31–37. 720
Version preprint
Kremer A, Potts B, Delzon S (2013) Genetic divergence in forest trees: Understanding the 721
consequences of climate change. Funct Ecol 28 722
Kuster TM, Dobbertin M, Günthardt-Goerg MS, Schaub M, Arend M (2014) A Phenological 723
Timetable of Oak Growth under Experimental Drought and Air Warming. PLOS ONE 724
9:e89724. 725
Lamy J-B, Bouffier L, Burlett R, Plomion C, Cochard H, Delzon S (2011) Uniform Selection as 726
a Primary Force Reducing Population Genetic Differentiation of Cavitation Resistance 727
across a Species Range. PLOS ONE 6:e23476. 728
Lamy J-B, Delzon S, Bouche PS, Alia R, Vendramin GG, Cochard H, Plomion C (2014) Limited 729
genetic variability and phenotypic plasticity detected for cavitation resistance in a 730
Mediterranean pine. New Phytol 201:874–886. 731
Larter M, Pfautsch S, Domec J-C, Trueba S, Nagalingum N, Delzon S (2017) Aridity drove the 732
evolution of extreme embolism resistance and the radiation of conifer genus Callitris. 733
New Phytol 215:97–112. 734
Littell RC, Milliken G, Stroup WW, Wolfinger R, E. Schabenberger O (2007) SAS for mixed 735
models. In: American Statistician - AMER STATIST. 736
Lobo A, Torres-Ruiz JM, Burlett R, Lemaire C, Parise C, Francioni C, Truffaut L, Tomášková I, 737
Hansen JK, Kjær ED, Kremer A, Delzon S (2018) Assessing inter- and intraspecific 738
variability of xylem vulnerability to embolism in oaks. For Ecol Manag 424:53–61. 739
Long W, Zang R, Schamp BS, Ding Y (2011) Within- and among-species variation in specific 740
leaf area drive community assembly in a tropical cloud forest. Oecologia 167:1103–1113. 741
Martin AR, Hale CE, Cerabolini BEL, Cornelissen JHC, Craine J, Gough WA, Kattge J, Tirona 742
CKF (2018) Inter- and intraspecific variation in leaf economic traits in wheat and maize. 743
AoB PLANTS 10:ply006. 744
Martínez-Cabrera HI, Jones CS, Espino S, Schenk HJ (2009) Wood anatomy and wood density 745
in shrubs: Responses to varying aridity along transcontinental transects. Am J Bot 746
96:1388–1398. 747
Martínez-Vilalta J, Cochard H, Mencuccini M, Sterck F, Herrero A, Korhonen JFJ, Llorens P, 748
Nikinmaa E, Nolè A, Poyatos R, Ripullone F, Sass-Klaassen U, Zweifel R (2009) 749
Hydraulic adjustment of Scots pine across Europe. New Phytol 184:353–364. 750
Matsumoto K, Ohta T, Irasawa M, Nakamura T (2003) Climate change and extension of the 751
Ginkgo biloba L. growing season in Japan. Glob Change Biol 9:1634–1642. 752
McCarroll D, Loader NJ (2004) Stable isotopes in tree rings. Quat Sci Rev 23:771–801. 753
McDowell NG, Ryan MG, Zeppel MJB, Tissue DT (2013) Feature: Improving our knowledge of 754
drought-induced forest mortality through experiments, observations, and modeling. New 755
Phytol 200:289–293. 756
Meireles JE, Beulke A, Borkowski DS, Romero-Severson J, Cavender-Bares J (2017) Balancing 757
selection maintains diversity in a cold tolerance gene in broadly distributed live oaks. 758
Genome 60:762–769. 759