HAL Id: hal-01659241
https://hal.archives-ouvertes.fr/hal-01659241
Submitted on 8 Dec 2017HAL is a multi-disciplinary open access
archive for the deposit and dissemination of sci-entific research documents, whether they are pub-lished or not. The documents may come from teaching and research institutions in France or abroad, or from public or private research centers.
L’archive ouverte pluridisciplinaire HAL, est destinée au dépôt et à la diffusion de documents scientifiques de niveau recherche, publiés ou non, émanant des établissements d’enseignement et de recherche français ou étrangers, des laboratoires publics ou privés.
Prediction of outcome using pretreatment 18F-FDG
PET/CT and MRI radiomics in locally advanced
cervical cancer treated with chemoradiotherapy
François Lucia, Dimitris Visvikis, Marie-Charlotte Desseroit, Omar Miranda,
Jean-Pierre Malhaire, Philippe Robin, Olivier Pradier, Mathieu Hatt, Ulrike
Schick
To cite this version:
François Lucia, Dimitris Visvikis, Marie-Charlotte Desseroit, Omar Miranda, Jean-Pierre Malhaire, et al.. Prediction of outcome using pretreatment 18F-FDG PET/CT and MRI radiomics in locally advanced cervical cancer treated with chemoradiotherapy. European Journal of Nuclear Medicine and Molecular Imaging, Springer Verlag (Germany), In press. �hal-01659241�
1
Prediction of outcome using pretreatment
18F-FDG PET/CT and MRI radiomics in locally
advanced cervical cancer treated with chemoradiotherapy
François Lucia
1, Dimitris Visvikis
2, Marie-Charlotte Desseroit
2, Omar Miranda
1, Jean-Pierre
Malhaire
1, Philippe Robin
3, Olivier Pradier
1,2, Mathieu Hatt*
2, Ulrike Schick*
1,2* equally contributed
1. Radiation Oncology department, University Hospital, Brest, France
2. LaTIM, INSERM, UMR 1101, University of Brest, ISBAM, UBO, UBL, Brest, France 3. Nuclear Medicine department, University Hospital, Brest, France
Corresponding author: François Lucia Service de radiothérapie
CHRU Morvan, 2 avenue Foch 29609 Cedex, Brest, France Tel: +33 6 99 74 03 18
E-mail: francois.lucia@gmail.com ORCID ID : 0000-0001-7286-1350 Wordcount: ~5100
2
INTRODUCTION
Cervical cancer (CC) is among the most commonly diagnosed cancers for women, with over 500000 new cases annually worldwide resulting in over 270,000 deaths [1]. A significant proportion of patients are diagnosed at a locally advanced stage, and are usually treated with pelvic external beam radiotherapy (EBRT) in association with cisplatin-based chemotherapy and subsequent brachytherapy (BT). Although chemoradiotherapy (CRT) has significantly improved loco-regional control (LRC) and outcome, approximately 40% of patients suffer from recurrence and eventually die of disease. Several clinical and histopathological variables have been identified as prognostic factors in CC patients, including International Federation of Gynecology and Obstetrics (FIGO) stage, histology and lymph node (LN) metastases [2]. Nevertheless, clinical outcomes are markedly variable among patients with similar stage, which cannot be explained by differences in clinico-pathological features only [2]. Yet the treatment modality choice is based on conventional FIGO and N staging, without prior knowledge regarding CRT efficacy. A more tailored approach based on pre-treatment prediction of recurrence and LRC may allow choosing the appropriate treatment for patients with more aggressive CC [3].
18
F-fluorodeoxyglucose (FDG) positron emission tomography/computed tomography (PET/CT) and magnetic resonance imaging (MRI) play an essential role in the initial staging, therapeutic strategy [4] and treatment response assessment [5]. Recently, in addition to conventional parameters on FDG PET/CT and MRI used to stage disease, plan treatment and assess response there has been a growing interest in the extraction of quantitative features from medical images, denoted radiomics [6]. Radiomics features are statistical or model-based metrics to quantify tumor intensity, shape and heterogeneity which have been shown to reflect intratumoral histopathological properties [7] and to provide prognostic information in several pathologies[8] including CC [9-13]. Radiomics on pretreatment PET/CT has been shown to predict response to therapy and risk of pelvic recurrence in CC [9, 11, 13] and used to characterize CC lesions from diffusion-weighted MRI (DW-MRI) [12] or dynamic contrast enhancement MRI (DCE-MRI) [10]. However, a radiomics signature from both FDG-PET and MRI associated with the outcome of patients with locally advanced CC (LACC) has not yet been described.
Our goal was to develop and validate such a PET/MRI signature with prognostic value for LRC and disease-free survival (DFS) in patients with LACC (stage IB1 to IVA) and to assess its incremental value with respect to the standard clinical and imaging features.
3
MATERIALS AND METHODS Patients
Patients with histologically proven LACC, staged IB1-IVA (FIGO 2009 definition) and treated with definitive curative CRT and subsequent BT from August 2010 to December 2016 (to ensure a minimum follow-up of 6 months) at our institution were included in this retrospective study (table 1). Patients with stage IB1 and IIA1 were only considered for inclusion if they had positive LN.
All patients were required to have pelvic examination, PET/CT imaging and pelvic MRI at diagnosis, and at least 6-month of follow-up. Exclusion criteria were history of previous chemotherapy or RT and/or metastatic disease.
Collected data included age and date of diagnosis, histology, FIGO stage, presence of positive LN on PET/CT, tumor size as measured on MRI, body mass index (BMI), complete blood counts (CBC) before treatment, EBRT and BT dose, date and status at last follow-up. Date and site of recurrence were also collected. Recurrences were considered as local (vaginal and/or cervical), regional (pelvic/para-aortic), or distant (upper abdominal and/or extra-abdominal) [14].
A total of 102 patients were recruited and split into training -patients treated from 08/2010 to 05/2015, n=69 (68%)- and testing -patients treated after 05/2015, n=33 (32%)- sets. All patients provided signed permission for the use of their clinical data for scientific purposes and informed consent for the anonymous publication of data. Institutional Review Board approved this study.
Imaging PET/CT
The Philips Gemini (Philips Medical Systems, Cleveland, OH) was used for the 6 first patients and the Siemens Biograph (SIEMENS Healthineers Medical Solutions, Knoxville, TN) for the next 96 patients after a scanner replacement. Patients fasted for 4h before acquisition, and the blood glucose level had to be less than 7 mmol/L before injection of 5 MBq/kg of 18F-FDG. PET acquisitions were carried out approximately 60min after injection. The CT consisted of a 64-slice multidetector-row spiral scanner with a transverse field of view of 700 mm. Standard CT parameters were used: a collimation of 16×1.2 mm2, pitch 1, tube voltage of 120 kV, and effective tube current of 80 mA. Routine clinical image reconstruction protocols were used: for the Philips GEMINI, data were reconstructed using the RAMLA 3D (2 iterations, relaxation parameter 0.05) whereas for the Siemens Biograph, images were reconstructed with Fourier rebinning (FORE) followed by OSEM (2 iterations, 8 subsets). In both cases images were corrected for attenuation using the corresponding CT, reconstructed with a 2×2×2 mm3 voxels grid and post-filtered with a 5-mm FWHM 3D Gaussian.
MRI
All MRI studies were performed with a 1.5-T unit (Siemens Medical Solutions, Magnetom Aera, Erlangen, Germany or General Electric, Milwaukee, WS) using a phased-array body coil, 2 weeks before the start of CRT with set image protocols. MRI was performed at least 10 days after cone biopsy to avoid false-positive findings due to post-biopsy inflammation. No patient had an absolute contraindication to the MRI examination. The MRI protocol included high-resolution turbo T2-weighted sequences in the sagittal, axial, and axial oblique (perpendicular to the long axis of the cervix) planes. T1-weighted and T2-weighted axial images were obtained through the pelvis and up to the level of the renal hilum to assess nodal status. The MRI protocol included also axial TSE T2-weighted fat-suppressed and axial oblique and sagittal diffusion-T2-weighted images (DWI) (b values of 0, 400 and 1000) without slices gap. All except two allergic patients (training set) received a 0.1
4 mmol/kg injection of gadobenate dimeglumine (Multihance; Bracco Diagnostics, Milan, Italy). After 3 min a T1-weighted fat-suppressed sequence (CE-MRI) in the axial and sagittal plane was acquired. MRI sequences are described in more details in the supplemental material table 1.
Treatment
Consortium guidelines were applied to contour the clinical target volume (CTV), the planning target volume (PTV) and organs-at-risk [15]. Treatment consisting of three-dimensional conformal radiotherapy (3D-CRT) (n=59 and n=7 respectively in the training and testing sets) or intensity-modulated photon radiotherapy (IMRT) (n=10 and n=26 respectively in the training and testing sets) delivered using a linear accelerator.
All the patients received pelvic EBRT or extended field RT to the para-aortic area using high energy photons (18 MV), depending on their work-up at a dose of 45–50.4 Gy with standard fractionation. In patients with positive pelvic or para-aortic LN, an image-guided targeted boost was delivered to a dose of 50.4-54 Gy to the involved nodes (12 and 3 patients in training and testing sets, respectively). The week after EBRT, patients received 3-4 fractions of MRI-guided high-dose-rate (HDR) intracavitary brachytherapy every 4 days. The prescribed dose was 7 Gy to the high-risk CTV. No patient experienced delays or breaks in RT because of short-term toxicity (median RT duration, 49 days; range, 47-53 days). All patients received 4-6 cycles of concomitant chemotherapy with weekly cisplatin (40 mg/m2) or carboplatin (AUC 2) in case of renal contraindication.
Follow-up
PET/CT (for all patients with the Siemens Biograph) was performed 3 months after treatment completion in order to assess therapeutic response with PERCIST: patients were classified as having complete metabolic response (CMR), partial metabolic response (PMR), stable metabolic disease (SMD), or progressive metabolic disease (PMD) [16]. Clinical follow-up consisted of physical examination every third month until 2 years after diagnosis, every sixth month up to 5 years, annually thereafter, and was done alternatively by the radiation oncologist and gynaecologist. Follow-up imaging studies consisted of MRI at 3 months after treatment completion and annually until 2 years after treatment completion, CT every 6 months until 2 years after treatment completion and if clinically indicated after, and/or PET/CT if clinically indicated.
Worflow for multimodal radiomics
Our workflow is illustrated in Figure 1.
Segmentation
Only primary tumors, not pathological lymph nodes, were analyzed. The PET and the MRI images were processed independently by a single expert radiation oncologist (F. Lucia). To reduce user-dependency of this step, robust (semi)automated methods were exploited. The metabolically active volumes on PET images were automatically delineated with the fuzzy locally adaptive Bayesian (FLAB) algorithm [17, 18]. The anatomic volumes were also delineated on i) the ADC map derived from DWI-MRI, ii) CE-MRI and iii) T2. Each sequence was segmented independently because of anatomical changes between each sequence acquisition, using a previously validated semi-automatic approach exploiting 3D SlicerTM and the Growcut algorithm [19]. This approach only requires painted strokes on the apparent foreground and background as input (examples are provided in supplemental material, figure 2).
5
Features extraction
Each tumor was characterized with 92 features extracted from four sets of images: the PET component of PET/CT and the 3 MRI sequences (ADC map from DWI, CE-MRI and T2). Amongst these parameters, 19 shape-based features describe the 3D geometry of the segmented volume (e.g. volume or diameter) and 11 first-order statistics are derived from the histogram of voxel intensities (e.g. PET SUVmax or SUVmean). Sixty-two 2nd (25 features) and 3rd (37 features) order textures are based
on different matrices capturing the spatial intensity distributions at different scales and were calculated in a single matrix considering all 13 orientations simultaneously [20]. For these, three different image intensity quantization methods [21] were considered: a linear quantization of the histogram into 64 bins (QL), histogram equalization into 64 bins (QE) or using a variable number of
fixed-width bins (of 0.5 SUV for PET and 10 units for T2- and CE- MRI and 10 mm²/s for ADC map) (QF). This resulted in 186 different features. In the following these will be denoted as Feature
Matrix-Quantization. All features were implemented according to the current version of image biomarkers
standardization initiative (IBSI) guidelines [20] and a full list is provided in the supplemental material, table 2. A total of 864 image features (216per modality) 8 clinical and histopathological parameters (age, FIGO stage, N stage, BMI, histology, white blood cells, platelets, hemoglobin) and 3 treatment parameters (radiotherapy dose, brachytherapy dose and overall treatment time) were included in the statistical analysis (table 1).
Statistical analysis
Training and testing sets characteristics were compared using Macnemar test for qualitative factors and Student test for quantitative factors. Endpoints were DFS and LRC. For the training set, all parameters including usual confounding factors (e.g. volume, clinical variables, etc.) were tested using univariate Cox proportional hazards modeling, for which statistical significance was corrected for multiple testing with the Bonferroni method to reduce false-positive discovery rate [22]. Corrected p-values below α/K (K=875 and α=0.05, i.e. p<0.000057) were considered statistically significant. Cox-regression models with the stepwise method were used for multivariate analysis including only the uncorrelated parameters (r<0.5) found significant in the univariate analysis. In addition, correlations between the parameters identified in the multivariate analysis and standard metrics (e.g. volume, FIGO stage, etc.) were checked to avoid simply deriving surrogates of usual variables. The receiver operating characteristic (ROC) curve was used to determine cut-off values of significant parameters according to the Youden index to generate Kaplan-Meier curves for DFS and LRC. Distributions of survival times were compared using the log-rank test. The best features/models were applied to the testing set for a rigorous evaluation of their accuracy for DFS and LRC, avoiding overfitting on a single cohort. Adjusted hazard ratios (HRs) and the corresponding 95% confidence intervals (CI) were calculated. All statistical analyses were performed using MedCalc Statistical Software version 15.8 (MedCalc Software bvba, Ostend, Belgium; https://www.medcalc.org; 2015). Our study followed the Transparent Reporting of a multivariable prediction model for Individual Prognosis Or Diagnosis (TRIPOD) guidelines [23]. The checklist can be found in the supplemental material.
6
RESULTS
Patient and tumor characteristics
The training and testing sets had similar clinical, treatment and histopathological characteristics, except for EBRT modalities (more IMRT in the validation set, p<0.0001), which have no impact on the effectiveness of treatment however, only on its toxicity [24].
Outcome Training set
After a median follow-up of 36 months (range, 6-79 months), 17 patients (25%) had died. Progression or disease recurrence occurred in 25 patients (36%). Fourteen patients (20%) had an isolated pelvic recurrence and 11 (16%) a distant recurrence (8 with isolated distant recurrence and 3 with both regional and distant recurrence). Post-CRT PET/CT demonstrated 44 CMR, 22 PMR, no SMD, and 3 PMD. Out of 14 patients without LRC 4 had a CMR and 10 a PMR. Out of 11 patients with distant metastases 3 had a CMR, 5 a PMR, and 3 a PMD. 3-year DFS and LRC were 63%, and 78%, respectively.
Testing set
None of the 33 patients had died after a median follow-up of 17 months (range, 6–30 months). Progression/recurrence occurred in 10 patients (30%): 5 (15%) had an isolated pelvic recurrence and 5 (15%) a distant recurrence (3 isolated and 2 with both regional and distant). Post-treatment PET/CT demonstrated 19 CMR, 11 PMR, 1 SMD, and 2 PMD. Out of 5 patients without LRC 4 had a CMR and 1 a SMD. Out of 5 patients with distant metastases, 3 had a CMR and 2 a PMD. 1-year DFS and LRC were 80% and 90%, respectively
7
Radiomics signature learning (training set) DFS
In univariate analysis, most clinical parameters and notably metabolic response (CMR vs. no CMR, p=0.0001) showed association with DFS without however reaching the corrected statistical significance, with HR between 2.3 and 4.3 (table 2). One texture from PET (GLNUGLRLM-QE) and 4 from
MRI (Inverse varianceGLCM-QF and EntropyGLCM-QF in ADC maps from DWI, RLVARGLRLM-QL in CE-MRI and
LZLGEGLSZM-QF in T2) remained significant (p<0.00001), reaching HR between 5 and 34.
Only ADC EntropyGLCM-QF and CE-MRI RLVARGLRLM-QL remained significantly correlated with DFS in
multivariate analysis (p<0.0001 and p=0.0001 with hazard ratios of 31 and 11, respectively).
The estimated three-year DFS rates between patients with low versus high ADC EntropyGLCM-QF
(cut-off 12.64) were 94% and 14%, respectively, and between patients with low versus high CE-MRI RLVARGLRLM-QL (cut-off 0.17) 89% and 6%, respectively (figure 2).
LRC
One texture from PET/CT (GLNUGLRLM-QE) and 3 from MRI (Inverse varianceGLCM-QF and EntropyGLCM-QF
in ADC map and RLVARGLRLM-QL in CE-MRI) remained significantly correlated with LRC in univariate
analysis after correction (p<0.00001, HR from 13 to 33), whereas none of the clinical factors reached statistical significance despite trends (p from 0.02 to 0.0007 and HR from 2 to 6) (table 3).
In multivariate analysis only ADC EntropyGLCM-QF (p=0.0079) and PET GLNUGLRLM-QE (p=0.0043)
remained independent prognostic factors.
The estimated three-year LRC rates between patients with low versus high PET GLNUGLRLM-QE (cut-off
103.71) were 98% and 41%, and with low versus high ADC EntropyGLCM-QF (cut-off 12.64) were 98%
and 45%. The combination of these 2 features provided an even better predictive model for LRC (98%
vs. 18%) (figure 3).
Radiomics signature evaluation (testing set)
When applying the selected radiomics features with their optimal cut-off values determined in the training set to the testing set, we obtained promising performance.
ADC EntropyGLCM-QF (cut-off 12.64) reached an accuracy of 94% (sensitivity 90%, specificity 96%) to
predict recurrence with a HR of 19.6 (p<0.0001), compared to 60% at best using standard factors (Figure 4).
For LRC, PET GLNUGLRLM-QE (cut-off 103.71) alone and its combination with ADC EntropyGLCM-QF
reached accuracy of 94% (sensitivity 100%, specificity 93%) and 100% respectively (HRs undefined, p=0.0001 and p<0.0001), compared to 56% at best using standard factors (figure 5).
These features differentiate between patients with a high risk to develop distant metastasis and those with a high risk to develop an isolated locoregional relapse. A flowchart for personalized treatment management of these patients can be derived (figure 6).
8
DISCUSSION
Our results suggest that GLNUGLRLM in FDG PET and/or EntropyGLCM in ADC maps from DWI MRI are
powerful predictors of the efficacy of CRT in the treatment of CC. Higher values of these parameters were associated with worse outcome, confirming that more heterogeneous tumor have a poor prognosis. These findings can be acted upon to tailor treatment (figure 6). Following this flowchart, more aggressive loco-regional treatment could be offered to patients with high-risk of an isolated loco-regional relapse whereas for patients with high-risk of distant relapse, a systemic adjuvant treatment would be more beneficial.
To our knowledge, this is the first study evaluating the prognostic value of radiomics exploiting both PET/CT and MRI images in LACC patients. Our results concur with previous studies in CC that exploited either PET or MRI. A first study associated high pretreatment PET GLNUGLRLM with poorer
prognosis [9]. Another showed that 18F-FDG PET/CT features could predict local recurrence of LACC better than SUVmax [13]. A third study showed that DCE-MRI 2nd-order textures could predict
treatment outcome [10].
We showed PET/CT and MRI could provide complementary information when examinations are performed separately, as it is currently done in routine clinical practice. Similar investigations on hybrid imaging PET/MRI systems would be interesting because it would provide better temporal and spatial matching of the tumor volume in the different modalities, which could in addition facilitate its delineation. There is currently only a handful of radiomics studies using PET/MRI [25]. Given the small number of available PET/MRI systems, multi-centric investigations to validate radiomics models on these hybrid devices is also more challenging.
Our study has limitations. It was monocentric and retrospective, which is the case of most of radiomics studies [8], including in CC [9-13]. The number of patients was limited and we included a large number of parameters (more than 800), however we performed training and testing evaluation, and statistical significance was corrected for multiple testing in the univariate analysis, in order to avoid both false-discovery and overfitting. Before validating our radiomics signature on an external cohort (with different acquisition protocols), it was first necessary to validate it on patients from the same center. In that regard, the first 6 patients underwent PET/CT in a different scanner than the rest of the cohort. However in all cases the images were reconstructed with the same voxel size and the same post-reconstruction filter. The slice gap on T2-w and CE-MRI could impair 2nd- and 3rd-order features extraction. On ADC maps from DWI MRI however, there is no slice gap and this parameter was highlighted as one of the most efficient. In addition, all MRI pre-treatment were realized in the same center and with same acquisition and reconstruction protocols were used (supplemental material table 1) which limits the problems of reproducibility of radiomics features in MRI in particular as regards the geometric distortions. Finally, only primary tumors were characterized.
Beyond these potential sources of bias, radiomics is a promising approach but still suffers from inherent limitations which will need to be addressed before it can be used in clinical practice. Among these, the repeatability and robustness of the procedure has to be improved. Accurate segmentation is an important step of the feature extraction, as radiomics are derived from segmented volumes of interest. Manual delineation is a straightforward solution, but is very time consuming and suffers from high inter- and intra-observer variability [26]. Validated automatic or semi-automatic segmentation was used in our study to minimize manual input and increase consistency. The volumes derived from each image modality showed no significant differences (supplemental material figure 2C). In addition, the two features retained show low correlation with tumor volume and other clinical factors (supplemental material figure 1). 3D SlicerTM and the Growcut algorithm used are available for free and require minimal inputs from the user [27]. Although FLAB is not freely
9 available, other efficient PET segmentation tools are available in clinical stations, such as adaptive thresholding or gradient-based method [28], and our results should therefore be reproducible by others.
The choice of the optimal cut-off to stratify patients into a binary model can impact the results. This choice can be dependent on the training dataset and thus, hardly applicable to an external population. To confirm the predictive value of the features identified in a cohort, validation on an external cohort of patients is considered the gold standard [8, 29]. If this type of validation is not feasible, the best approach is to divide the available patients into training and testing sets, as we did. Validation of our findings is currently underway in a cohort of patients from a different clinical center.
Other factors such as image acquisition parameters [30], tumor volume [31], grey-level discretization and other pre-processing steps [8, 29] can influence radiomics findings. Acquisition parameters for both PET and MRI images were the same for all patients. One of the most important confounding factors in radiomics studies is the volume (i.e. the number of voxels). For PET radiomics specifically, textural features are unlikely to provide complementary information with respect to volume for the smallest lesions, due to the combination of the limited spatial resolution of PET imaging with the large voxel size sampling, leading to a small number of voxels to perform texture analysis. Although it has been suggested that a lower limit could be as high as 45 cm3 based on entropyGLCM [ref Brooks],
later studies have shown that this lower limit actually varies depending on the feature and the methodological choices for its calculation, such as the grey-levels discretization method or the texture matrices design, suggesting a lower limit around 5 to 10 cm3 instead, although this may not
be applicable to all cases. Therefore it is rather recommended to include volume in the multivariate analysis, to report correlations and investigate the potential bias of the inclusion of the smallest volumes in the analysis [ref 29, 31]. In our study, the range of considered volumes was 5-97 cm3 with rather large mean and median values of 33 and 27 cm3 respectively, which corresponds to 625 voxels for the smallest volume but a mean and median number of 4171 and 3381 voxels respectively. In addition, GLNUGLRLM-QE showed limited correlation with PET volume and had similar value in both
training and testing sets for tumors below or above thresholds of 45 or 20 cm3 (supplemental table 3 and supplemental figures 3 and 4). Although tumor volume or intensity-based measurements from both PET and MRI sequences were correlated with the endpoints they had insufficient predictive power compared to higher order radiomics features to be retained in the univariate analysis. In addition, the levels of correlation the retained features exhibit with volume or other confounding factors demonstrate they are not merely surrogates of usual variables (see supplemental material). This shows that the radiomics features we identified provide complementary information with respect to volume in both PET and MRI and that there is no bias in our results coming from the inclusion of the smallest lesions.
In most studies, the number of features is often far greater than the number of patients included, potentially leading to a high risk of false positive-rate, as recently highlighted [8, 22, 29]. There is no consensus about the unsupervised approach to obtain the best results. A recent study investigated a large panel of machine-learning approaches for radiomics-based survival prediction, considering both features selection and classification methods [32]. Their variability analysis pointed out that the choice of the classification method has the highest impact on performance variation in predicting the OS (more than 30% of the total variation), with respect to the choice of features selection method (only 6% of variation). In our study we could obtain near-perfect accuracy by using only the one or two parameters that remained significant after correction for multiple testing, and the use of advanced machine learning was thus deemed not necessary.
We identified features with high predictive power regarding tissue response to radiation, however the biological interpretation of these features remains an area of active investigations [33, 34]. As
10 first elements of interpretation, PET GLNUGLRLM-QE and ADC EntropyGLCM-QF are both computed on
functional imaging. EntropyGLCM-QF calculated on the ADC map derived from DWI MRI could be linked
to a cellularity heterogeneity and expression of growth factor. PET GLNUGLRLM-QE might be associated
to a necrosis heterogeneity and expression of vascular growth factor. More comprehensive assessment of the molecular features of patients based on tumor specimen characterization and noninvasive molecular imaging approaches are required to further investigate these hypotheses [33, 34].
CONCLUSIONS
Radiomics features such as GLNUGLRLM on 18F-FDG PET and EntropyGLCM on ADC maps derived from
DW-MRI were independent prognostic factors for disease outcome in LACC patients undergoing CRT, with significantly higher value than conventional factors. The identification of high-risk patients at diagnosis can allow tailored treatments involving higher doses of radiation boost, consolidation chemotherapy, and/or adjuvant hysterectomy, when indicated, and should be confirmed in external cohorts and prospective studies. The biological interpretation of radiomics remains an open question warranting further investigation.
11
Compliance with Ethical Standards:
Conflict of Interest: Author François Lucia declares that he has no conflict of interest. Author Dimitris Visvikis declares that he has no conflict of interest. Author Marie-Charlotte Desseroit declares that she has no conflict of interest. Author Omar Miranda declares that he has no conflict of interest. Author Jean-Pierre Malhaire declares that he has no conflict of interest. Author Philippe Robin declares that he has no conflict of interest. Author Olivier Pradier declares that he has no conflict of interest. Author Mathieu Hatt declares that he has no conflict of interest. Author Ulrike Schick declares that she has no conflict of interest.
Ethical approval: All procedures performed in studies involving human participants were in accordance with the ethical standards of the institutional and/or national research committee and with the 1964 Helsinki declaration and its later amendments or comparable ethical standards.
Informed consent: Informed consent was obtained from all individual participants included in the study.
12
REFERENCES
1. Ferlay J, Soerjomataram I, Dikshit R, Eser S, Mathers C, Rebelo M, Parkin DM, Forman D, Bray F: Cancer incidence and mortality worldwide: sources, methods and major patterns in
GLOBOCAN 2012. International journal of cancer 2015, 136(5):E359-386.
2. Rose PG, Java J, Whitney CW, Stehman FB, Lanciano R, Thomas GM, DiSilvestro PA:
Nomograms Predicting Progression-Free Survival, Overall Survival, and Pelvic Recurrence in Locally Advanced Cervical Cancer Developed From an Analysis of Identifiable Prognostic Factors in Patients From NRG Oncology/Gynecologic Oncology Group Randomized Trials of Chemoradiotherapy. Journal of clinical oncology : official journal of the American Society of Clinical Oncology 2015, 33(19):2136-2142.
3. Moore KN, Java JJ, Slaughter KN, Rose PG, Lanciano R, DiSilvestro PA, Thigpen JT, Lee YC, Tewari KS, Chino J et al: Is age a prognostic biomarker for survival among women with
locally advanced cervical cancer treated with chemoradiation? An NRG
Oncology/Gynecologic Oncology Group ancillary data analysis. Gynecologic oncology 2016, 143(2):294-301.
4. Herrera FG, Prior JO: The role of PET/CT in cervical cancer. Frontiers in oncology 2013, 3:34. 5. Choi J, Kim HJ, Jeong YH, Lee JH, Cho A, Yun M, Lee JD, Kim YB, Kim YT, Kang WJ: The Role of
(18) F-FDG PET/CT in Assessing Therapy Response in Cervix Cancer after Concurrent Chemoradiation Therapy. Nuclear medicine and molecular imaging 2014, 48(2):130-136.
6. Lambin P, Rios-Velazquez E, Leijenaar R, Carvalho S, van Stiphout RG, Granton P, Zegers CM, Gillies R, Boellard R, Dekker A et al: Radiomics: extracting more information from medical
images using advanced feature analysis. European journal of cancer 2012, 48(4):441-446.
7. Rios Velazquez E, Parmar C, Liu Y, Coroller TP, Cruz G, Stringfield O, Ye Z, Makrigiorgos M, Fennessy F, Mak RH et al: Somatic Mutations Drive Distinct Imaging Phenotypes in Lung
Cancer. Cancer research 2017, 77(14):3922-3930.
8. Yip SS, Aerts HJ: Applications and limitations of radiomics. Physics in medicine and biology 2016, 61(13):R150-166.
9. Ho KC, Fang YH, Chung HW, Yen TC, Ho TY, Chou HH, Hong JH, Huang YT, Wang CC, Lai CH: A
preliminary investigation into textural features of intratumoral metabolic heterogeneity in (18)F-FDG PET for overall survival prognosis in patients with bulky cervical cancer treated with definitive concurrent chemoradiotherapy. American journal of nuclear medicine and molecular imaging 2016, 6(3):166-175.
10. Torheim T, Groendahl AR, Andersen EK, Lyng H, Malinen E, Kvaal K, Futsaether CM: Cluster
analysis of dynamic contrast enhanced MRI reveals tumor subregions related to
locoregional relapse for cervical cancer patients. Acta oncologica 2016, 55(11):1294-1298.
11. Chung HH, Kang SY, Ha S, Kim JW, Park NH, Song YS, Cheon GJ: Prognostic value of
preoperative intratumoral FDG uptake heterogeneity in early stage uterine cervical cancer. J Gynecol Oncol 2016, 27(2):e15.
12. Guan Y, Li W, Jiang Z, Chen Y, Liu S, He J, Zhou Z, Ge Y: Whole-Lesion Apparent Diffusion
Coefficient-Based Entropy-Related Parameters for Characterizing Cervical Cancers: Initial Findings. Acad Radiol 2016, 23(12):1559-1567.
13. Reuze S, Orlhac F, Chargari C, Nioche C, Limkin E, Riet F, Escande A, Haie-Meder C, Dercle L, Gouy S et al: Prediction of cervical cancer recurrence using textural features extracted from
18F-FDG PET images acquired with different scanners. Oncotarget 2017, 8(26):43169-43179.
14. https://www.nccn.org/professionals/physician_gls/pdf/cervical.pdf.
15. Lim K, Small W, Jr., Portelance L, Creutzberg C, Jurgenliemk-Schulz IM, Mundt A, Mell LK, Mayr N, Viswanathan A, Jhingran A et al: Consensus guidelines for delineation of clinical
13
cervix cancer. International journal of radiation oncology, biology, physics 2011,
79(2):348-355.
16. Wahl RL, Jacene H, Kasamon Y, Lodge MA: From RECIST to PERCIST: Evolving Considerations
for PET response criteria in solid tumors. Journal of nuclear medicine : official publication, Society of Nuclear Medicine 2009, 50 Suppl 1:122S-150S.
17. Hatt M, Cheze le Rest C, Turzo A, Roux C, Visvikis D: A fuzzy locally adaptive Bayesian
segmentation approach for volume determination in PET. IEEE transactions on medical imaging 2009, 28(6):881-893.
18. Hatt M, Cheze le Rest C, Descourt P, Dekker A, De Ruysscher D, Oellers M, Lambin P, Pradier O, Visvikis D: Accurate automatic delineation of heterogeneous functional volumes in
positron emission tomography for oncology applications. International journal of radiation oncology, biology, physics 2010, 77(1):301-308.
19. Velazquez ER, Parmar C, Jermoumi M, Mak RH, van Baardwijk A, Fennessy FM, Lewis JH, De Ruysscher D, Kikinis R, Lambin P et al: Volumetric CT-based segmentation of NSCLC using
3D-Slicer. Scientific reports 2013, 3:3529.
20. Alex Zwanenburg SL, Martin Vallières, Steffen Löck: Image biomarker standardisation
initiative - feature definitions. 2017.
21. Desseroit MC, et al: Comparison of three quantization methods for the calculation of
textural features in PET/CT images: impact on prognostic models in Non-Small Cell Lung Cancer. IEEE Nuclear Science Symposium and Medical Imaging Conference 2016 2016.
22. Chalkidou A, O'Doherty MJ, Marsden PK: False Discovery Rates in PET and CT Studies with
Texture Features: A Systematic Review. PloS one 2015, 10(5):e0124165.
23. Collins GS, Reitsma JB, Altman DG, Moons KG: Transparent reporting of a multivariable
prediction model for individual prognosis or diagnosis (TRIPOD): the TRIPOD Statement. European journal of clinical investigation 2015, 45(2):204-214.
24. Naik A, Gurjar OP, Gupta KL, Singh K, Nag P, Bhandari V: Comparison of dosimetric
parameters and acute toxicity of intensity-modulated and three-dimensional radiotherapy in patients with cervix carcinoma: A randomized prospective study. Cancer radiotherapie : journal de la Societe francaise de radiotherapie oncologique 2016, 20(5):370-376.
25. Antunes J, Viswanath S, Rusu M, Valls L, Hoimes C, Avril N, Madabhushi A: Radiomics
Analysis on FLT-PET/MRI for Characterization of Early Treatment Response in Renal Cell Carcinoma: A Proof-of-Concept Study. Translational oncology 2016, 9(2):155-162.
26. Eminowicz G, McCormack M: Variability of clinical target volume delineation for definitive
radiotherapy in cervix cancer. Radiotherapy and oncology : journal of the European Society for Therapeutic Radiology and Oncology 2015, 117(3):542-547.
27. Egger J, Kapur T, Fedorov A, Pieper S, Miller JV, Veeraraghavan H, Freisleben B, Golby AJ, Nimsky C, Kikinis R: GBM volumetry using the 3D Slicer medical image computing platform.
Scientific reports 2013, 3:1364.
28. Hatt M, Lee JA, Schmidtlein CR, Naqa IE, Caldwell C, De Bernardi E, Lu W, Das S, Geets X, Gregoire V et al: Classification and evaluation strategies of auto-segmentation approaches
for PET: Report of AAPM task group No. 211. Medical physics 2017, 44(6):e1-e42.
29. Hatt M, Tixier F, Pierce L, Kinahan PE, Le Rest CC, Visvikis D: Characterization of PET/CT
images using texture analysis: the past, the present... any future? European journal of nuclear medicine and molecular imaging 2017, 44(1):151-165.
30. Galavis PE, Hollensen C, Jallow N, Paliwal B, Jeraj R: Variability of textural features in FDG
PET images due to different acquisition modes and reconstruction parameters. Acta oncologica 2010, 49(7):1012-1016.
31. Hatt M, Majdoub M, Vallieres M, Tixier F, Le Rest CC, Groheux D, Hindie E, Martineau A, Pradier O, Hustinx R et al: 18F-FDG PET uptake characterization through texture analysis:
investigating the complementary nature of heterogeneity and functional tumor volume in a multi-cancer site patient cohort. Journal of nuclear medicine : official publication, Society of Nuclear Medicine 2015, 56(1):38-44.
14 32. Parmar C, Grossmann P, Bussink J, Lambin P, Aerts HJ: Machine Learning methods for
Quantitative Radiomic Biomarkers. Scientific reports 2015, 5:13087.
33. Incoronato M, Aiello M, Infante T, Cavaliere C, Grimaldi AM, Mirabelli P, Monti S, Salvatore M: Radiogenomic Analysis of Oncological Data: A Technical Survey. International journal of
molecular sciences 2017, 18(4).
34. Cancer Genome Atlas Research N, Albert Einstein College of M, Analytical Biological S, Barretos Cancer H, Baylor College of M, Beckman Research Institute of City of H, Buck Institute for Research on A, Canada's Michael Smith Genome Sciences C, Harvard Medical S, Helen FGCC et al: Integrated genomic and molecular characterization of cervical cancer.
15
Table 1: Patients’ characteristics
Training set Testing set Difference
(p-value)
n=69 % n=33 %
Age median (range) 58 (29-90) 57 (37-86) 0.96
FIGO stage 0.85 IB1 2 3 1 3 IB2 8 12 4 12 IIA 4 6 3 9 IIB 36 52 15 46 IIIA 1 1 1 3 IIIB 9 13 5 15 IVA 9 13 4 12 Histology 0.83 Squamous 54 79 26 79 Adenocarcinoma 9 13 5 15 Adenosquamous carcinoma 1 1 0 0
Clear cell carcinoma 5 7 2 6
Lymph node involvment
0.21
Uninvoled 30 44 20 61
Involved 39 56 13 39
pelvic 27 69 8 62
pelvic and para-aortic 12 31 5 38
CBC median (range)
white blood cells 8.3 · 103/mL (4.6-25.6) 7.6 · 103/mL (5.1-20.6) 0.32
hemoglobin 128 g/dL (71-149) 126 g/dL (80-151) 0.91
platelets 261.5 · 103/mL (186-819)
227.3 · 103/mL
(171-603) 0.27
body-mass index median (range) 23.2 (14-42) 22.6 (16-35) 0.61
Treatment
3D-CRT 59 86 7 21
<0.0001
IMRT 10 14 26 79
EBRT dose median (range) 45 (45-54) 45 (45-54) 0.52
BT dose median (range) 24 (21-26) 24 (21-28) 0.63
Overall treatment time (range) 49 (47-52) 49 (48-53) 0.47
Abbreviations: FIGO= International Federation of Gynecology and Obstetrics, CBC= complete blood counts, 3D-CRT= three-dimensional conformal radiotherapy, IMRT= intensity-modulated photon radiotherapy, EBRT= external beam radiotherapy, BT=brachytherapy
16
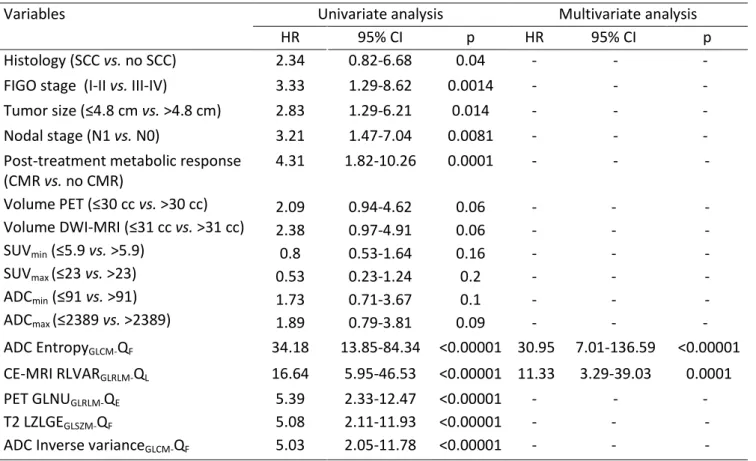
Table 2: Univariate and multivariate analysis for disease-free survival
Variables Univariate analysis Multivariate analysis
HR 95% CI p HR 95% CI p
Histology (SCC vs. no SCC) 2.34 0.82-6.68 0.04 - - -
FIGO stage (I-II vs. III-IV) 3.33 1.29-8.62 0.0014 - - -
Tumor size (≤4.8 cm vs. >4.8 cm) 2.83 1.29-6.21 0.014 - - -
Nodal stage (N1 vs. N0) 3.21 1.47-7.04 0.0081 - - -
Post-treatment metabolic response (CMR vs. no CMR) Volume PET (≤30 cc vs. >30 cc) Volume DWI-MRI (≤31 cc vs. >31 cc) SUVmin (≤5.9 vs. >5.9) SUVmax (≤23 vs. >23) ADCmin (≤91 vs. >91) ADCmax (≤2389 vs. >2389) 4.31 2.09 2.38 0.8 0.53 1.73 1.89 1.82-10.26 0.94-4.62 0.97-4.91 0.53-1.64 0.23-1.24 0.71-3.67 0.79-3.81 0.0001 0.06 0.06 0.16 0.2 0.1 0.09 - - - - - - - - - - - - - - - - - - - - - ADC EntropyGLCM-QF 34.18 13.85-84.34 <0.00001 30.95 7.01-136.59 <0.00001 CE-MRI RLVARGLRLM-QL 16.64 5.95-46.53 <0.00001 11.33 3.29-39.03 0.0001 PET GLNUGLRLM-QE T2 LZLGEGLSZM-QF
ADC Inverse varianceGLCM-QF
5.39 5.08 5.03 2.33-12.47 2.11-11.93 2.05-11.78 <0.00001 <0.00001 <0.00001 - - - - - - - - -
17
Table 3: Univariate and multivariate analysis for loco-regional control
Variables Univariate analysis Multivariate analysis
HR 95% CI p HR 95% CI p
Histology (SCC vs. non SCC) 2.48 0.64-9.61 0.09 - - -
FIGO stage (I-II vs. III-IV) 3.27 0.95-11.28 0.019 - - -
Tumor size (≤4.8 cm vs. >4.8 cm) 4.73 1.57-14.21 0.0037 - - -
Nodal stage (N1 vs. N0) 3.35 1.17-9.55 0.048 - - -
Post-treatment metabolic response (CMR vs. no CMR) Volume PET (≤30 cc vs. >30 cc) Volume DWI-MRI (≤31 cc vs. >31 cc) SUVmin (≤5.9 vs. >5.9) SUVmax (≤23 vs. >23) ADCmin (≤91 vs. >91) ADCmax (≤2389 vs. >2389) 5.87 2.49 2.59 1.21 1.04 2.26 2.38 1.87-18.45 0.66-9.63 0.73-9.81 0.49-7.13 0.37-6.85 0.51-9.46 0.57-9.55 0.0007 0.08 0.06 0.22 0.29 0.11 0.1 - - - - - - - - - - - - - - - - - - - - - ADC EntropyGLCM-QF 28.10 9.11-86.66 <0.00001 16.35 2.10-126.94 0.0079 CE-MRI RLVARGLRLM-QL 13.22 3.71-47.11 <0.00001 - - - PET GLNUGLRLM-QE
ADC Inverse varianceGLCM-QF
33.11 11.53 10.34-106.06 3.50-44.84 <0.00001 <0.00001 20.01 - 2.59-154.89 - 0.0043 -
Abbreviations:
FIGO=International Federation of Gynecology and Obstetrics, SCC= Squamous cell carcinoma, CMR=Complete metabolic response, GLCM=Grey-level Co-occurrence Matrix, GLRLM= Grey-level Run-Length matrix, GLSZM= Grey-level Size Zone matrix, RLVAR=Run Length Variance, GLNU=Grey-level non-uniformity, LZLGE= Large Zone Low Grey-Level Emphasis, vs= versus, HR=Hazard ratio, CI=Confidence Interval, MRI= magnetic resonance imaging, CE-MRI=contrast enhancement magnetic resonance imaging, PET= positron emission tomography , ADC=Apparent Diffusion Coefficient18
Figure 1: Worflow
19
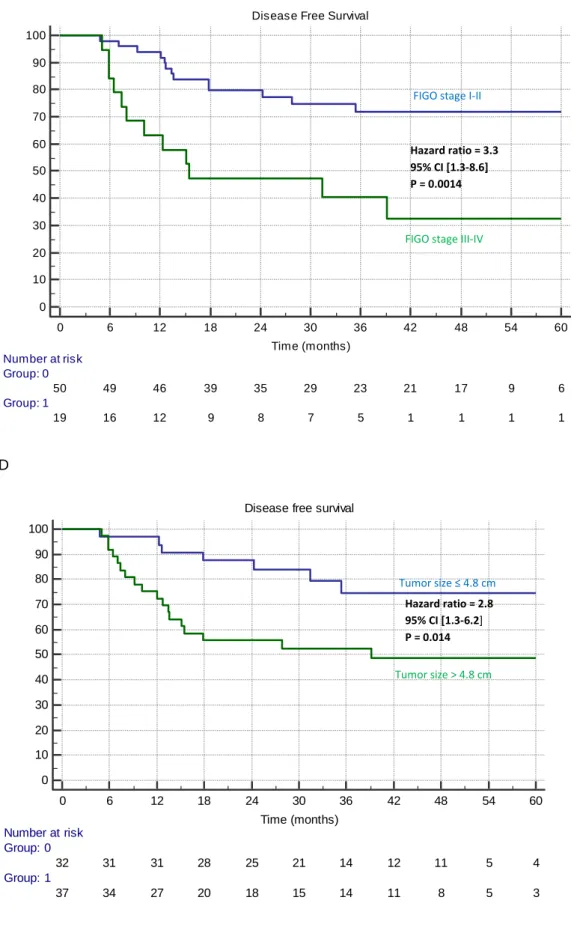
Figure 2: Kaplan-Meier estimates of disease-free survival (training set) according to (A) ADC EntropyGLCM, (B) CE-MRI RLVARGLRLM , (C) FIGO stage, (D) tumor size, (E) N stage and (F) metabolic
response from PET/CT (assessed 2 to 3 months after treatment completion). (G) Comparison of ROC curves for ADC EntropyGLCM in comparison with clinico-pathological features.
A B 0 10 20 30 40 50 60 70 80 90 100
Disease free survival
0 6 12 18 24 30 36 42 48 54 60 Time (Months) D ise a se f re e su rvi va l p ro b a b il it y (% ) Number at risk Group: low 43 43 42 41 36 32 24 21 17 10 7 Group: high 26 22 16 7 7 4 3 1 0 0 0 0 10 20 30 40 50 60 70 80 90 100
Disease free survival
0 6 12 18 24 30 36 42 48 54 60 Time (Months) d ise a se f re e su rvi va l p ro b a b il it y (% ) Number at risk Group: low 47 47 46 41 36 32 26 22 17 10 7 Group: high 20 16 10 6 6 3 1 0 0 0 0
Low ADC EntropyGLCM
Low CE-MRI RLVARGLRLM
High ADC EntropyGLCM
Hazard ratio = 34.2 95% CI [13.9-84.3] P < 0.0001 High RLVARGLRLM Hazard ratio = 16.6 95% CI [6.0-46.5] P < 0.0001
20 C D 0 10 20 30 40 50 60 70 80 90 100
Disease Free Survival
0 6 12 18 24 30 36 42 48 54 60 Time (months) Su rvi va l p ro b a b il it y (% ) Number at risk Group: 0 50 49 46 39 35 29 23 21 17 9 6 Group: 1 19 16 12 9 8 7 5 1 1 1 1 0 10 20 30 40 50 60 70 80 90 100
Disease free survival
0 6 12 18 24 30 36 42 48 54 60 Time (months) S u rv iv a l p ro b a b ili ty ( % ) Number at risk Group: 0 32 31 31 28 25 21 14 12 11 5 4 Group: 1 37 34 27 20 18 15 14 11 8 5 3
FIGO stage I-II
FIGO stage III-IV Hazard ratio = 3.3 95% CI [1.3-8.6] P = 0.0014 Tumor size ≤ 4.8 cm Tumor size > 4.8 cm Hazard ratio = 2.8 95% CI [1.3-6.2] P = 0.014
21 E F 0 10 20 30 40 50 60 70 80 90 100
Disease Free Survival
0 6 12 18 24 30 36 42 48 54 60 Time (months) S u rv iv a l p ro b a b ili ty ( % ) Number at risk Group: 0 30 30 28 26 24 21 16 15 11 5 2 Group: 1 39 35 30 22 19 15 12 7 7 5 5 0 10 20 30 40 50 60 70 80 90 100
Disease free survival
0 6 12 18 24 30 36 42 48 54 60 Time (months) S u rv iv a l p ro b a b ili ty ( % ) Number at risk Group: oui 44 43 41 37 33 27 22 20 17 10 7 Group: non 25 22 17 11 10 9 6 3 2 0 0 N stage N0 N stage N1 Hazard ratio=3.2 95% CI [1.5-7.0] P=0.0081 CMR No CMR Hazard ratio = 4.3 95% CI [1.8-10.3] P = 0.0001
22 G 0 20 40 60 80 100 0 20 40 60 80 100 100-Specificity S e n si ti vi ty ADC EntropyGLCM tumor size Volume FIGO Nodal stage histology AUC=0.95 AUC=0.65 AUC=0.64 AUC=0.67 AUC=0.65 AUC=0.59
23
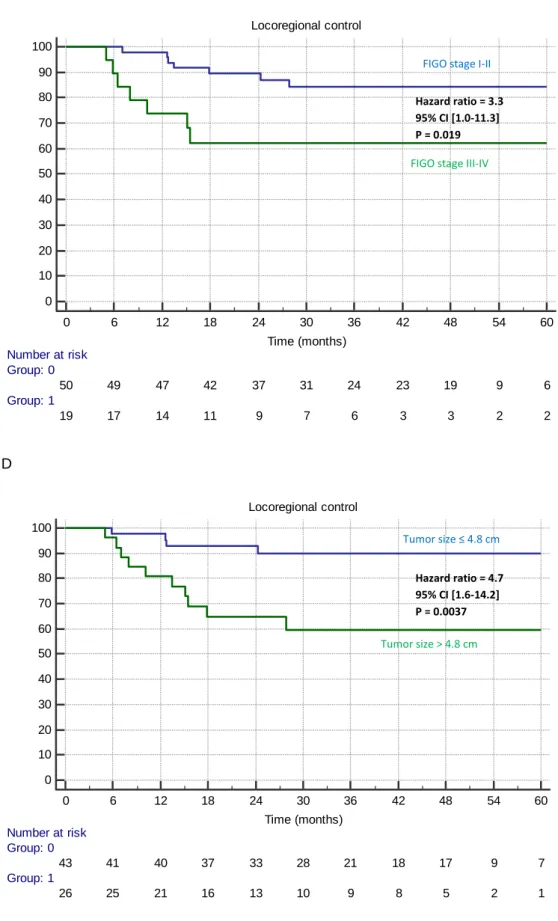
Figure 3: Kaplan-Meier estimates of locoregional control (training set) according to (A) PET
GLNUGLRLM, (B) the combination of ADC EntropyGLCM and PET GLNUGLRLM, (C) FIGO stage, (D) tumor
size, (E) N stage and (F) metabolic response from PET/CT (assessed 2 to 3 months after treatment completion). (G) Comparison of ROC curves for PET GLNUGLRLM in comparison with
clinico-pathological features. A B 0 10 20 30 40 50 60 70 80 90 100 Locoregional control 0 6 12 18 24 30 36 42 48 54 60 Time (months) L o c o re g io n a l C o n tr o l p ro b a b ili ty ( % ) Number at risk Group: low 45 44 44 41 36 29 23 20 16 9 7 Group: high 24 22 17 12 10 7 6 5 4 2 1 0 10 20 30 40 50 60 70 80 90 100 Locoregional control 0 6 12 18 24 30 36 42 48 54 60 Time (Months) L o co re g io n a l co n tr o l p ro b a b il it y (% ) Number at risk Group: low 54 53 52 49 43 35 28 24 19 11 8 Group: high 15 13 9 4 3 1 1 1 1 0 0
Low or high ADC EntropyGLCM and
low PET GLNUGLRLM
Hazard ratio = 76.9 95% CI [10.3-106.1] P < 0.0001 Low PET GLNUGLRLM
High ADC EntropyGLCM and
PET GLNUGLRLM
High PET GLNUGLRLM
Hazard ratio = 33.1 95% CI [10.3-106.1] P < 0.0001
24 C D 0 10 20 30 40 50 60 70 80 90 100 Locoregional control 0 6 12 18 24 30 36 42 48 54 60 Time (months) S u rv iv a l p ro b a b ili ty ( % ) Number at risk Group: 0 50 49 47 42 37 31 24 23 19 9 6 Group: 1 19 17 14 11 9 7 6 3 3 2 2 0 10 20 30 40 50 60 70 80 90 100 Locoregional control 0 6 12 18 24 30 36 42 48 54 60 Time (months) S u rv iv a l p ro b a b ili ty ( % ) Number at risk Group: 0 43 41 40 37 33 28 21 18 17 9 7 Group: 1 26 25 21 16 13 10 9 8 5 2 1
FIGO stage I-II
FIGO stage III-IV Hazard ratio = 3.3 95% CI [1.0-11.3] P = 0.019 Tumor size ≤ 4.8 cm Tumor size > 4.8 cm Hazard ratio = 4.7 95% CI [1.6-14.2] P = 0.0037
25 E F 0 10 20 30 40 50 60 70 80 90 100 Locoregional control 0 6 12 18 24 30 36 42 48 54 60 Time (months) S u rv iv a l p ro b a b ili ty ( % ) Number at risk Group: 0 30 30 28 27 25 22 18 17 14 6 3 Group: 1 39 36 33 26 21 16 12 9 8 5 5 0 10 20 30 40 50 60 70 80 90 100 Locoregional control 0 6 12 18 24 30 36 42 48 54 60 Time (months) S u rv iv a l p ro b a b ili ty ( % ) Number at risk Group: 1 44 44 43 40 34 28 23 21 18 11 8 Group: 2 25 22 18 13 12 10 7 5 4 0 0 N stage N0 N stage N1 Hazard ratio = 3.4 95% CI [1.2-9.6] P = 0.048 CMR No CMR Hazard ratio = 5.9 95% CI [1.9-18.5] P = 0.0007
26 G 0 20 40 60 80 100 0 20 40 60 80 100 100-Specificity S e n si ti vi ty PET GLNUGLRLM tumor size Volume FIGO Nodal stage histology AUC=0.95 AUC=0.75 AUC=0.69 AUC=0.66 AUC=0.64 AUC=0.59
27
Figure 4: Prediction of disease-free survival in the testing set according to ADC EntropyGLCM with (A)
ROC curve and (B) resulting Kaplan-Meier curve. A B 0 20 40 60 80 100 DWI EntropyGLCM 0 20 40 60 80 100 100-Specificity S e n s it iv it y 0 10 20 30 40 50 60 70 80 90 100
Disease Free Survival
0 6 12 18 24 30 36 Time (Months) d ise a se f re e su rvi va l p ro b a b il it y (% ) Number at risk Group: low 23 21 13 8 2 0 Group: high 10 7 4 1 1 0
Low ADC EntropyGLCM
High ADC EntropyGLCM
Hazard ratio = 19.6 95% CI [5.1-73.3] P < 0.0001
ADC EntropyGLCM
28
Figure 5: Prediction of locoregional control in the testing set according to (A-B) PET GLNUGLRLM
alone or to (C-D) its combination with ADC EntropyGLCM with (A, C) ROC curves and (C, D) the
resulting Kaplan-Meier curves.
A B C 0 20 40 60 80 100 high GLNU 0 20 40 60 80 100 100-specificity S e n s it iv it y 0 10 20 30 40 50 60 70 80 90 100 Locoregional control 0 6 12 18 24 30 36 Time (Months) L o co re g io n a l co n tro l p ro b a b il it y (% ) Number at risk Group: low 26 23 16 11 3 1 0 Group: high 7 6 3 1 0 0 0
Low PET GLNUGLRLM
High PET GLNUGLRLM
Hazard ratio = undefined P = 0.0001
PET GLNUGLRLM
29 D 0 20 40 60 80 100
DWI EntropyGLCM and PET GLNUGLRLM
0 20 40 60 80 100 100-Specif icity Se ns it iv it y 0 10 20 30 40 50 60 70 80 90 100 Locoregional control 0 6 12 18 24 30 36 Time (Months) Lo c or eg io na l c on tro l pr ob ab ilit y (% ) Number at risk Group: low 28 25 17 11 3 1 0 Group: high 5 4 2 1 0 0 0
Low PET GLNUGLRLM and low or high ADC EntropyGLCM
Hazard ratio = undefined P < 0.0001
High PET GLNUGLRLM and high ADC
EntropyGLCM
PET GLNUGLRLM and ADC EntropyGLCM
30
Figure 6: Flow diagram of risk-stratification strategy based on pretreatment FDG PET and DWI MRI
illustrated in (A) the training set and (B) the testing set. The first step separates patients into two groups: low (first group) and high risk of relapse thanks to ADC EntropyGLCM from DWI MRI. The
second step further discriminates within the high-risk group between metastatic (second group) or pelvic (third group) relapse. The first group would not require additional treatment. The second group could benefit from a complementary systemic treatment, and the third group could be treated with an additional locoregional treatment (like surgery or additional boost in brachytherapy).
A
Pretreatment PET and MRI N=69
Low ADC EntropyGLCM
N=43 (41 without recurrence and 2 with recurrence)
Low PET GLNUGLRLM
N=11 (8 with distant metastasis and 3 without recurrence)
High PET GLNUGLRLM
N=15 (13 with isolated locoregional relapse and 2 with
distant metastasis)
Low risk of relapse High risk of distant recurrence High risk of isolated locoregional relapse
No adjuvant treatment Systemic adjuvant treatment A locoregional adjuvant treatment High ADC EntropyGLCM
31
B
Pretreatment FDG PET and DWI MRI N=33
Low ADC EntropyGLCM
N=23 (22 without recurrence and 1 with distant metastasis)
Low PET GLNUGLRLM
N=5 (4 with distant metastasis and 1 without recurrence)
High PET GLNUGLRLM
N=5 (5 with isolated locoregional relapse)
Low risk of relapse High risk of distant recurrence High risk of isolated locoregional relapse
No adjuvant treatment Systemic adjuvant treatment A locoregional adjuvant treatment High ADC EntropyGLCM