HAL Id: hal-02341393
https://hal-amu.archives-ouvertes.fr/hal-02341393
Submitted on 31 Oct 2019HAL is a multi-disciplinary open access archive for the deposit and dissemination of sci-entific research documents, whether they are pub-lished or not. The documents may come from teaching and research institutions in France or abroad, or from public or private research centers.
L’archive ouverte pluridisciplinaire HAL, est destinée au dépôt et à la diffusion de documents scientifiques de niveau recherche, publiés ou non, émanant des établissements d’enseignement et de recherche français ou étrangers, des laboratoires publics ou privés.
Cell width dictates Type VI secretion tail length
Yoann Santin, Thierry Doan, Laure Journet, Eric Cascales
To cite this version:
Yoann Santin, Thierry Doan, Laure Journet, Eric Cascales. Cell width dictates Type VI secretion tail length. Current Biology - CB, Elsevier, 2019, �10.1016/j.cub.2019.08.058�. �hal-02341393�
Cell width dictates Type VI secretion tail length
1Yoann G. Santin1, Thierry Doan1, Laure Journet1 & Eric Cascales1,2,* 2
3
1Laboratoire d'Ingénierie des Systèmes Macromoléculaires, Institut de Microbiologie de la
4
Méditerranée, Aix-Marseille Université – CNRS UMR7255, 31 Chemin Joseph Aiguier, CS7071,
5
13402 Marseille Cedex 09, France
6 2Lead Contact 7 *Correspondence: [email protected] 8 9
Running title: T6SS sheath length control 10
11 12 13
Keywords : Protein transport, protein secretion, contractile injection systems, tail sheath, 14
length regulation, TagA, cell width, molecular ruler, membrane. 15
SUMMARY
16
The type VI secretion system (T6SS) is a multiprotein apparatus that injects protein
17
effectors into target cells, hence playing a critical role in pathogenesis and in microbial
18
communities [1–4]. The T6SS belongs to the broad family of contractile injection
19
systems (CIS), such as Myoviridae bacteriophages and R-pyocins, that use a spring-like
20
tail to propel a needle loaded with effectors [5,6]. The T6SS tail comprises an assembly
21
baseplate on which polymerizes a needle, made of stacked Hcp hexamers, tipped by the
22
VgrG-PAAR spike complex and wrapped by the contractile sheath made of TssB and
23
TssC [7–13]. The T6SS tail is anchored to the cell envelope by a membrane complex that
24
also serves as channel for the passage of the needle upon sheath contraction [14–16]. In
25
most CIS, the length of the tail sheath is invariable, and is usually ensured by a
26
dedicated protein called tape measure protein (TMP) [17–22]. Here we show that the
27
length of the T6SS tail is constant in enteroaggregative Escherichia coli cells, suggesting
28
that it is strictly controlled. By overproducing T6SS tail subunits we demonstrate that
29
component stoichiometry does not participate to the regulation of tail length. The
30
observation of longer T6SS tails when the apparatus is relocalized at the cell pole
31
further shows that tail length is not controlled by a TMP. Finally, we show that tail stops
32
its elongation when in contact with the opposite membrane, and thus that T6SS tail
33
length is determined by the cell width.
34 35
RESULTS AND DISCUSSION
36
T6SS tail sheath length in EAEC.
37
The length of bacteriophage and other CIS tails such as that of anti-feeding prophages is 38
strictly controlled [17-23]. To determine whether this is also the case for the T6SS, we 39
measured the length of T6SS sheaths in EAEC wild-type cells producing a functional fusion 40
between the TssB tail subunit and the superfolder-Green Fluorescent Protein (TssB-sfGFP). 41
The sfGFP-coding sequence was inserted on the chromosome, upstream the tssB stop codon. 42
In this construct, the sfGFP sequence is in frame with the tssB gene, and the tssB-sfGFP 43
fusion is under the control of the native tssB expression signals. Cells were grown in sci1 44
inducing medium (SIM), a defined synthetic medium that avoids batch-to-batch composition 45
variability and induces the expression of EAEC T6SS genes [24]. In agreement with the 46
localization of T6SS MC along the cell body with an underrepresentation at the poles [15,25], 47
we observed that T6SS sheaths assemble from one position on the cell body to the opposite 48
membrane. To avoid measurements of the length of contracted sheaths or of sheaths under 49
extension, time-lapse recordings were performed and only sheaths for which the elongation 50
has been completed (i.e., when the sheath holds >1 min with the same length) were 51
considered (Figure 1A). The distal extremity of these extended sheaths always co-localized 52
with the TagA stopper protein (Figure 1B). Quantitative measurements of these T6SS tail 53
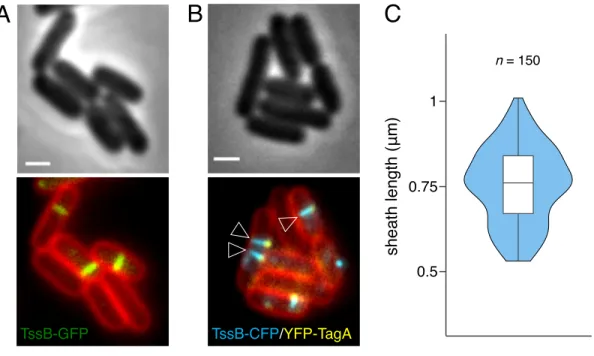
length showed low disparities, with a length mean of 0.76 ± 0.11 µm (n = 150) and a normal 54
distribution (Figure 1C). We thus concluded that the length of the T6SS sheath is not 55
randomly distributed, and hence that the arrest of T6SS sheath elongation is controlled. Based 56
on this conclusion, we hypothesize that T6SS sheath length might be determined by (i) the 57
number of available T6SS tail subunits, (ii) a tape measure protein, or (iii) the cell width. 58
59
T6SS tail sheath length is not regulated by tube/sheath components stoichiometry
60
Several reports have demonstrated that the length of some pilus-like structures is limited by 61
the number of available pilin subunits. For example, the T2SS uses a periplasmic pseudo-62
pilus to expel the substrates in the external medium such as a piston or an Archimedes screw 63
[26]. By artificially increasing the number of pseudo-pilins, µm-long pili can be observed at 64
the cell surface, suggesting that pseudo-pilus length is determined, in part, by the number of 65
available subunits [27,28]. A strict control of the number of subunits in the cell by finely 66
tuned gene expression and protein stability levels would prevent the costly synthesis of 67
unnecessary subunits. To test whether T6SS sheath length might be controlled by the number 68
of available tail subunits, we modified the stoichiometry balance by deregulating the levels of 69
tube/sheath subunits, Hcp, TssB and TssC. TssA, which locates at the distal end of the 70
growing sheath to coordinate the assembly of the tail tube/sheath [29-31], and the TagA 71
stopper [31,32] were not included in the study as single TssA and TagA complexes are 72
responsible for promoting T6SS tail elongation and arrest. tssB-sfGFP, and epitope-tagged 73
tssC and hcp, were cloned into the pTrc99A vector, under the IPTG-inducible ptrc promoter.
74
Pilot experiments showed that the production of TssB-sfGFP, TssC and Hcp can be tightly 75
controlled by varying the IPTG inducer concentrations from 0 to 250 µM in the culture 76
medium. However, although we do not know whether it results from protein aggregation or 77
stoichiometric unbalance, we noticed that IPTG concentrations higher that 50 µM yielded 78
non-functional T6SSs, as no dynamic sheath structures were observable by fluorescence 79
microscopy. Nevertheless, with IPTG concentrations ranging from 0 to 10 µM, we observed 80
an increase in TssB-sfGFP, TssC and Hcp protein levels up to ~14-18 fold (Figure 2A) 81
without affecting T6SS sheath formation and dynamics (Figure 2B). However, sheath length 82
measurement analyses did not reveal striking differences (Figure 2B, 2C and Figure S1). 83
Collectively, our results therefore argue against a direct correlation between the abundance of 84
T6SS tail subunits and T6SS sheath length. 85
86
T6SS sheath length is not regulated by a tape measure protein.
The length of contractile bacteriophage tails is dictated by a tape measure protein (TMP) [18-88
20,33,34]. Such a ruler mechanism has been also evidenced or proposed for other CISs such 89
as antifeeding prophages and Photorhabdus virulence cassettes, or non-contractile structures 90
such as T3SS injectisome needles in Yersinia, or the bacterial hook in Salmonella [21,22,35– 91
38]. Although bacterial T6SSs have been shown to be structurally and functionally related to 92
contractile bacteriophages [6], and contrarily to R-pyocins, AFP, PVC or ACS gene clusters 93
[21,22,35], no gene encoding a potential TMP can be found within T6SS clusters [39]. In 94
addition, previous experiments showing T6SS tail sheath extension in Vibrio cholerae 95
spheroplasts [40] and in EAEC and V. cholerae tagA mutants [31,32] suggested that longer 96
tails assemble in the cell, hence arguing against a tape measure-like mechanism. To discard 97
this hypothesis, we sought to reposition the T6SS at the cell pole to follow the assembly of the 98
T6SS in the long axis of the cell body. In these conditions, the presence of a TMP would 99
cause an arrest of tail extension in the cytoplasm, whereas the tail will extend towards the 100
opposite cell pole or until no tail subunit is available for a TMP-independent mechanism. 101
T6SS biogenesis starts with the assembly of the membrane complex (MC) [7,15]. The T6SS 102
MC is composed of the TssJ outer membrane lipoprotein, and TssL and TssM inner 103
membrane proteins [14]. Its biogenesis starts with the positioning of TssJ and is pursued by 104
the sequential recruitment of TssM and TssL [15]. The MC initially positions along the cell 105
body with an underrepresentation at the cell pole [15,25]. To reposition T6SS MCs at the cell 106
pole, we fused TssM to the Bacillus subtilis polar/septal determinant DivIVA. This approach 107
has been successfully used to relocate the T4SS VirD4 coupling protein to the cell pole in 108
Agrobacterium cells [41]. A fragment encoding the B. subtilis divIVA gene was inserted on
109
the chromosome, downstream the tssM ATG start codon and in frame with the tssM coding 110
sequence, to engineer a divIVA-tssM fusion. Because TssL is the last component to be 111
recruited during MC biogenesis [15], we then imaged TssL fused to sfGFP in these cells. 112
Statistical analyses of sfGFP-TssL position, that hence reflects the localization of the fully-113
assembled T6SS MC [15], demonstrated that sfGFP-TssL forms ~32% of polar foci in 114
presence of DivIVA-TssM, by contrast to the wild-type cells, with ~16% of polar foci (Figure 115
3A, 3B). Introduction of the divIVA-tssM fusion into tssB-sfGFP EAEC cells showed that few 116
T6SS tails assemble from the pole suggesting that polar-localized MCs are less functional. 117
However, the number of tail polymerizations starting from the cell pole was significantly 118
increased with the relocation of the MC compared to wild-type cells. Statistical analyses 119
showed that these extensions from the poles lead to significantly longer tails (Figure 3C), with 120
a mean equal to 1.05 ± 0.42 µm (n = 75). Sheaths that crossed the entire cell body with length 121
up to 3.5 µm (corresponding to outliers in Figure 3C), and capable of contraction were readily 122
observed (Figure 3D). Taken together, these data demonstrate that T6SS tails could be 123
artificially extended by relocalization of the MC at the cell pole, and hence that sheath length 124
is not regulated by a TMP-mediated ruler mechanism. 125
126
T6SS tail sheath length is dictated by the cell width.
127
In all the images recorded, we observed that sheaths extend towards and stop when in contact 128
with the opposite membrane. As the membrane mechanically defines the cell limits, one may 129
hypothesize that the distance between the two opposite membrane positions is sufficient to 130
determine sheath length. Indeed, the measure of the distance between the two membranes in 131
cells analyzed in Figure 1 showed a cell width average of 0.86 µm ± 0.07, which is 132
comparable to the sheath length (0.76 µm ± 0.11), specifically if we take into account the 133
widths of the membranes, of the cytoplasmic portion of the MC, and of the BP [8,9,15,16]. To 134
further investigate the impact of cell width on T6SS sheath length, we treated EAEC cells 135
producing TssB-sfGFP with A22, a drug that causes cell shape defects by targeting the 136
cytoskeletal MreB protein. As expected, we observed a significant impact on cell morphology 137
with a trend to cell rounding (Figure 4A). In these conditions, we observed T6SS sheaths with 138
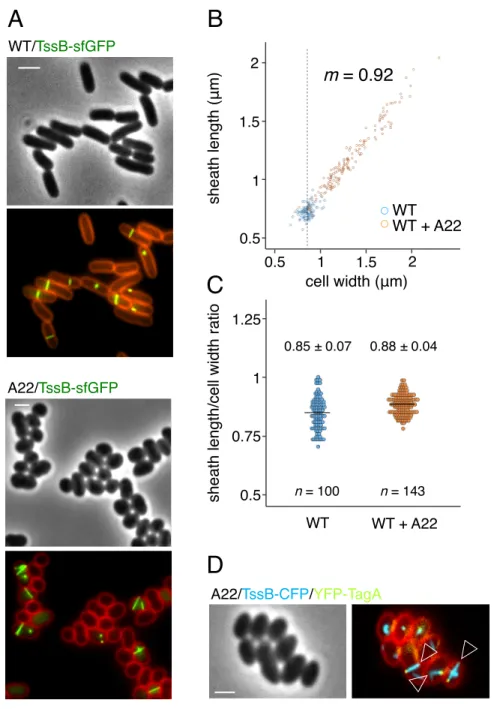
length varying from 0.7 to 2 µm (Figure 4A). However, when sheath length was plotted 139
against cell width, a strict correlation is observed (Kendall’s ! = 0.82) (Figure 4B). In addition, 140
the value of the slope, close to 1 (m = 0.92), demonstrates that sheath length is directly 141
proportional to cell width, which is also confirmed by sheath length/cell width ratio 142
calculations (Figure 4C). Similarly to wild-type cells [32], the distal extremity of these longer 143
extended sheaths co-localized with TagA (Figure 4D). We therefore conclude that T6SS 144
sheath length depends on cell width, and that T6SS sheath polymerization is arrested upon 145
contact with the opposite membrane, likely by the TagA stopper. 146
147
Concluding remarks
148
In this study, we have shown that the T6SS tails in EAEC cells have a defined length. Our 149
further analyses demonstrated that the length of the T6SS tail is not determined by a tape 150
measure protein or by the number of available tail tube/sheath subunits, but rather by the 151
distance between the baseplate and the opposite membrane. This mechanism contrasts with 152
the TMP-dependent regulation found in most contractile tailed machines. However it is in 153
agreement with the fact that no putative TMP-encoding genes are encoded on T6SS gene 154
clusters [5,39]. In TMP-dependent contractile tails, it has been shown that a strict correlation 155
exists between the number of TMP residues and the length of cognate sheaths [21,22]. An 156
extrapolation for the T6SS would mean that a sheath of 0.76 µm corresponds to a TMP of ~ 157
5,000 amino-acids. Such a protein is not encoded within T6SS gene clusters. Finally, the 158
observation that DivIV-mediated relocalisation of the MC to the cell pole yields extra-long 159
sheath structures demonstrates that no TMP is involved. The assembly of extra-long sheaths 160
also suggests that the number of subunits necessary to assemble a tail tube/sheath is not 161
limiting in the bacterial cytoplasm, and hence that sheath length is not regulated by the 162
number of available tail subunits. Indeed, this hypothesis was also discarded by artificially 163
modulating the levels of T6SS tail subunits, demonstrating that it does not influence tail 164
sheath length. This results is also in agreement with the recent measurement of T6SS subunits 165
abundance demonstrating that tail tube/sheath components are not limiting in Acinetobacter 166
baylyi, V. cholerae, or P. aeruginosa cells [42]. All our observations therefore argue for an
167
arrest of sheath polymerization at the opposite membrane. This hypothesis is likely, as 168
altering the distance between the two membranes by using A22, an antagonist of the MreB 169
morphological determinant, showed a strict correlation between membrane width and sheath 170
length. We conclude that tail tube/sheath polymerization stops when it hits the opposite 171
membrane. In most cases, the assembly of the T6SS tubular structure starts perpendicular to 172
the membrane and hence, the length of the sheath correlates with the cell width. However, 173
when T6SS tail assembly starts non-perpendicularly, its polymerization will proceed until it 174
touches the opposite membrane boundary. This model is also consistent with the recent 175
identification of TagA, a membrane-bound protein that binds to the distal extremity of the 176
growing tail and stops tube/sheath polymerization in EAEC and V. cholerae [31,32]. However, 177
TagA is not a universal stopper as recordings of sheath dynamics of TagA+ T6SS (V. 178
cholerae) or T6SSs lacking TagA (Acinetobacter baylyi, P. aeruginosa H1, S. enterica
179
Typhimurium, Francisella novicida) showed that sheaths extend to and stop at the opposite 180
membrane [40, 42-45]. It would be interesting to define how T6SS sheath polymerization is 181
stopped in bacterial species lacking TagA. 182
In conclusion, T6SS has evolved to use a mechanism of tail length control distinct 183
from other CISs. We thus propose a model in which T6SS tail length is determined by the 184
distance to the opposite membrane. In EAEC, and likely other TagA+ species, proper arrest of 185
tail tube/sheath polymerization is mediated by the TagA stopper by binding to the TssA cap 186
protein once the distal end of the sheath hits the opposite membrane. . 187
188
Acknowledgments
189
We thank Abdelrahim Zoued for constructing plasmid pKD4-YFP, Adrien Ducret for advices
190
regarding the use of MicrobeJ, Handuo Shi, Kerwyn Casey Huang (Stanford University, USA),
191
Daisuke Shiomi (Rykio University, Tokyo, Japan), and laboratory members for discussion, Moly Ba,
192
Isabelle Bringer, Annick Brun, and Olivier Uderso for technical assistance, and Lydie Odu-Vilaj for
193
encouragements. This work was funded by the Centre National de la Recherche Scientifique, the
Aix-194
Marseille Université, and grants from the Agence Nationale de la Recherche (ANR-14-CE14-0006-02,
195
ANR-17-CE11-0039-01), the Fondation pour la Recherche Médicale (DEQ20180339165), and the
196
Fondation Bettencourt-Schueller to EC. YGS is supported by a doctoral fellowship from the French
197
ministry of higher education and research. The funders had no role in study design, data collection and
198
interpretation, or the decision to submit the work for publication.
199 200
Authors contributions
201
Y.G.S. and E.C. designed research; Y.G.S., T.D. and E.C. performed research; Y.G.S. 202
performed statistical analyses; Y.G.S., T.D., and E.C. analyzed data; L.J. provided expertise 203
and feedback; Y.G.S. and E.C. wrote the paper with contributions from T.D. and L.J. 204
205
Declaration of interests
206
The authors declare no competing interests. 207
Legend to Figures
209
Figure 1. Statistical measure of the EAEC T6SS sheath length. (A) Representative
210
fluorescence micrograph of EAEC cells producing TssB-sfGFP and labelled with FM4-64 211
(upper panel, phase channel; lower panel, merge of GFP and FM4-64 channels). Scale bar, 1 212
µm. (B) Representative fluorescence micrograph of EAEC cells producing TssB-CFP and 213
YFP-TagA, and labeled with FM4-64 (upper panel, phase channel; lower panel, merge of 214
CFP, YFP, and FM4-64 channels). The open arrowheads point T6SS extended sheaths in 215
contact with the TagA stopper. Scale bar, 1 µm. (C) Violin plot representation of the sheath 216
length in wild-type cells. The distribution of the sheath lengths is represented by the outer 217
shape. The bold horizontal bar represents the median value (median = 0.76 µm); the lower 218
and upper boundaries of the internal box plot correspond to the 25th and 75th percentiles 219
respectively; whiskers extend 1.5 times the interquartile range from the 25th and 75th 220
percentiles. The number of measured sheaths (n=150) is indicated above. 221
Figure 2. T6SS tail tube/sheath subunits levels do not determine T6SS sheath length. (A)
222
Western-blot analyses of tail tube/sheath component abundance. 2×10⁸ cells of ∆tssBC∆hcp 223
cells producing TssB-sfGFP (TssBsfGFP), 6×His-tagged TssC (TssC6His) and FLAG-tagged 224
Hcp (HcpFLAG)from the pTrc-BGFP-C6H-HcpF grownin presence of 0.4% of glucose or of the 225
indicated concentration of IPTG were subjected to 12.5% acrylamide SDS-PAGE and 226
immunodetected with anti-GFP, -His, -FLAG and -EF-Tu monoclonal primary antibodies and 227
secondary antibodies coupled to AlexaFluor® 680. The EF-Tu cytoplasmic elongation factor 228
is used as loading control. The increased fold values compared to the glucose condition, 229
measured by densitometric quantification of the band signal intensities and relative to the 230
loading control, are indicated below. Molecular weight markers (in kDa) are indicated on left. 231
(B-C) Representative fluorescence microscopy recordings (B) and statistical analyses of 232
sheath length measurements (C) of ∆tssBC∆hcp cells producing HcpFLAG, TssB-sfGFP and 233
TssC6His in presence of 0.4% glucose or of the indicated concentration of IPTG, and labelled 234
with FM4-64 (left panels, phase channel; right panels, merge of GFP and FM4-64 channels). 235
Scale bar, 2 µm. In the violin plot representation of the statistical analysis, the distribution of 236
the sheath length is represented by the outer shape. The bold horizontal bar represents the 237
median; the lower and upper boundaries of the internal box plot correspond to the 25th and 238
75th percentiles respectively; whiskers extend 1.5 times the interquartile range from the 25th 239
and 75th percentiles. Outliers are shown as black dots. Statistical significance from three 240
independent assays (n= 100 for each conditions) relative to the glucose condition is indicated 241
above the plots (ns, non-significative; ***, p < 0.001; two-tailed Student's t-test). A 242
comparison of tail tube/sheath subunits levels and sheath lengths is shown in Figure S1. 243
Figure 3. Sheath length is not controlled by a tape measure protein. Representative
244
fluorescence microscopy recordings of EAEC cells producing sfGFP-TssL in WT (A) or 245
DivIV-TssM (B) cells, and labelled with FM4-64 (upper panels, phase channel; lower panels, 246
merge of GFP and FM4-64 channels). White and blue arrowheads indicate TssL foci with 247
body or polar localizations, respectively. Scale bar, 2 µm. The spatial repartition of sfGFP-248
TssL foci is shown on right, as a projection of foci from n=152 and n=151 WT and DivIVA-249
TssM cells, respectively, on a single cell (from blue to yellow, see heatmap color chart on 250
right of panel A). The percentage of sfGFP-TssL foci with polar localization is indicated 251
below. (C) Violin plot representation of sheath length measurements in DivIVA-TssM cells 252
producing TssB-sfGFP (red). An example of a representative microscopy field is shown in the 253
inset (scale bar, 2 µm). The distribution of sheath length in WT cells (shown in Figure 1B) is 254
reported in transparency for comparison (blue). The distribution of the sheath length is 255
represented by the outer shape. The bold horizontal bar represents the median value (median 256
= 0.93 µm and 0.76 µm for DivIVA-TssM and WT cells, respectively); the lower and upper 257
boundaries of the internal box plot correspond to the 25th and 75th percentiles respectively; 258
whiskers extend 1.5 times the interquartile range from the 25th and 75th percentiles. Outliers 259
are shown as black dots. The number of measured sheaths (n=75) is indicated below. 260
Statistical significance relative to WT cells is indicated above the plots (***, p < 0.001; one-261
tailed Wilcoxon’s t-test). (D) Fluorescence microscopy time-lapse recordings of DivIVA-262
TssM cells producing TssB-sfGFP highlighting polar T6SS sheath assembly (white 263
arrowhead) and contraction (blue arrowhead). Scale bar, 2 µm. 264
Figure 4. Cell width dictates T6SS sheath length. (A) Representative fluorescence
265
micrographs of EAEC cells producing TssB-sfGFP in absence (upper panel) or in presence of 266
the MreB inhibitor A22 (lower panel), and labelled with FM4-64 (upper panel, phase channel; 267
lower panel, merge of GFP and FM4-64 channels). Scale bar, 2 µm. (B) Plot representation 268
showing the relationship between sheath length and cell width in absence (blue) and presence 269
of A22 (orange). The dashed line represents the mean of the WT cell width (mean = 0.87 µm). 270
Value of the slope (m) is indicated on right. Kendall’s ! = 0.82. (C) Dotplot of the ratios 271
between sheath length and the width of the corresponding cell from cells grown in absence 272
(blue) or presence of A22 (orange). Horizontal bars represent the mean in each condition. The 273
values of the means and standard deviations are indicated above the plots. The number of 274
analyzed cells (n) is indicated below. (D) Representative fluorescence micrograph of EAEC 275
cells producing TssB-CFP and YFP-TagA in presence of the MreB inhibitor A22, and 276
labelled with 64 (left panel, phase channel; right panel, merge of CFP, YFP, and FM4-277
64 channels). The open arrowheads point T6SS extended sheaths in contact with the TagA 278
stopper. Scale bar, 2 µm. 279
280
STAR METHODS
281LEAD CONTACT AND MATERIALS AVAILABILITY
283
Further information and requests for resources and reagents should be directed to and will be 284
fulfilled by the Lead Contact, Eric Cascales ([email protected]). There are no restrictions 285
to the availability of reagents. 286
287
EXPERIMENTAL MODEL AND SUBJECT DETAILS
288
Strains used in this study are listed in Table S1. Escherichia coli DH5α (New England 289
Biolabs) or CC118λpir have been used for cloning procedures. Enteroaggregative E. coli 290
(EAEC) strains used in this work are isogenic derivatives of the wild-type O3:H2 17-2 strain. 291
The wild-type 17-2 strain and its TssB-sfGFP [46], sfGFP-TssL [15], TssB-CFP/YFP-TagA 292
(this work), and DivIVA-TssM (this work) derivatives have been used for in vivo studies. E. 293
coli cells were routinely grown in Lysogeny broth (LB) broth at 37°C, with aeration. For
294
induction of the sci1 T6SS gene cluster, cells were grown in Sci1-inducing medium [SIM: M9 295
minimal medium supplemented with glycerol 0.25 %, vitamin B1 200 µg.mL−1, 296
casaminoacids 40 µg.mL−1, MgCl2 2 mM, CaCl2 0.1 mM, and LB (10% v/v)] [24]. Plasmids 297
and chromosomal deletions and insertions were maintained by the addition of kanamycin (50 298
µg.mL−1), or ampicillin (100 µg.mL−1). Gene expression from pTrc99A derivative plasmids 299
was induced at A600 nm ≈ 0.4 by the addition of 2-10 µM of isopropyl-β-D-thio-300
galactopyranoside (IPTG, Sigma-Aldrich). The MreB antagonist
S-(3,4-301
dichlorobenzyl)isothiourea hydrochloride (known as A22 [47], purchased from Sigma-302
Aldrich) has been added to the culture at the concentration of 10 µg.mL-1 for 2 hours prior 303
analyses. Membranes were stained with 10 µg.mL-1 of the N-(3-triethylammoniumpropyl)-4-304
(6-(4-(diethylamino) phenyl) hexatrienyl) pyridinium dibromide dye (FM4-64, Molecular 305
Probes, Life technologies). 306
METHOD DETAILS
308
Plasmid construction. All plasmids used in this study are listed in Table S2.
309
Oligonucleotides used for plasmid construction are listed in Table S3. pTrc99A [48] and 310
pKD4 [49] plasmid derivatives were engineered by ligation-free restriction-free cloning. PCR 311
amplification were performed in a Biometra thermocycler using the Q5® DNA polymerase 312
(New England Biolabs). Briefly, the fragment of interest was amplified and then used as 313
oligonucleotides for a second PCR for amplification of the target plasmid. For construction of 314
pTrc-BGFP-C6His, a fragment encoding tssB-sfGFP and tssC-6×His was amplified from EAEC 315
17-2 TssB-sfGFP [46] genomic DNA using primers
316 GGATAACAATTTCACACAGGAAACAGACCATGAGCAGTTCGTTTCAGAATGAAATCC 317 C and 318 CCCGGGTACCGAGCTCGAATTCTTAATGGTGATGGTGATGATGCGCTTTTGCCTTC 319
GGCATCTGC (6×His tag sequence underlined, sequence annealing on the target pTrc99A 320
plasmid [48] italicized), and inserted into pTrc99A. The hcp gene was amplified from EAEC 321
17-2 genomic DNA using primers
322 GCGCATCATCACCATCACCATTAAGAATTaggaggtattacaccATGGCAATTCCAGTTTA 323 TCTGTGGCTG and 324 GGATCCCCGGGTACCGAGCTCGTTACTTGTCATCGTCATCTTTATAATCCGCGGTGG 325
TACGCTCACTCC (FLAG tag sequence italicized, sequence annealing on the target pTrc-326
BGFP-C6H plasmid underlined, Shine-Dalgarno ribosome-binding site in lower case), and 327
inserted into pTrc-BGFP-C6His to yield pTrc-BGFP-C6H-HcpF. For construction of plasmid 328
pKD4-DivIVA-Nt allowing chromosomal insertion of divIVA at the 5'-end of genes, the 329
divIVA gene was amplified from Bacillus subtilis str. 168 using primers
330
GGAACTTCGGAATAGGAACTAAGGAGGATATTCATATGCCATTAACGCCAAATG 331
ATATTCACAACAAGAC and
GCTGACATGGGAATTAGCCATGGTCCCCTCCGCCGGCCGCTGCTTCCTTTTCCTCA 333
AATACAGCGTCGACTTC (3×Ala-3×Gly sequence linker italicized, sequence annealing on 334
the target pKD4 plasmid underlined), and inserted into plasmid pKD4 [49]. For construction 335
of plasmid pKD4-CFP-Ct allowing chromosomal insertion of ecfp at the 3'-end of genes, the 336
ecfp gene was amplified from the pTrc99A-ecfp vector (gift from Leon Espinosa, LCB,
337
Marseille, France) using primers
338 GATTGCAGCATTACACGTCTTGAGCGATTGCAGCGGCCGGCGGAGGGGTGAGCAA 339 GGGCGAGGAGC and 340 GAACTTCGAAGCAGCTCCAGCCTACACTTACTTGTACAGCTCGTCCATGCCG 341
(3×Ala-3×Gly sequence linker italicized, sequence annealing on the target pKD4 plasmid 342
underlined), and inserted into plasmid pKD4 [49]. For construction of plasmid pKD4-YFP-Nt 343
allowing chromosomal insertion of eyfp at the 5'-end of genes, the eyfp gene was amplified 344
from the pCBP-EYFP vector (gift from Emmanuelle Bouveret, Institut Pasteur, Paris, France) 345 using primers 346 CGGAATAGGAACTAAGGAGGATATTCATATGGTGAGCAAGGGCGAGGAGC and 347 CGGCTGACATGGGAATTAGCCATGGTCCCCTCCGCCGGCCGCTGCCTTGTACAGC 348
TCGTCCATGCCGAGAG (3×Ala-3×Gly sequence linker italicized, sequence annealing on 349
the target pKD4 plasmid underlined), and inserted into plasmid pKD4 [49]. All plasmids were 350
verified by colony-PCR and DNA sequencing (Eurofins genomics). 351
Strain construction. Strains were engineered by λ-red recombination [49] using plasmid
352
pKOBEG [50] and PCR products (oligonucleotides listed in Table S3). Briefly, a kanamycin 353
cassette was amplified from plasmids pKD4, DivIVA-Nt, CFP-Ct, or pKD4-354
YFP-Nt, using oligonucleotides carrying 50-nucleotide extensions homologous to regions 355
adjacent to the gene of interest. Cassette allowing deletion of the hcp gene was generated 356
using the pKD4 vector template with primers
TCCCCTGCGCCGGAAGAGGGCGCATCAGAAAACATAACGGAGTAATTTTTTGTGT 358 AGGCTGGAGCTGCTTCG and 359 TGAAGAAAAAATAAAAATGACGGACAGGATGCCCTGTCCGTCCGGCAGAACATA 360
TGAATATCCTCCTTAGTTCC (50-bp sequence annealing on the 5' and 3' regions of the 361
deleted gene underlined). For chromosomal insertion of DivIVA at the tssM locus, the 362
DivIVA cassette was generated using the pKD4-DivIVA-Nt vector with primers 363 TTCTCATCCGGAGAAGAACATTTTATCAGTACTGTTACATCAGGAAACCAGAATG 364 AATAACGATTGTGTAGGCTGGAGCTGCTTCGAAGTTCCTATAC and 365 CACACCAATAAATACAATCCCCGGTCGCCCAAAGCGACCAGACAGACAGGCCAG 366
TTTATTCCCTCCGCCGGCCGCTGC (50-bp sequence annealing on the 5' and 3' regions of 367
the tssM ATG start codon underlined). For chromosomal insertion of CFP at the tssB locus, 368
the cfp cassette was generated using the pKD4-CFP-Ct vector with primers 369 CCGGCACTGAGTCAGACGCTGCGTGATGAACTGCGTGCACTGGTGCCGGAAAAG 370 GCGGCAGCGGCCGGCGGAGGG and 371 GCAACGTTCTTTTCTTTCTGTACAGACATCAGCATTTTCTCTCGTAATCCGTTAAA 372
CATATGAATATCCTCCTTAGTTCCTATTCCGAAGTTCC (50-bp sequence annealing on 373
the 5' and 3' regions of the tssB TAA stop codon underlined). For chromosomal insertion of 374
YFP at the tagA locus, the yfp cassette was generated using the pKD4-YFP-Nt vector with 375 primers 376 CTTTTCGTCACTGTTAATCATGATTTAATACAGCAACACCGAATCTGCCGCGATTG 377 TGTAGGCTGGAGCTGCTTCGAAGTTCCTATAC and 378 TCCGGTAATGACCGGGGGTCACCACCGGTTTTCAGTTTCACTTCAGAAGTCCCTC 379
CGCCGGCCGCTGC (50-bp sequence annealing on the 5' and 3' regions of the tagA ATG 380
start codon underlined). Cassette amplicons were column-purified (NucleoSpin® Gel and PCR 381
clean-up, Macherey Nagel), and 600 ng were electroporated into electrocompetent target cells 382
(∆tssBC for ∆hcp; 17-2, sfGFP-TssL and TssB-sfGFP for DivIVA; 17-2 for TagA; YFP-383
TagA for TssB-CFP), kanamycin-resistant clones were selected and verified by colony-PCR. 384
When possible, kanamycin cassettes were excised by the FRT-specific FLP recombinase 385
using vector pCP20 [49]. 386
SDS-PAGE, Western-blotting, imaging and quantification analyses. Standard methods
387
were used for sodium dodecyl-sulfate poly-acrylamide gel electrophoresis (SDS-PAGE) and 388
protein transfer on nitrocellulose membranes. Membranes were probed with anti-GFP (clone 389
7.1, Roche), anti-His (clone His1, Sigma), anti-FLAG (clone M2, Sigma), and anti-EF-Tu 390
(clone mAb900, HyCult Biotech) monoclonal antibodies, and goat anti-mouse secondary 391
antibodies coupled to AlexaFluor® 680 (Invitrogen). Images were recorded at λ=700 nm using 392
an Odyssey® infrared imaging system (LI-COR Biosciences). Image analyses were performed 393
with the ImageJ processing program using the Fiji interface [51], as previously described [52]. 394
Briefly, the image was first converted to grayscale in .jpg format. The rectangle tool of 395
ImageJ was used to select a rectangular area of the size corresponding to the lane width, in 396
order to cover the minimal area to contain the whole of the largest band. The same frame was 397
used to select each TssB, TssC, Hcp or EF-Tu band. For each selection, the number of pixels 398
was calculated. A control region with no band was also selected to subtract the background. 399
The number of pixels of each band, subtracted from the background, was then divided by the 400
EF-Tu loading control intensity at the same IPTG concentration, to compensate for loading 401
differences. The fold-change relative to the glucose sample was then calculated. 402
Fluorescence microscopy and statistical analyses. Cells were grown in SIM to a A600 nm ≈ 403
0.6–0.8, harvested and resuspended in fresh SIM to a A600 nm ≈ 10. For inhibition of MreB 404
function, cells grown in SIM were treated at A600 nm ≈ 0.3 for 2 hours with 10 µg.mL-1 of A22 405
prior to data acquisition, as previously published [53]. For membrane staining, cells were 406
labelled with FM4-64 (10 µg.mL-1) for 2 min prior to centrifugation. Concentrated cell 407
mixtures were spotted on a thin pad of SIM supplemented with 2% agarose, or 2% agarose 408
and A22 (10 µg.mL−1), covered with a cover slip, and incubated for 20-30 min at room 409
temperature before microscopy acquisition. Fluorescence microscopy was performed on a 410
Nikon Eclipse Ti microscope equipped with an Orcaflash 4.0 LT digital camera (Hamamatsu) 411
and a perfect focus system (PFS) to automatically maintain focus so that the point of interest 412
within a specimen is always kept in sharp focus at all times despite mechanical or thermal 413
perturbations. All fluorescence images were acquired with a minimal exposure time to 414
minimize bleaching and phototoxicity effects. Exposure times were typically 30 ms for phase 415
contrast, 200 ms for TssB-sfGFP, 300 ms for TssB-CFP, 1 s for sfGFP-TssL, 1.5 s for YFP-416
TagA, and 50 ms for FM4-64. The experiments were performed at least in triplicate and a 417
representative result is shown. Images were analyzed using ImageJ (http://imagej.nih.gov/ij/) 418
and the MicrobeJ v5.11y plugin (http://www.microbej.com/) [54]. 419
420
QUANTIFICATION AND STATISTICAL ANALYSIS
421
Statistical analyses of microcopy images were performed with several representative fields 422
from at least three independent biological replicates, using Excel and the R software 423
environment. The number of measured cells or events (n) is indicated on each figure. 424
Differences in sheath length between groups were examined by unpaired parametric Student t 425
test or nonparametric Wilcoxon t test. Relationship between sheath length and cell width was 426
examined by Mann-Kendall test. Significance was defined by p < 0.001 (***) and p < 0.0001 427
(****). 428
DATA AND CODE AVAILABILITY
430
This study did not generate datasets and codes. 431
432 433
REFERENCES
434
1. Cherrak, Y, Flaugnatti, N, Durand, E, Journet, L, and Cascales, E. (2019). Structure and 435
activity of the type VI secretion system. Microbiol. Spectrum 7, PSIB-0031-2019. 436
2. Coulthurst, S. (2019). The Type VI secretion system: a versatile bacterial weapon. 437
Microbiol. 165, 503–515. 438
3. Durand, E., Cambillau, C., Cascales, E., and Journet, L. (2014). VgrG, Tae, Tle, and 439
beyond: the versatile arsenal of Type VI secretion effectors. Trends Microbiol. 22, 498– 440
507. 441
4. Chassaing, B., and Cascales, E. (2018). Antibacterial weapons: targeted destruction in the 442
microbiota. Trends Microbiol. 26, 329–338. 443
5. Sarris, P.F., Ladoukakis, E.D., Panopoulos, N.J., and Scoulica, E.V. (2014). A phage tail-444
derived element with wide distribution among both prokaryotic domains: a comparative 445
genomic and phylogenetic study. Genome Biol. Evol. 6, 1739–1747. 446
6. Taylor, N.M.I., van Raaij, M.J., and Leiman, P.G. (2018). Contractile injection systems of 447
bacteriophages and related systems. Mol. Microbiol. 108, 6–15. 448
7. Brunet, Y.R., Zoued, A., Boyer, F., Douzi, B., and Cascales, E. (2015). The type VI 449
secretion TssEFGK-VgrG phage-like baseplate is recruited to the TssJLM membrane 450
complex via multiple contacts and serves as assembly platform for tail tube/sheath 451
polymerization. PLoS Genet. 11, e1005545. 452
8. Nazarov, S., Schneider, J.P., Brackmann, M., Goldie, K.N., Stahlberg, H., and Basler, M. 453
(2018). Cryo-EM reconstruction of Type VI secretion system baseplate and sheath distal 454
end. EMBO J. 37, e97103. 455
9. Cherrak, Y., Rapisarda, C., Pellarin, R., Bouvier, G., Bardiaux, B., Allain, F., Malosse, 456
C., Rey, M., Chamot-Rooke, J., Cascales, E., et al. (2018). Biogenesis and structure of a 457
type VI secretion baseplate. Nat. Microbiol. 3, 1404–1416. 458
10. Brunet, Y.R., Hénin, J., Celia, H., and Cascales, E. (2014). Type VI secretion and 459
bacteriophage tail tubes share a common assembly pathway. EMBO Rep. 15, 315–321. 460
11. Leiman, P.G., Basler, M., Ramagopal, U.A., Bonanno, J.B., Sauder, J.M., Pukatzki, S., 461
Burley, S.K., Almo, S.C., and Mekalanos, J.J. (2009). Type VI secretion apparatus and 462
phage tail-associated protein complexes share a common evolutionary origin. Proc. Natl. 463
Acad. Sci. U. S. A. 106, 4154–4159. 464
12. Basler, M., Pilhofer, M., Henderson, G.P., Jensen, G.J., and Mekalanos, J.J. (2012). Type 465
VI secretion requires a dynamic contractile phage tail-like structure. Nature 483, 182–186. 466
13. Kudryashev, M., Wang, R.Y.-R., Brackmann, M., Scherer, S., Maier, T., Baker, D., 467
DiMaio, F., Stahlberg, H., Egelman, E.H., and Basler, M. (2015). Structure of the Type 468
VI secretion system contractile sheath. Cell 160, 952–962. 469
14. Aschtgen, M.-S., Gavioli, M., Dessen, A., Lloubès, R., and Cascales, E. (2010). The SciZ 470
protein anchors the enteroaggregative Escherichia coli Type VI secretion system to the 471
cell wall. Mol. Microbiol. 75, 886–899. 472
15. Durand, E., Nguyen, V.S., Zoued, A., Logger, L., Péhau-Arnaudet, G., Aschtgen, M.-S., 473
Spinelli, S., Desmyter, A., Bardiaux, B., Dujeancourt, A., et al. (2015). Biogenesis and 474
structure of a type VI secretion membrane core complex. Nature 523, 555–60. 475
16. Rapisarda, C., Cherrak, Y., Kooger, R., Schmidt, V., Pellarin, R., Logger, L., Cascales, 476
E., Pilhofer, M., Durand, E., and Fronzes, R. (2019). In situ and high-resolution cryo-EM 477
structure of a bacterial type VI secretion system membrane complex. EMBO J. 38, 478
e100886. 479
17. Katsura, I., and Hendrix, R.W. (1984). Length determination in bacteriophage lambda 480
tails. Cell 39, 691–698. 481
18. Katsura, I. (1990). Mechanism of length determination in bacteriophage lambda tails. Adv. 482
Biophys. 26, 1–18. 483
19. Abuladze, N.K., Gingery, M., Tsai, J., and Eiserling, F.A. (1994). Tail length 484
determination in bacteriophage T4. Virology 199, 301–310. 485
20. Belcaid, M., Bergeron, A., and Poisson, G. (2011). The evolution of the tape measure 486
protein: units, duplications and losses. BMC Bioinformatics 12, S10. 487
21. Rybakova, D., Schramm, P., Mitra, A.K., and Hurst, M.R.H. (2015). Afp14 is involved in 488
regulating the length of anti-feeding prophage (Afp). Mol. Microbiol. 96, 815–826. 489
22. Böck, D., Medeiros, J.M., Tsao, H.-F., Penz, T., Weiss, G.L., Aistleitner, K., Horn, M., 490
and Pilhofer, M. (2017). In situ architecture, function, and evolution of a contractile 491
injection system. Science 357, 713–717. 492
23. Vianelli, A., Wang, G.R., Gingery, M., Duda, R.L., Eiserling, F.A., and Goldberg, E.B. 493
(2000). Bacteriophage T4 self-assembly: localization of gp3 and its role in determining 494
tail length. J. Bacteriol. 182, 680–688. 495
24. Brunet, Y.R., Bernard, C.S., Gavioli, M., Lloubès, R., and Cascales, E. (2011). An 496
epigenetic switch involving overlapping fur and DNA methylation optimizes expression 497
of a type VI secretion gene cluster. PLoS Genet. 7, e1002205. 498
25. Santin, Y.G., Camy, C.E., Zoued, A., Doan, T., Aschtgen, M.-S., and Cascales, E. (2019). 499
Role and recruitment of the TagL peptidoglycan-binding protein during Type VI secretion 500
system biogenesis. J. Bacteriol. 201, e00173-19. 501
26. Nivaskumar, M., and Francetic, O. (2014). Type II secretion system: a magic beanstalk or 502
a protein escalator. Biochim. Biophys. Acta 1843, 1568–1577. 503
27. Sauvonnet, N., Vignon, G., Pugsley, A.P., and Gounon, P. (2000). Pilus formation and 504
protein secretion by the same machinery in Escherichia coli. EMBO J. 19, 2221–2228. 505
28. Durand, E., Bernadac, A., Ball, G., Lazdunski, A., Sturgis, J.N., and Filloux, A. (2003). 506
Type II protein secretion in Pseudomonas aeruginosa: the pseudopilus is a multifibrillar 507
and adhesive structure. J. Bacteriol. 185, 2749–2758. 508
29. Zoued, A., Durand, E., Brunet, Y.R., Spinelli, S., Douzi, B., Guzzo, M., Flaugnatti, N., 509
Legrand, P., Journet, L., Fronzes, R., et al. (2016). Priming and polymerization of a 510
bacterial contractile tail structure. Nature 531, 59–63. 511
30. Zoued, A., Durand, E., Santin, Y.G., Journet, L., Roussel, A., Cambillau, C., and 512
Cascales, E. (2017). TssA: The cap protein of the Type VI secretion system tail. 513
Bioessays 39, 10. 514
31. Schneider, J.P, Nazarov, S., Adaixo, R., Liuzzo, M., Ringel, P.D., Stahlberg, H., and 515
Basler, M. (2019). Diverse roles of TssA-like proteins in the assembly of bacterial type 516
VI secretion systems. EMBO J. 12, e100825. 517
32. Santin, Y.G., Doan, T., Lebrun, R., Espinosa, L., Journet, L., and Cascales, E. (2018). In 518
vivo TssA proximity labelling during type VI secretion biogenesis reveals TagA as a 519
protein that stops and holds the sheath. Nat. Microbiol. 3, 1304–1313. 520
33. Katsura, I. (1987). Determination of bacteriophage lambda tail length by a protein ruler. 521
Nature 327, 73–75. 522
34. Boulanger, P., Jacquot, P., Plançon, L., Chami, M., Engel, A., Parquet, C., Herbeuval, C., 523
and Letellier, L. (2008). Phage T5 straight tail fiber is a multifunctional protein acting as a 524
tape measure and carrying fusogenic and muralytic activities. J. Biol. Chem. 283, 13556– 525
13564. 526
35. Jiang, F., Li, N., Wang, X., Cheng, J., Huang, Y., Yang, Y., Yang, J., Cai, B., Wang, Y.-527
P., Jin, Q., et al. (2019). Cryo-EM structure and assembly of an extracellular contractile 528
injection system. Cell 177, 370-383.e15. 529
36. Journet, L., Agrain, C., Broz, P., and Cornelis, G.R. (2003). The needle length of bacterial 530
injectisomes is determined by a molecular ruler. Science 302, 1757–1760. 531
37. Cornelis, G.R., Agrain, C., and Sorg, I. (2006). Length control of extended protein 532
structures in bacteria and bacteriophages. Curr. Opin. Microbiol. 9, 201–206. 533
38. Hirano, T., Yamaguchi, S., Oosawa, K., and Aizawa, S. (1994). Roles of FliK and FlhB in 534
determination of flagellar hook length in Salmonella typhimurium. J. Bacteriol. 176, 535
5439–5449. 536
39. Boyer, F., Fichant, G., Berthod, J., Vandenbrouck, Y., and Attree, I. (2009). Dissecting 537
the bacterial type VI secretion system by a genome wide in silico analysis: what can be 538
learned from available microbial genomic resources? BMC Genomics 10, 104. 539
40. Vettiger, A., Winter, J., Lin, L., and Basler, M. (2017). The type VI secretion system 540
sheath assembles at the end distal from the membrane anchor. Nat. Commun. 8, 16088. 541
41. Atmakuri, K., Ding, Z., and Christie, P.J. (2003). VirE2, a type IV secretion substrate, 542
interacts with the VirD4 transfer protein at cell poles of Agrobacterium tumefaciens. Mol. 543
Microbiol. 49, 1699–1713. 544
42. Lin, L., Lezan, E., Schmidt, A., and Basler, M. (2019). Abundance of bacterial Type VI 545
secretion system components measured by targeted proteomics. Nat Commun. 10, 2584. 546
43. Brunet, Y.R., Khodr, A., Logger, L., Aussel, L., Mignot, T., Rimsky, S., and Cascales, E. 547
(2015). H-NS silencing of the Salmonella Pathogenicity Island 6-encoded type VI 548
secretion system limits Salmonella enterica serovar Typhimurium interbacterial killing. 549
Infect Immun. 83, 2738–2750. 550
44. Brodmann, M., Dreier, R.F., Broz, P., and Basler, M. (2017). Francisella requires 551
dynamic type VI secretion system and ClpB to deliver effectors for phagosomal escape. 552
Nat Commun. 8, 15853. 553
45. Liebl, D., Robert-Genthon, M., Job, V., Cogoni, V., and Attree, I. (2019). Baseplate 554
Component TssK and spatio-temporal assembly of T6SS in Pseudomonas aeruginosa. 555
Front Microbiol. 10, 1615. 556
46. Zoued, A., Durand, E., Bebeacua, C., Brunet, Y.R., Douzi, B., Cambillau, C., Cascales, 557
E., and Journet, L. (2013). TssK is a trimeric cytoplasmic protein interacting with 558
components of both phage-like and membrane anchoring complexes of the type VI 559
secretion system. J. Biol. Chem. 288, 27031–27041. 560
47. Iwai, N., Ebata, T., Nagura, H., Kitazume, T., Nagai, K., and Wachi, M. (2004). 561
Structure-activity relationship of S-benzylisothiourea derivatives to induce spherical cells 562
in Escherichia coli. Biosci. Biotechnol. Biochem. 68, 2265–2269. 563
48. Amann, E., Ochs, B., and Abel, K.J. (1988). Tightly regulated tac promoter vectors useful 564
for the expression of unfused and fused proteins in Escherichia coli. Gene 69, 301–315. 565
49. Datsenko, K.A., and Wanner, B.L. (2000). One-step inactivation of chromosomal genes in 566
Escherichia coli K-12 using PCR products. Proc. Natl. Acad. Sci. U. S. A. 97, 6640–6645. 567
50. Chaveroche, M.-K., Ghigo, J.-M., and d’Enfert, C. (2000). A rapid method for efficient 568
gene replacement in the filamentous fungus Aspergillus nidulans. Nucleic Acids Res. 28, 569
e97. 570
51. Schindelin, J., Arganda-Carreras, I., Frise, E., Kaynig, V., Longair, M., Pietzsch, T., 571
Preibisch, S., Rueden, C., Saalfeld, S., Schmid, B., et al. (2012). Fiji: an open-source 572
platform for biological-image analysis. Nat. Methods 9, 676–682. 573
52. Zoued, A., Duneau, J.-P., Durand, E., España, A.P., Journet, L., Guerlesquin, F., and 574
Cascales, E. (2018). Tryptophan-mediated dimerization of the TssL transmembrane 575
anchor is required for type VI secretion system activity. J. Mol. Biol. 430, 987–1003. 576
53. Kawazura, T., Matsumoto, K., Kojima, K., Kato, F., Kanai, T., Niki, H., and Shiomi, D. 577
(2017). Exclusion of assembled MreB by anionic phospholipids at cell poles confers cell 578
polarity for bidirectional growth. Mol. Microbiol. 104, 472–486. 579
54. Ducret, A., Quardokus, E.M., and Brun, Y.V. (2016). MicrobeJ, a tool for high 580
throughput bacterial cell detection and quantitative analysis. Nat. Microbiol. 1, 16077. 581
Fig. 1. Statistical measure of the EAEC T6SS sheath length. (A) Representative fluorescence micrograph of EAEC cells producing TssB-sfGFP and labelled with FM4-64 (upper panel, phase channel; lower panel, merge of GFP and FM4-64 channels). Scale bar, 1 µm. (B) Representative fluorescence micrograph of EAEC cells producing TssB-CFP and YFP-TagA, and labeled with FM4-64 (upper panel, phase channel; lower panel, merge of CFP, YFP, and FM4-64 channels). The open arrowheads point T6SS extended sheaths in contact with the TagA stopper. Scale bar, 1 µm. (C) Violin plot representation of the sheath length in wild-type cells. The distribution of the sheath lengths is represented by the outer shape. The bold horizontal bar represents the median value (median = 0.76 µm); the lower and upper boundaries of the internal box plot correspond to the 25th and 75th percentiles respectively; whiskers extend 1.5 times the interquartile range from the 25th and 75th percentiles. The number of measured sheaths (n=150) is indicated above.
C
0.50 0.75 1.00 x Sheathlength 0.5 0.75 1 n = 150 sh e a th length ( μ m )A
TssB-GFPB
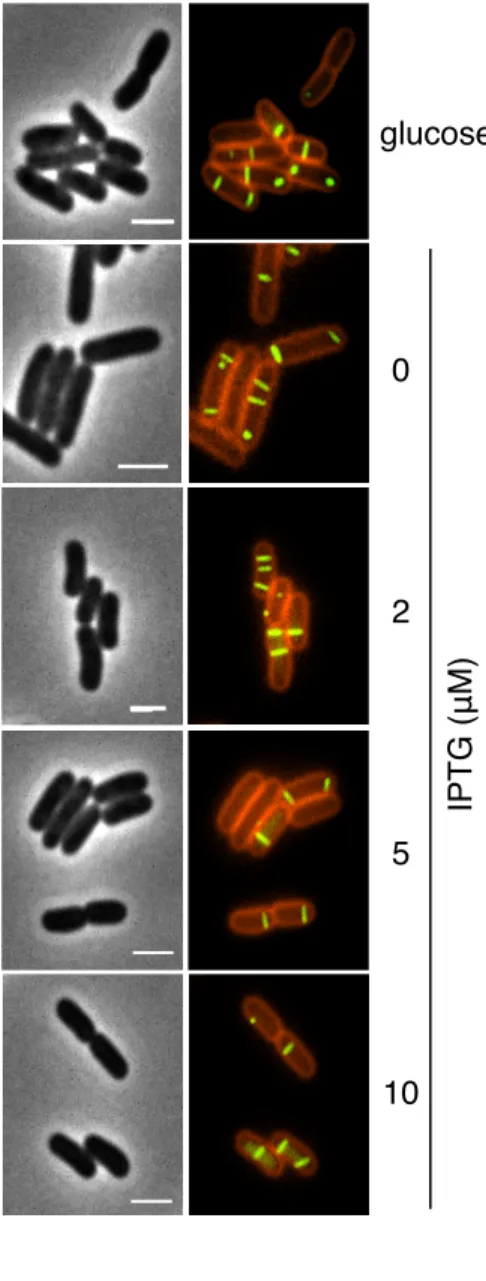
TssB-CFP/YFP-TagAFig. 2. T6SS tail tube/sheath subunits levels do not determine T6SS sheath length. (A) Western-blot analyses of tail tube/sheath component abundance. 2×10⁸ cells of ∆tssBC∆hcp cells producing TssB-sfGFP
(TssBsfGFP), 6×His-tagged TssC (TssC6His)and FLAG-tagged Hcp (HcpFLAG)from the pTrc-BGFP-C6H-HcpF grownin presence of 0.4% of glucose or of the indicated concentration of IPTG were subjected to 12.5% acrylamide SDS-PAGE and immunodetected with anti-GFP, -His, -FLAG and -EF-Tu monoclonal primary antibodies and secondary antibodies coupled to AlexaFluor® 680. The EF-Tu cytoplasmic elongation factor
is used as loading control. The increased fold values compared to the glucose condition, measured by densitometric quantification of the band signal intensities and relative to the loading control, are indicated below. Molecular weight markers (in kDa) are indicated on left. (B-C) Representative fluorescence microscopy recordings (B) and statistical analyses of sheath length measurements (C) of ∆tssBC∆hcp cells producing HcpFLAG, TssB-sfGFP and TssC6His in presence of 0.4% glucose or of the indicated concentration of IPTG, and labelled with FM4-64 (left panels, phase channel; right panels, merge of GFP and FM4-64 channels). Scale bar, 2 µm. In the violin plot representation of the statistical analysis, the distribution of the sheath length is represented by the outer shape. The bold horizontal bar represents the median; the lower and upper boundaries of the internal box plot correspond to the 25th and 75th percentiles respectively; whiskers extend 1.5 times the interquartile range from the 25th and 75th percentiles. Outliers are shown as black dots. Statistical significance from three independent assays (n= 100 for each conditions) relative to the glucose condition is indicated above the plots (ns, non-significative; ***, p < 0.001; two-tailed Student's
t-test). A comparison of tail tube/sheath subunits levels and sheath lengths is shown in Fig. S1.
A
B
C
13.8 1 1.9 3.4 7.6 TssC6His 72 55 1 1 1 1.1 1 EF-Tu 55 43 10 0 2 5 HcpFLAG 26 17 17.9 1 2.9 4.5 9.6 TssBsfGFP 55 43 16.1 1 2.7 4.9 7.1 g lu co se IPTG (μM) IPT G ( μ M ) 0 2 5 glucose 10 ns ns **** **** 0.4 0.6 0.8 1.0 1.21Glu 2zero 3deux 4cinq 5dix Type Sheathlength sh e a th length ( μ m ) 0.8 0.6 1 0.4 g lu co se 0 2 5 10 IPTG (μM) 1.2 ns ns
A
B
D
WT/sfGFP-TssL n = 152 15.8 % +-C
DivIVA-TssM/sfGFP-TssL n = 151 32.4 % DivIVA-TssM/ TssB-sfGFP sh e a th length ( μ m ) DivIVA-TssM WT n = 75 n = 150 4 0 3 2 1 DivIVA-TssM/TssB-sfGFP 40 80 120 160 200 240 280 600 640 0Fig. 3. Sheath length is not controlled by a tape measure protein. Representative fluorescence microscopy recordings of EAEC cells producing sfGFP-TssL in WT (A) or DivIV-TssM (B) cells, and labelled with FM4-64 (upper panels, phase channel; lower panels, merge of GFP and FM4-64 channels). White and blue arrowheads indicate TssL foci with body or polar localizations, respectively. Scale bar, 2 µm. The spatial repartition of sfGFP-TssL foci is shown on right, as a projection of foci from n=152 and
n=151 WT and DivIVA-TssM cells, respectively, on a single cell (from blue to yellow, see heatmap color
chart on right of panel A). The percentage of sfGFP-TssL foci with polar localization is indicated below. (C) Violin plot representation of sheath length measurements in DivIVA-TssM cells producing TssB-sfGFP (red). An example of a representative microscopy field is shown in the inset (scale bar, 2 µm). The distribution of sheath length in WT cells (shown in Fig. 1B) is reported in transparency for comparison (blue). The distribution of the sheath length is represented by the outer shape. The bold horizontal bar represents the median value (median = 0.93 µm and 0.76 µm for DivIVA-TssM and WT cells, respectively); the lower and upper boundaries of the internal box plot correspond to the 25th and 75th percentiles respectively; whiskers extend 1.5 times the interquartile range from the 25th and 75th percentiles. Outliers are shown as black dots. The number of measured sheaths (n=75) is indicated below. Statistical significance relative to WT cells is indicated above the plots (***, p < 0.001; one-tailed Wilcoxon’s t-test). (D) Fluorescence microscopy time-lapse recordings of DivIVA-TssM cells producing TssB-sfGFP highlighting polar T6SS sheath assembly (white arrowhead) and contraction (blue arrowhead). Scale bar, 2 µm.
Fig. 4. Cell width dictates T6SS sheath length. (A) Representative fluorescence micrographs of EAEC cells producing TssB-sfGFP in absence (upper panel) or in presence of the MreB inhibitor A22 (lower panel), and labelled with FM4-64 (upper panel, phase channel; lower panel, merge of GFP and FM4-64 channels). Scale bar, 2 µm. (B) Plot representation showing the relationship between sheath length and cell width in absence (blue) and presence of A22 (orange). The dashed line represents the mean of the WT cell width (mean = 0.87 µm). Value of the slope (m) is indicated on right. Kendall’s ! = 0.82. (C) Dotplot of the ratios between sheath length and the width of the corresponding cell from cells grown in absence (blue) or presence of A22 (orange). Horizontal bars represent the mean in each condition. The values of the means and standard deviations are indicated above the plots. The number of analyzed cells (n) is indicated below. (D) Representative fluorescence micrograph of EAEC cells producing TssB-CFP and YFP-TagA in presence of the MreB inhibitor A22, and labelled with FM4-64 (left panel, phase channel; right panel, merge of CFP, YFP, and FM4-64 channels). The open arrowheads point T6SS extended sheaths in contact with the TagA stopper. Scale bar, 2 µm.
A
WT/TssB-sfGFP A22/TssB-sfGFPB
sh e a th length ( μ m ) 1.5 1 2 0.5 cell width (μm) 1.5 1 2 0.5 WT WT + A22 m = 0.92 + A22 sh e a th length /ce ll width ra ti o + A22 1 0.75 1.25 0.5 WT n = 100 n = 143 WT + A22 0.85 ± 0.07 0.88 ± 0.04C
D
A22/TssB-CFP/YFP-TagASh e a th length ( μ m ) 0 5 10 15 20 g lu co se 0 2 5 10 [IPTG] (μM) p ro te in le ve ls ( fold in cre a se re la tive to g lu co se ) HcpF levels TssC6His levels TssBsfGFP levels Sheath length + A22 3 1 2
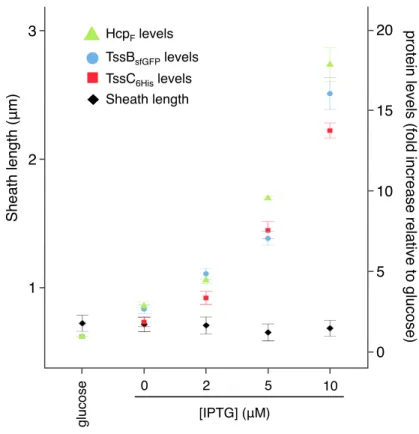
Fig. S1. T6SS tail tube/sheath subunits levels do not determine T6SS sheath length. Graph representation of the fold increase of HcpFLAG (green triangles), TssB-sfGFP (blue circles), and TssC6His (red squares) cellular levels as a function of the IPTG concentration (relative to the glucose condition) from ∆tssBC∆hcp cells bearing plasmid pTrc-BGFP-C6H-HcpF. The corresponding sheath lengths are indicated with black diamonds. The mean and standard deviations from three independent experiments are shown.