Bacterial populations concomitant with Sclerotium
rolfsii sclerotia in flooded soil, as estimated by 16S
rRNA gene, PCR-DGGE and sequence analyses
Appolinaire Adandonon*1, Noriaki Momma2, Yuko Takada Hoshino3, Tomoyuki Makino31 School of Seed and Crop Production and Management, University of Agriculture of Kétou, Republic of Benin; 08 BP 1055 Cotonou, Rep. Benin;
2 Department of Research & Development, Institute for Horticultural Plant Breeding, 2-5-1 Kamishiki, Matsudo, Chiba, Japan, 270-2221;
3Division of Environmental Biofunction, National Institute for Agro-Environmental Sciences, 3-1-3 Kannondai, Tsukuba 305-8604, Ibaraki, Japan
*1Correspondence : Tél. 0022920253331 ; email: adanappo@yahoo.fr
Original submitted in on 24th August 2015. Published online at www.m.elewa.org on 30th September 2015
http://dx.doi.org/10.4314/jab.v93i1.4
ABSTRACT
Objective: The bacterial communities concomitant with sclerotia of Sclerotium rolfsii, the causal agent of soybean stem rot, were examined by using PCR-DGGE.
Methodology and results: Fungal sclerotia were buried in soil amended with organic matter and incubated under flooded conditions for 15 or 30 days in a greenhouse and in the field. The recovered sclerotia were examined for their viability and their concomitant bacterial communities. The DGGE band patterns showed the largest bacterial diversity in samples from soil amended with rice straw or wheat bran and flooded for 30 days. In the greenhouse for instance, the diversity index from organic amendment under 30 day flooding was higher than 1.80, while for other treatments the index was less than 1.5. This trend was similar in the field experiment. There was a negative relationship between the diversity index from DGGE band patterns and sclerotial viability or disease incidence. Examination of the nucleotide sequences of the DGGE bands revealed that members of Clostridiaceae were dominant in the samples flooded for 30 days, whereas Oxalobacteraceae, Nocardiaceae, and Actinomycetaceae were major groups under unflooded conditions. Conclusion: This is the first report of the soil bacterial flora concomitant with sclerotia of S. rolfsii under flooded conditions.
Keywords: bacterial community, diversity, PCR-DGGE, Sclerotium rolfsii, sequencing, soybean INTRODUCTION
Sclerotium rolfsii Sacc. is a soil-borne plant pathogenic fungus that causes disease in more than 500 plant species throughout the world (Punja et al., 1985; Gao et al., 2015; Xu, 2009; Mehta et al., 2015). The pathogen produces numerous sclerotia that persist in soil for several years (Punja
et al., 1985), and it is able to survive in the absence of the host. The use of fungicides to control this pathogen is limited not only by the high cost but also by increasing concern for the environment. Therefore, practical methods are needed to markedly reduce S. rolfsii sclerotial
Journal of Applied Biosciences 93:8696 – 8712
viability and thus promote increases in crop yield. Some methods have been studied: for instance, flooding of sclerotium-infested fields for one month decreased not only disease incidence but also sclerotial germinability (Nakagawa et al., 1994; Tanaka et al., 1994; Sariah & Tanaka, 1995), and a reduction in sclerotial survival under flooded conditions was hypothesized to be associated with invasion and colonization by bacteria-like organisms (Tanaka et al., 1994; Hyakumachi et al., 2014). So far, the structure and succession of bacterial communities concomitant with Sclerotium rolfsii sclerotia from environment with or without flooding are not well understood. Recently, Okabe et al. (2003) plated on culture media S. rolfsii sclerotia recovered from flooded conditions and, based on the bacterial 16S rRNA gene sequences, the authors reported that about 90% of the bacteria isolates were Pantoea agglomerans. Early reports indicated that most naturally occurring bacteria are inherently difficult to isolate in pure culture (Ward et al., 1990; Ramette et al., 2006) and seem to be unculturable. Consequently, their identity remains unknown (Rotthauwe et al., 1997; Boucher et al.,
2006). Muyzer et al. (1993) suggested that molecular techniques offer opportunities for analysis of the structure and species composition of microcrobial communities from soil and sediments because such procedures promise to make available for molecular analysis the genomes of indigenous microorganisms not detectable by cultivation methods. Molecular fingerprinting methods, such as denaturing gradient gel electrophoresis (DGGE) are well established (Ikenaga et al., 2004, Muge et al., 2015) and have been used to compare microbial communities in soil (Sugano et al., 2005; Asari et al., 2007; Hoshino & Matsumoto, 2007; Matsuyama et al., 2007; Liu et al., 2015) and aquatic environments (Usup et al., 2014). By using molecular methods, the current study aimed to investigate the microbial communities’ concomitant with the sclerotia of Sclerotium rolfsii under flooded conditions. The bacterial communities were assessed by both DGGE and sequencing of PCR-amplified 16S rDNA fragments extracted from sclerotia recovered from greenhouse and field soils.
MATERIALS AND METHODS
Sclerotium rolfsii inoculum and sclerotia: Strain S-63 of S. rolfsii (MAFF 306493, NIAS Genebank; http://www.gene.affrc.go.jp/index_en.php) was subcultured on potato dextrose agar (PDA) and maintained at 4 ºC for further use. Inoculum was prepared, for soil infestation, by a wheat bran, peat moss, and water (BPW)-based method (Nakagawa et al., 1994). A beaker was filled with BPW (1:1:3, w/w/w), sterilized for 20 min at 121°C, and then inoculated with mycelial discs cut from the edge of a 5-day–old S. rolfsii colony on PDA. The inoculated BPW was covered, incubated for 14–28 days at 28°C and then used as wet inoculum without any further treatment. Sclerotia (125 mg) with size more than 1 mm diam. were collected from the pathogen culture on PDA and were placed in a polyester filter bag (about 1 mm mesh size) for burying in the soil in the greenhouse and field experiments. A string was attached to each bag for easy removal from the soil.
Greenhouse experiment: Soil samples were collected from a paddy field (NIAES, Kannondai, Tsukuba), shredded and used, without sterilization, to fill
greenhouse pots (16-cm diameter × 19.5-cm height) up to four-fifths capacity. The soil in pots was then regularly watered to keep soil wet during the experiment in the greenhouse. The top 2 cm of pot soil was infested with 500 mg of the inoculum (i.e. 1.5 mg g -1 soil). Wheat bran and rice straw (cut up) were used as organic matter and separately applied at 12 g per pot (6000 kg ha-1) to the top 10 cm of soil in each pot. Two sclerotial bags were then buried in the soil per pot at a depth of about 1 to 2 cm, and the pots were subsequently flooded. Treatments consisted of flooding soil in pot for 0, 15 or 30 days (3 treatments), and addition of wheat bran, rice straw or no organic amendment (3 treatments) for a total of 9 treatments replicated four times (36 pots). All 36 pots were inoculated while other three untreated controls consisted of uninoculated unflooded wheat bran, rice straw and no organic amendment. If needed, water was added to the flooded soil to compensate for loss by evaporation; pots were maintained in the greenhouse at 23–32 ºC and a relative humidity of 50%–76%. At the end of flooding, sclerotia bags were first removed and
water was drained from each pot. The experimental design was a randomized block with four replicates for each treatment while the whole experiment was repeated twice. When soil moisture had reached approximately field capacity after water drainage, 15 seeds of soybean (Glycine max [L.] cv. Enrei) were planted in each pot and kept in the greenhouse. The number of healthy and diseased plants was recorded 30 days after planting. Disease incidence was expressed as percentage diseased plants. To examine sclerotial viability, sclerotial bags recovered from soil were rinsed with running water. The sclerotia were soaked in 70% ethanol for 2 s and NaOCl (Cl: 0.5%) for 60 s, rinsed twice in sterile distilled water, and blotted dry on sterile filter paper. Five sclerotia were then plated on PDA, with four replicates, for a total of 20 sclerotia per treatment. After a 2-day incubation at 25°C, the number of germinated sclerotia was counted and the number of sclerotia yielding bacterial growth was also recorded. Viability was expressed as percentage of germinated sclerotia. Similarly, the percentage of sclerotia colonized by bacteria was calculated by dividing the number of sclerotia yielding bacterial growth by the total number of plated sclerotia. Field experiment: Soil was infested with the BPW-based inoculum at 250 kg ha-1. One month after incubation, soybean seeds were planted and grown for 2 months to activate the pathogen. Aerial plant parts were then cut away, and roots were plowed into the soil. Wheat bran and rice straw were separately incorporated into the soil at 6000 kg ha-1. In this field experiment, two types of sclerotia were separately bagged and buried in the soil at about 2-cm depth: 1-month-old sclerotia collected from PDA plates (hereafter “cultured sclerotia”) and sclerotia collected from diseased plants from a greenhouse (“natural sclerotia”); these natural sclerotia were collected by the sieving method (Punja et al., 1985). A plot of 3.8 m × 2.5 m was assigned to each treatment, with 1.25-m intervals between plots. Treatments included manual amendment with wheat bran, rice straw, or no organic matter and with or without 30-day flooding. Controls consisted of uninfested, unflooded plots amended with wheat bran, rice straw, or no organic matter. Flooded and unflooded plots had 4-m intervals between them. Due to shortage of field plots, there were only two replications per treatment. But the experiment was repeated the following year. At the end of flooding, water was drained from each plot. Shortly before drainage, the two types of sclerotia were recovered from soil for DNA extraction and sclerotial viability tests.
When drained soil reached approximately field capacity, soybean seeds were planted (early September) at the rate of two per hole with 20-cm intervals in each row, with an interval of 50 cm between rows. There were five rows per treatment. The number of diseased plants was recorded (of 102 plants per treatment) 30 days after planting. In the sclerotial viability test, cultured and natural sclerotia were separately plated onto two media: PDA and water agar (WA). Sclerotial plating on media, viability tests, and assessment of bacteria-colonized sclerotia were performed as described above. DGGE analysis and sequencing: A FastDNA Spin Kit for soil (Qbiogene, Inc., Irvine, CA, USA) was used according to the manufacturer’s instructions to extract bacterial 16S rDNA from 100 mg of sclerotia recovered from the soil in the greenhouse and field. The method disrupts whole tissues, lyses cells, and stabilized nucleic acid from any source, thus eliminating the need for lysing enzymes or grinding and homogenizing equipment. There were three and two replicates for each sample from the greenhouse and field, respectively. Skim milk (200 µg mg-1 sclerotia) was added to sodium phosphate buffer and served as a competitor for DNA extraction (Hoshino & Matsumoto, 2004). Bacterial 16S rDNA from sclerotia was amplified by the bacterial universal primers GC-338f (Øvreås et al., 1997; Griffiths et al., 2003) and 907r (Lane, 1991). The PCR mixture (50 µL) contained 0.3 µM each primer, 200 mM each deoxynucleoside triphosphate, 1.4 mM MgSO4,5 µL 10× PCR buffer, 1 U KOD-plus (Toyobo, Osaka, Japan), and 1 µL (around 100 ng) template DNA. The following PCR program was used: initial denaturation at 94°C for 2 min; then 30 cycles consisting of denaturation at 94°C for 15 s, annealing at 45°C for 30 s, and extension at 68°C for 30 s. PCR was conducted in a Takara PCR Thermal Cycler SP (Takara, Ohtsu, Japan). The products were then purified with a GeneClean II Kit (MP Biomedicals, Solon, OH, USA). After ethanol precipitation, the DNA concentration was determined with a spectrophotometer (Ultraspec 2000, Pharmacia Biotech, Ltd., UK). DGGE was performed by the D Code System (Bio-Rad, Japan) on the basis of the method of Muyzer et al. (1993). Two hundred nanograms of the PCR products were loaded for each sample in 8% (w/v) polyacrylamide gels (37.5:1, acrylamide:bisacrylamide) in TAE buffer. Gels had a denaturing gradient ranging from 35% to 65%. Electrophoresis was carried out at 60°C and 65 V for 18 h. Gels were then stained with SYBR Green I (FMC BioProducts, Japan) for 30 min, photographed, scanned, and analyzed with Molecular
Imager FX (Bio-Rad). Banding patterns of DGGE profiles were analyzed by the software Quantity One (ver. 4.2, Bio-Rad). The intensity and position of individual bands were normalized after background subtraction of single lanes and banding pattern digitization. Band intensity was expressed as percentage of total band intensity in one lane. Similarity dendrograms were generated by the UPGMA clustering method in Quantity One (ver. 4.2). The Shannon diversity index (H) was calculated as follows:
H = −Σ(ni/N)[log( ni/N)\] (1)
Where ni represents the intensity of band i, and N represents the total intensity of the corresponding lane. The richness, S, is the total number of different bands in the community. The evenness of the band distribution—the Shannon equitability value—was calculated by the equation E = H/log S (Shannon & Weaver, 1963; Smit et al., 2001). Characteristic bands were excised from gels. About 1 mm2 of each excised band was used as a template for PCR amplification of the DNA fragment. The primers used and the PCR program were the same as those described earlier. Band purity and mobility of the amplified bands were checked to confirm their identity to the original ones. The amplified DGGE bands were then sequenced by using primers 338f and 907r for the PCR sequencing cycle and a BigDye Terminator v3.0 Cycle Sequencing kit according to the manufacturer’s instructions (Applied Biosystems, Foster City, CA, USA). For band identification, the matches closest to the sequences of the DGGE bands were determined from the DNA data in GenBank (http://www.ncbi.nlm.nih.gov/Genbank/) by using the BLAST search program.
Analysis of soil chemical properties: Soil samples were collected in the greenhouse from each pot at three different levels from top to the bottom and then mixed. Soils in the field experiment were sampled from five points in each subplot and mixed. All samples were collected before and after flooding, air-dried at 60%
relative humidity and 25°C, and then passed through a 2-mm mesh sieve before use. The clay, silt, and sand contents of each soil, as well as the pH, organic carbon (C), nitrogen (N), and electrical conductivity (EC), were determined by following the procedures of Makino et al. (2006). The soil oxydoreduction potential (Eh) was measured by the platinum electrode method (Patrick et al., 1986) 1, 15, and 30 days after flooding.
Statistical analysis: The normalized DGGE band intensities were used for principal component analysis to determine the bands contributing the most to the variation observed (Ikenaga et al., 2004). The analysis was performed by SAS (1997). Percentage data were arcsine-square-root transformed. An analysis of variance was performed by the general linear model (GLM) procedure in SAS, and mean separations were assessed by theTukey-Kramer test option. Correlation matrix and multiple regression analyses were performed on the variables of soil chemical data, disease incidence, percentage healthy plants, DGGE band number and intensity, Shannon diversity index H, and E. The following estimated multiple regression equation was used:
ŷ = ŷo + ax1 + bx2 + cx3 + … (2)
where ŷ represents the disease incidence (or DGGE band numbers, intensities etc.); ŷo is the intercept; and a, b, and c are the increase in ŷ resulting from one unit increase of the factors x1, x2, and x3, respectively. To avoid overestimating the variable impact, the multiple coefficient of determination was adjusted and computed as follows (Anderson et al., 2003):
R2
a = 1 − (1 − R2)/(n − p −1), (3) where R2
a is the adjusted multiple coefficient of determination, R2 is the multiple coefficient of determination, n is the number of observations, and p is the number of independent variables.
RESULTS
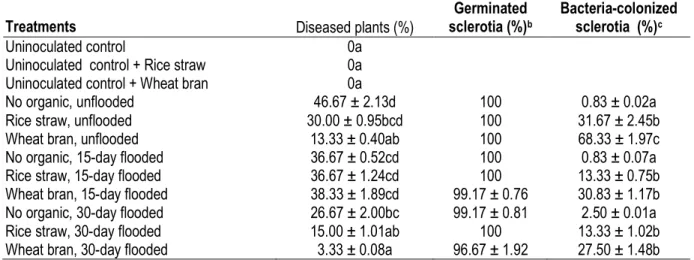
Disease incidence and sclerotial viability: In the greenhouse, the disease incidence (expressed as percentage diseased plants) recorded 10 days after planting was the significantly lowest for the 30-day flooded wheat-bran treatment (% diseased plants in controls = 0) (Table 1). No significant difference was detected between 30-day flooded wheat-bran and rice-straw treatments in terms of disease incidence
recorded 30 days after planting. Similarly, the percentage of germinated sclerotia was the lowest for the 30-day flooded wheat-bran treatment, although there were no significant differences among treatments (Table 1). Significant differences were detected, however, among treatments in terms of isolation frequency of bacteria. In all cases, bacterial colonization was the highest with the application of
wheat bran, followed by rice straw, whereas the lowest colonization rate was recorded when no organic matter
was applied (Table 1).
Table 1: Percent of diseased plants recorded 30 days after planting in the greenhousea, germinated sclerotia and bacteria-colonized sclerotia on PDA
Treatments Germinated sclerotia (%)b Bacteria-colonized sclerotia (%)c Diseased plants (%) Uninoculated control
Uninoculated control + Rice straw Uninoculated control + Wheat bran No organic, unflooded
Rice straw, unflooded Wheat bran, unflooded No organic, 15-day flooded Rice straw, 15-day flooded Wheat bran, 15-day flooded No organic, 30-day flooded Rice straw, 30-day flooded Wheat bran, 30-day flooded
0a 0a 0a 46.67 ± 2.13d 30.00 ± 0.95bcd 13.33 ± 0.40ab 36.67 ± 0.52cd 36.67 ± 1.24cd 38.33 ± 1.89cd 26.67 ± 2.00bc 15.00 ± 1.01ab 3.33 ± 0.08a 100 100 100 100 100 99.17 ± 0.76 99.17 ± 0.81 100 96.67 ± 1.92 0.83 ± 0.02a 31.67 ± 2.45b 68.33 ± 1.97c 0.83 ± 0.07a 13.33 ± 0.75b 30.83 ± 1.17b 2.50 ± 0.01a 13.33 ± 1.02b 27.50 ± 1.48b aPot soil was infested with wheat bran/peat moss/water culture of S. rolfsii to determine disease incidence, and sclerotia were
packed in bags and buried to determine their germiability and bacterial colonization. Soybean seeds were sown after treatments. Data (%) were compared after arcsine (Y 1/2) transformation and analysis done using SAS program (SAS, 1997). Values are
means ± SE, the size and number of replications were 5 and 4, respectively, for germinated sclerotia and bacteria-colonized sclerotia assessments; and 15 and 4, respectively, for diseased plant assessments. Within same columns, means followed by a common letter do not differ significantly (P ≥ 0.05) according to the General Linear Model test
bGermination of sclerotia was determined on PDA.
cFrequency of bacterial colonization on sclerotial germination on PDA. In the field experiment, percentage healthy plants recorded 30 days after planting was the highest among all 30-day flooded treatments. Similarly, the 30-day flooded wheat-bran treatment gave the lowest disease incidence, although no significant difference was found among treatments (P ≥0.05; Table 2). Viability tests of sclerotia recovered from the field and tested on PDA or WA showed that sclerotial germination tended to be
higher for culture sclerotia than for natural sclerotia. Natural sclerotia recovered from flooded treatments showed lower percentage germination than did those from unflooded conditions, regardless of the type of media. For both culture and natural sclerotia, the frequency of bacterial colonization was the highest for wheat-bran treatments, followed by rice-straw treatments (Table 2).
Table 2: Healthy plants (%) recorded 30 days after planting in the fielda, germinated sclerotia (%) and bacteria-colonized sclerotia (%) on media
Treatments
germinated sclerotia (%) b
bacteria-colonized sclerotia (%) b
cultured sclerotia natural sclerotia
cultured sclerotia
natural sclerotia Healthy
plants (%) PDAc WA PDA WA PDA PDA
Uninoculated control
Uninoculated control + rice straw Uninoculated control + wheat bran
No organic, unflooded Rice straw, unflooded Wheat bran, unflooded No organic, 30-day flooded Rice straw, 30-day flooded Wheat bran, 30-day flooded
44.61 ±2.11ab 69.61 ± 4.82bc 30.39 ± 2.70a 44.12 ± 3.40ab 46.57 ± 2.56ab 17.65 ± 1.85a 66.67 ± 2.21c 78.92 ± 2.93c 91.67 ± 4.31c 100 93.33 ± 4.76 90.00 ± 6.05 86.67 ± 4.80 80.00 ± 5.52 85.33 ± 4.56 96.67 ± 3.80b 93.33 ± 5.26b 86.67 ± 2.55ab 80.00 ± 3.12ab 76.67 ± 2.21ab 63.33 ± 4.32a 98.00 ± 4.32c 98.79 ± 2.31c 89.73 ± 3.43bc 69.67 ± 1.09ab 73.33 ± 3.25ab 60.00 ± 2.07a 92.33 ± 4.3b 90.21 ± 3.98b 80.60 ± 2.78ab 62.67 ± 2.19a 61.24 ± 2.87a 57.33 ± 3.57a 3.33 ± 0.56a 15.23 ± 1.59ab 57.00 ± 2.60c 10.00 ± 1.02a 26.67 ± 1.11ab 41.34 ± 1.83bc 5.00 ± 0.93a 26.67 ± 2.13ab 90.00 ± 4.23c 18.41 ± 2.28ab 43.64 ± 2.42b 76.67 ± 1.59c
aField soil was infested with wheat bran/peat moss/water culture of S. rolfsii to determine disease incidence. Sclerotia collected
from S. rolfsii culture on PDA (cultured sclerotia) and from diseased plants (natural sclerotia) were packed in bags and buried. Soybean seeds were sown after treatments. Data (%) were compared after arcsine (Y 1/2) transformation and analysis done
using SAS program (SAS, 1997). Values are means ± SE, the size and number of replications were 5 and 4, respectively for germinated sclerotia and bacteria-colonized sclerotia assessments; and 102 and 2 for diseased plant assessments. Within columns, means followed by a common letter do not differ significantly (P ≥ 0.05) according to the General Linear Model test.
bGermination of sclerotia and frequency of bacterial colonization on sclerotia were determined on PDA. cNo difference was detected
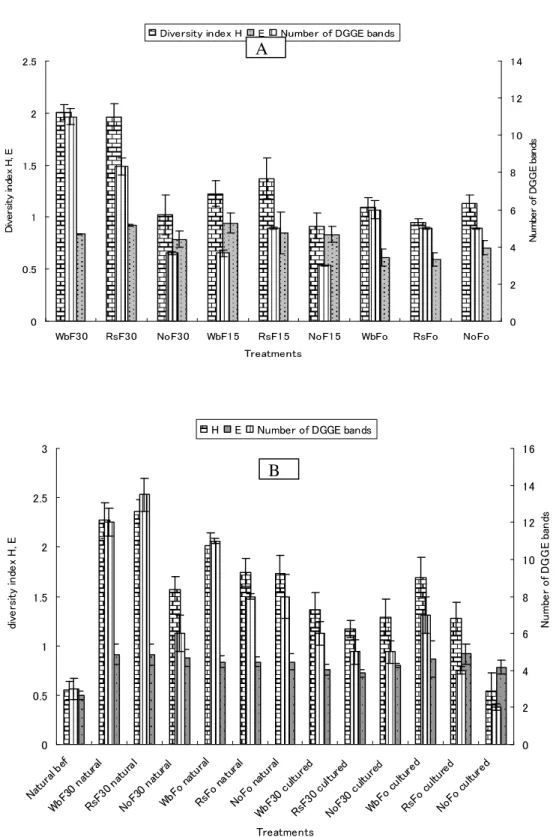
DGGE band patterns: From the greenhouse samples, DGGE patterns showed no clear differences among triplicates (Fig. 1A). All unflooded treatments tended to have similar DGGE band patterns, as did 15-day flooded treatments with faint bands, whereas 30-day flooded treatments gave DGGE band patterns that were obviously different among types of organic matter (Figs. 1A, 2A). Significant differences (P < 0.05) were also detected with a similar trend among treatments in terms of Shannon diversity index H and DGGE band numbers (Fig. 2A). However, except under unflooded conditions, all treatments had similar community evenness as expressed by Shannon equitability (E). The constructed dendrogram (Fig. 3) showed grouping of triplicates, but it first separated the treatments into two groups, with group I comprised of only 30-day
flooded treatments and group II consisting of unflooded and 15-day flooded treatments. The dendrogram next separated group I into three organic-matter–based subgroups and group II into two flooded-regime subgroups (unflooded and 15-day flooded) and further each subgroup into three organic-matter–based sub-subgroups (Fig. 2A). All unflooded treatments, irrespective of the type of organic matter, tended to have in common bands h, i, j, and k (Fig. 1A). Principal component analysis revealed bands a–f and h as dominant, with the highest eigenvalues and strongly correlated (r2 > 0.86) with the first two principal components. The result trend was similar in the second year experiment.
Fig 1-A : Greenhouse d g b k e a c h i f j 5 11 13 15 19 21 23 25 27 2 3 7 8 9 17 1 4 6 10 12 14 16 18 20 22 24 26 L Rep1 30F 15F 0F Wb Rs No Wb Rs NoWb Rs No Rep2 30F 15F 0F Wb Rs No Wb Rs No Wb Rs No Rep3 30F 15F 0F Wb Rs No Wb Rs No Wb Rs No
Fig 1-B : Field
Fig. 1. DGGE band patterns of bacterial 16S rDNA from Sclerotium rolfsii sclerotia buried in soil. In the greenhouse experiment (A), lane numbers indicate samples from soil without amendment (No) or amended with wheat bran (Wb) or rice straw (Rs), and flooded for 30 days (30F) or 15 days (15F), or unflooded (0F). There were three replicates (Rep 1, 2, 3). In the field experiment (B), sclerotia from S. rolfsii culture on PDA (cultured sclerotia) or from greenhouse-grown diseased plants (natural sclerotia) were buried in soil amended with or without organic matter, unflooded (0F), or flooded for 30 days (30F). There were two replicates. B1 and B2 indicate samples from natural sclerotia before burial in the soil, L represents the ladder marker. Letters in the image indicate bands detectable by UV light and cut for sequencing and bacterial identification.
f a b c g k h j i d e m l n 5 9 11 13 15 17 19 21 23 1 L 2 3 4 6 7 8 10 12 14 16 18 20 22 24 25 26 Rep1 Rep2 Unflooded Wb Rs No Wb Rs No 30-day Flooded Wb Rs No Wb Rs No Rep1 Rep2 Natural sclerotia Rep1 Rep2 Unflooded Wb Rs No Wb Rs No 30-day Flooded Wb Rs No Wb Rs No Rep1 Rep2 Cultured sclerotia B1 B2
0 0.5 1 1.5 2 2.5
WbF30 RsF30 NoF30 WbF15 RsF15 NoF15 WbFo RsFo NoFo
Treatments D ive rs ity in de x H , E 0 2 4 6 8 10 12 14 N um be r o f D G G E ba nd s Diversity index H E Number of DGGE bands
0 0.5 1 1.5 2 2.5 3 Natur al bef WbF3 0 natu ral RsF3 0 natu ral NoF3 0 natu ral WbFo natu ral RsFo natur al NoFo natur al WbF3 0 cult ured RsF3 0 cult ured NoF3 0 cult ured WbFo cultu red RsFo cultu red NoFo cultu red Treatments div er sit y in de x H, E 0 2 4 6 8 10 12 14 16 Nu m be r o f D G G E ba nd s H E Number of DGGE bands
Fig. 2. Shannon’s diversity index (H), equitability (E), and number of DGGE bands of bacterial 16S rDNA from greenhouse (A) and field (B) samples. Wb: wheat bran; Rs: rice straw; No: no organic matter; F0, F15, and F30: no flooding, 15-day flooding, and 30-day flooding, respectively. In (B), bacterial 16S rDNA was extracted from two types of sclerotia: sclerotia from Sclerotium rolfsii cultured on PDA (cultured sclerotia) or sclerotia from greenhouse-grown diseased plants (natural sclerotia). The sclerotia were buried in soil with or without 30-day flooding. “Natural” and “cultured” refer to bacterial 16S rDNA samples from natural and cultured sclerotia, respectively; “natural bef” refers to samples from natural sclerotia before burial in the soil.
B A
The DGGE band patterns from field samples (Fig. 1B) were similar between duplicates, whereas differences in the DGGE band patterns were found among treatments (Figs. 1B, 2B). The DGGE band number and diversity index H from flooded wheat-bran and rice-straw samples were the highest among the treatments. This trend was similar for both sclerotial types, although values were the lowest for samples from cultured sclerotia. However, no significant difference was observed among treatments in terms of the Shannon
equitability, E(Fig. 2B). The constructed dendrogram discriminated treatments and separated organic matter types as well as flooded from unflooded and natural from cultured sclerotial types (Fig. 4). The principal component analysis showed bands a–h, j, and k to be dominant, with the highest eigenvalues and a high level of correlation (r2 > 0.89) with the first three principal components. The result trend was similar in the second year experiment.
Figure 3: Cluster analysis of DGGE profiles obtained from bacterial 16S rDNA extracted from sclerotia recovered from soil in different treatments in the greenhouse. The dendrogram was generated on the basis of the squared Euclidean distance with the clustering algorithm UPGMA. There were 0-, 15-, or 30-day flooding regimes with three replicates. Numbers indicate samples from treatments with: wheat bran (Wb) added and flooded for 30 days (1, 10, 19) or 15 days (4, 13, 22), or unflooded (7, 16, 25); rice straw (Rs) added and flooded for 30 days (2, 11, 20) or 15 days (5, 14, 23), or unflooded (8, 17, 26); no organic matter (No) added and flooded for 30 days (3, 12, 21) or 15 days (6, 15, 24), or unflooded (9, 18, 27). The dendrogram distinguished 30-day flooded (I) from unflooded or 15 day-flooded samples (II).
30-day Flooded No Wb Rs Rs No Wb No Wb No No Wb 15-day Flooded None Flooded I II
Figure 4: Cluster analysis of DGGE profiles obtained from bacterial 16S rDNA extracted from sclerotia recovered from soil with different treatments in the field. The dendrogram was generated on the basis of the squared Euclidean distance with the clustering algorithm UPGMA. Sclerotia from Sclerotium rolfsii cultured on PDA (cultured sclerotia) or from greenhouse-grown diseased plants (natural sclerotia) were buried in soil without amendment (No) or amended with wheat bran (Wb) or rice straw (Rs) and either unflooded or flooded for 30 days. In the figure, “natural” and “cultured” refers to natural and cultured sclerotia, respectively. There were two replicates.
Sequence analysis and identification of DGGE bands: The recorded sequences were deposited in the GenBank database under accession numbers EF566985–EF567017. The closest matches to the respective DGGE bands, with high identification scores on the basis of 16S rDNA sequence analysis, are listed in Table 3. In unflooded conditions in both the greenhouse and field, bacterial groups were mostly Oxalobacteraceae (Betaproteobacteria), Actinomycetaceae, and Nocardiaceae (Actinobacteria), whereas in flooded conditions members of Clostridiaceae were dominant.
Soil analysis: Sand, silt, and clay contents of soil used in the greenhouse were 31.39%, 44.30%, and 24.31%, respectively (Table 4). The soil redox potential Eh
values were negative from 15 days after flooding for all flooded treatments. The Eh value for wheat-bran treatment decreased quickly and was the lowest: approximately – 200 mV at the end of the 30-day flooding (Table 4). The values of other chemical components in the soil from each treatment before or after flooding did not indicate any significant differences among treatments in either the greenhouse or field (data not shown). However, the EC values were the highest for 30-day–flooded wheat-bran and/or rice-straw treatments (Table 4), and the equation ŷ = −598.002 + 11.24951x (where ŷ was the DGGE band intensity and x the EC) was significant (P < 0.05) with R2 a = 0.8442. Rs cultured Unflooded Wb cultured Wb natural Rs natural Wb natural Rs natural 30-day flooded 30-day Flooded No natural Wb cultured No cultured Rs cultured No cultured No natural Natural sclerotia before flooding Unflooded
Table 3: Assignment of taxonomic groups to band sequences extracted from DGGE gel from greenhouse and field samples and the closest sequence match of known phylogenetic affiliation
Banda
Origin (GenBank accession number of sequences from this study)b
Affiliation following BLAST search against the GenBank database (and
accession number of BLAST match)c Class/Group
Greenhouse samples h i j k a, b c d e, f g
NoF0 (500EF566985); RsFo (480EF566986); WbF0
(510EF566987)
NoF0 (500EF566988)
NoF0 (505EF566989); WbFo (505EF56699099)
NoF0 (520EF566991); WbFo (510EF566992)
WbF30 (508EF566993); (500EF566994)
WbF30 (485EF566995)
RsF30 (513EF566996); WbF30 (512EF566997)
WbF30 (520EF566998), (517EF566999) WbF30 (525EF567000)
Pseudomonas mephitica (AB021388)99;Janthinobacterium lividum
(AF174648)99; J. agaricidamnosum (Y08845)99
Rhodococcus boritolerans (AB288061)99;
R. erythropolis (DQ858961)99; Nocardiaceae bacterium (EF028121)99
Clostridium beijerinckii (X68180)99
C. saccharoperbutylacetonicum (U16122)99
C. saccharobutylicum (U16147)98
C. sporogenes (AY442816)90; C. botulinum (AF105402)90
C. leptum (AJ305238)92 C. aurantibutyricum (X68183)96 Betaproteobacteria Actinobacteria Firmicutes Firmicutes Firmicutes Field samples k l m n a, b c d e (f) g h i j RsF0 (490EF567001) WbF0 (500EF567002) NoF0 (483EF567003) WbF0 (510EF567004) RsF30 (487EF567005), (500EF567006) RsF30 (510EF567007); WbF30 (485EF567008) WbF30 (485EF567009) RsF30 (495EF567010) WbF30 (520EF567011) RsF30 (485EF567012); WbF30 (515EF567013) RsF30 (510EF567014); WbF30 (500EF567015) RsF30 (520EF567016) WbF30 (520EF567017)
P. mephitica (AB021388)99;J. lividum (AF174648)99;
J. agaricidamnosum (Y08845)99
R. boritolerans (AB288061)99;R. erythropolis (DQ858961)99; N. bacterium
(EF028121)99
C. saccharoperbutylacetonicum (U16122)99;
C. beijerinckii (X68180)98; C. saccharobutylicum (U16147)98
C. sporogenes (AY442816)90; C. botulinum (AF105402)90
C. leptum (AJ305238)92 C. aurantibutyricum (X68183)96 Betaproteobacteria Actinobacteria Firmicutes Firmicutes Firmicutes Firmicutes
aBacterial 16S rDNA was extracted from sclerotia buried in soil amended with rice straw (Rs), wheat bran (Wb) or no organic matter (No) and incubated without (Fo) or with
30-day (F30) flooding in the greenhouse and field. Letters in bracket represent DGGE band position.
bThe superscript number before the accession number is the alignment length (bp) of the studied sequence with the Genbank sequences. cThe subscript number after the Genbank accession number is the percentage similarity with the identified sequences in this study.
Table 4 : Soil chemical characteristics before and after flooding in the greenhouse and fielda
Redox potential Eh (mV)b,c Electrical conductivity (µS m-1)c
Treatments 1 DAF 15 DAF 30 DAF before after
Greenhouse experiment
Uninoculated control
Uninoculated control + Rice straw Uninoculated control + Wheat bran No organic, unflooded
Rice straw, unflooded Wheat bran, unflooded No organic, 15-day flooded Rice straw, 15-day flooded Wheat bran, 15-day flooded No organic, 30-day flooded Rice straw, 30-day flooded Wheat bran, 30-day flooded
520.0 ± 9.3 454.0 ± 15.2 421.0 ± 6.9 437.0 ± 11.2 341.5 ± 6.7 -233.0 ± 9.4 288.5 ± 10.4 -132.0 ± 3.2 -215.5 ± 15.5 -42.0 ± 2.5 -99.5 ± 13.4 -208.0 ± 9.7 -106.0 ± 9.2 -124.0 ± 13.6 -201.0 ± 12.5 84.83 ± 3.23 141.80 ± 1.42 140.05 ± 3.02 117.15 ± 2.91 107.85 ± 5.90 167.25 ± 2.43 130.05 ± 2.67 98.60 ± 3.16 98.35 ± 1.50 106.20 ± 1.94 162.25 ± 2.01 140.85 ± 1.83 158.10 ±4.32 130.20 ± 2.86 296.50 ± 3.64 134.90 ± 2.00 127.45 ± 3.23 235.50 ± 2.78 91.70 ± 8.54 82.15 ± 2.25 101.25 ± 3.2 95.30 ± 1.64 89.10 ± 1.43 128.00 ± 6.94 Field experiment Uninoculated control
Uninoculated control + Rice straw Uninoculated control + Wheat bran No organic, unflooded
Rice straw, unflooded Wheat bran, unflooded No organic, 30-day flooded Rice straw, 30-day flooded Wheat bran, 30-day flooded
104.7 ± 12.3 68.7 ± 9.5 -0.3 ± 0.1 -142.0 ± 14.2 -166.5 ± 8.5 -192.5 ± 13.3 -130.2 ± 4.3 -180.5 ± 7.6 -195.7 ± 11.7 51.25 ± 5.93 50.60 ± 2.34 44.35 ± 1.65 34.45 ± 2.13 49.75 ± 7.78 29.80 ± 1.05 27.35 ± 2.11 38.30 ± 1.54 35.10 ± 2.47 55.45 ± 2.13 93.10 ± 4.25 126.70 ± 3.69 46.30 ± 2.56 64.55 ± 2.54 96.80 ± 6.98 80.00 ± 3.23 194.50 ± 3.42 202.50 ± 4.67 aSoil samples were collected from the greenhouse and field before and after flooding of the soil amended with organic matter. bDAF stands for days after flooding cValues are
DISCUSSION
Several morphological, biological, and genetic characteristics have been used to study the constituents of complex microbial populations in natural environments (Muyzer et al., 1993). Denaturing Gradient Gel Electrophoresis is a recent molecular fingerprinting methods well established (Ikenaga et al., 2004, Muge et al., 2015) actually used to compare microbial communities in soil (Hoshino & Matsumoto, 2007; Matsuyama et al., 2007; Usup et al., 2014; Liu et al., 2015). Here, DGGE band patterns and sequence analysis of 16S rDNA obtained after PCR amplification of bacterial DNA extracted from sclerotia were used to assess the effect of flooded, organic-matter–amended soil on bacterial community diversity and identity. Regression analysis was performed to determine any relationship among diseased soybean plants, soil chemical data, and DGGE band profile data. DGGE band patterns were similar among treatments when soil was not flooded, with or without organic matter amendment. This was the case in both the greenhouse and field experiments. This result might indicate that rice straw or wheat bran incorporated into the soil without flooding did not have any effects (within 1 month) on the total bacterial community that could be detected by DNA-based DGGE patterns. However, differences were detectable among unflooded treatments in terms of the proportion of bacteria-colonized sclerotia in culture; wheat-bran treatments consistently gave significantly higher values than those with no organic matter application. The cluster analysis of the DGGE patterns from greenhouse samples separated flooded treatments from their unflooded controls and amendments with organic matter from their untreated controls. Significant differences among these treatments in terms of number and intensity of DGGE bands and Shannon diversity index H supported this discrimination, and the results were similar to those of the field experiments. Although Okabe et al. (2003) reported the presence of Pantoea agglomerans from sclerotia in culture, in the current study this bacterial species was not recorded (see BLAST results in Table 3), probably because this species was present in DGGE gel with faint bands which could not be viewed and cut under UV light. Sequence data analysis showed that the bacterial clones from sclerotia samples from flooded conditions were dominated by clostridial groups, which are anaerobic bacteria (Liesack et al., 2000; Noll et al., 2005: Kim and Liesack, 2015) also reported from soil samples under flooded conditions in early research work (Momma et al., 2007). On the other
hand, all clones from the unflooded conditions belonged to Betaproteobacteria and Actinobacteria. Okabe et al. (2000) also found a significant difference in the community structures of the microbiota between samples from floodwater and those from plow-layer soil in another paddy field. Lüdemann et al. (2000) reported that the dominant populations in the oxic zone were members of the Betaproteobacteria and Alphaproteobacteria, whereas in the anoxic zone members of clostridial cluster I (Collins et al., 1994, Kim and Liesack, 2015) were most abundant. Lüdemann et al. (2000) concluded that culture-independent analysis of soil cores representative of the different oxygen zones revealed a shift in the bacterial community composition in response to the oxygen gradient. Other reports indicated that members of clostridial cluster I utilize a broad spectrum of poly- and monosaccharides and belong to the dominant populations colonizing and degrading rice straw in anaerobic paddy soils (Liesack et al., 2000; Weber et al., 2001; Noll et al., 2005; Kim and Liesack, 2015). In the current study, where Clostridia were the dominant bacteria groups concomitant with sclerotia under flooding, there might also have been a shift in the bacterial community composition to anaerobic bacteria. The percentage germination of soil-recovered sclerotia was the lowest when the sclerotia were recovered from flooded rice-straw- or wheat-bran-amended treatments, which also gave large DGGE band numbers, high bacterial diversity, and low disease incidence. These findings suggest that sclerotia were more debilitated under these conditions and that their debilitation was associated with clostridial bacteria. Thus, it appears that soil bacterial communities, especially anaerobes, negatively influenced the germination of the S. rolfsii propagules, as reported previously for another fungal pathogen (Momma et al., 2005). Other researchers reported that the types of organic matter in soil affect bacterial diversity (Blackwood & Paul, 2003), which is also influenced by various soil physiochemical factors (Pansou & Gantheyrou, 2006). Blackwood & Paul (2003) indicated that, under flooded conditions, the soil resembles an anaerobic freshwater habitat, where the main pathways for mineralization of organic matter depend on the operation of denitrification, ferric iron reduction, sulfate reduction, or methanogenesis. In the current study, negative oxydoreduction potential (Eh) and higher EC values were recorded under 30-day– flooded organic-matter–amended soil conditions, and wheat-bran treatments resulted in the lowest Eh. Wheat
bran was especially effective at lowering the soil reduction potential, because it contains a higher proportion of easily decomposable organic matter than does rice straw. The recorded predominant bacterial communities under these conditions were more diverse. Thus, 30-day flooding led to the soil reduction that constitutes a favorable anaerobic environment for clostridial groups. These results are consistent with those reported by Pansou and Gantheyrou (2006),Noll et al. (2005) and Kim and Liesack (2015). Crop management practices, including application of organic matter (Mazzola, 2004; Blum & Rodriguez-Kabana, 2004) and flooding, were reported to influence the ecological processes that affect microbial communities involved in the suppression of soil-borne plant pathogens and improvement of plant health (Mazzola, 2004; Momma et al., 2007). The results in the current study are consistent with this conclusion: application of wheat bran and rice straw under 30-day flooding led to high diversity in the bacterial community, dominated by clostridial groups, and resulted in reduction of the disease incidence caused by the pathogen. Thus, debilitation of sclerotia under flooding might be associated with the presence of this large number of clostridial bacteria, which would negatively influence
the survival of the pathogen sclerotia and thus improve plant health. Clostridia reportedly play a major role in biological soil disinfestations consisting of flooding and wheat-bran amendment (Momma et al., 2007). Under aerobic (culturing) conditions the growth of Clostridium spp. might be suppressed, as indicated by the observed sclerotial germination on media in the current study. Thus, it seems that Clostridium spp. do not kill pathogenic sclerotia under fungistatic conditions, but instead suppress the activities of the pathogen. The current results provide insight into the bacterial community that colonizes the sclerotia of S. rolfsii in organic-matter–amended soil under flooding. This is the first report identifying the bacterial species and community diversity under these conditions. Further research will focus on how bacterial species contribute to the fungistasis that leads to disease suppression. Furthermore, because RNA-based analyses show a more drastic temporal change than did DNA-based analyses (Noll et al., 2005; Hoshino & Matsumoto, 2007), further RNA-based analyses will be conducted for a better understanding of the bacterial community structure concomitant with sclerotia in flooded organic-matter–amended soils.
ACKNOWLEDGEMENTS
We are grateful to the Japanese Society for the Promotion of Sciences (JSPS) for the JSPS fellowship and the Grant-in-Aid for financial support of this research in Japan. Thanks are also due to Dr Okabe Ikubo and Dr Matsumoto Naoyuki, National Institute for Agro-Environmental Sciences, for their collaboration
and valuable exchanges on the subject. We also thank Dr. A. Nakagawa, National Agriculture and Food Research Organization, Tsukuba, Japan, for valuable advice, and to the National Institute for Agro-Environmental Sciences for hosting the research.
REFERENCES
Anderson DR, Sweeney DJ and Williams TA, 2003. Modern Business Statistics with Microsoft Excel. South-Western, Cincinnati, OH, 976 pp. Asari N, Ishihara R, Nakajima Y, Kimura M and Asakawa S, 2007. Succession and phylogenetic composition of eubacterial communities in rice straw during decomposition on the surface of paddy field soil. Soil Science and Plant Nutrition 53, 56-65. Blackwood CB and Paul EA, 2003. Eubacterial
community structure and population size within the soil light fraction, rhizosphere, and heavy fraction of several agricultural systems. Soil Biology & Biochemistry 35, 1245-1255. Blum LEB and Rodriguez-Kabana R, 2004. Effect of
organic amendments on sclerotial germination,
mycelium growth, and Sclerotium rolfsii– induced diseases. Fitopatologia Brasileira 29, 66-74.
Boucher D, Jardillier L and Debroas D, 2006. Succession of bacterial community composition over two consecutive years in two aquatic systems: a natural lake and a lake-reservoir. FEMS Microbiology Ecology 55, 79-97.
Collins MD, Lawson PA, Willems A, Cordoba JJ, Fernandez-Garayzabal J and Garcia P, 1994. The phylogeny of the genus Clostridium: proposal of five new genera and eleven new species combinations. International Journal of Systematic Bacteriology 44, 812-826.
Gao Y-H, Miao W, Guo R-J, Li S-D, 2015. Real time PCR quantification of Sclerotium rolfsii in chilli tissue and soil. Plant Protection Science 51, 61–66.
Griffiths RI, Whiteley AS, O’Donnell AG and Bailey MJ, 2003. Physiological and community responses of established grassland bacterial populations to water stress. Applied and Environmental Microbiology 69, 6961-6968.
Hoshino TY and Matsumoto N, 2004. An improved extraction method using skim milk from soils that strongly adsorb DNA. Microbes and Environments 19, 13-19.
Hoshino YT and Matsumoto N, 2007. DNA- versus RNA-based denaturing gradient gel electrophoresis profiles of a bacterial community during replenishment after soil fumigation. Soil Biology and Biochemistry 39, 434-444.
Hyakumachi M, Mondal SN, Elsharkawy MM, Hassan N. 2014. Carbon loss b y s c ler ot ia of Sclerotium rolfsii under the influence of soil pH, temperature and matric potential and i t s ef f e ct on sclerotial germination and virulence. Applied Soil Ecology 77, 34-41. Ikenaga I, Asakawa S, Muraoka Y and Kimura M, 2004.
Methanogenic archaeal communities in rice roots grown in flooded soil pots: estimation by PCR-DGGE and sequence analyses. Soil Science and Plant Nutrition 50, 701-711. Kim Y and Liesack W, 2015. Differential assemblage of
functional units in paddy soil microbiomes. Plos One, 10, 1-20
Lane DJ, 1991. 16S/23S rRNA sequencing. In: Stackebrandt, E., Goodfellow, M. (Ed.), Nucleic Acid Techniques in Bacterial Systematics. Wiley, New York, pp. 115-175. Liesack W, Schnell S and Revsbech NP, 2000.
Microbiology of flooded rice paddies. FEMS Microbiology Reviews 24, 625-645.
Liu Q, Tang J, Bai Z, Hecker M and Giesy JP. 2015. Distribution of petroleum degrading genes and factor analysis of petroleum contaminated soil from the Dagang Oilfield, China. Scientific Reporter 5, 1-12
Lüdemann H, Arth I and Liesack W, 2000. Spatial changes in the bacterial community structure along a vertical oxygen gradient in flooded paddy soil cores. Applied and Environmental Microbiology 66, 754-762.
Makino T, Sugahara K, Sakurai Y, Takano H, Kamiya T, Sasaki K, Itou T and Sekiya N, 2006. Remediation of cadmium contamination in paddy soils by washing with chemicals: selection of washing chemicals. Environmental Pollution 144, 2-10.
Matsuyama T, Nakajima Y, Matsuya K, Ikenaga M, Asakawa S and Kimura M, 2007. Bacterial community in plant residues in a Japanese paddy field estimated by RFLP and DGGE analyses. Soil Biology and Biochemistry 39, 463-472.
Mazzola M, 2004. Assessment and management of soil microbial community structure for disease suppression. Annual Review of Phytopathology 42, 35-59.
Mehta YR, Marangoni MS, Bocatti CR, Heliosa P, Rodrigues T, Cunha S and Galbieri R, 2015. Systemic Acquired Resistance of Cotton, Soybean and Common Bean to Rhizoctonia solani and Sclerotium rolfsii Induced by Shale Water Seed Treatment. American Journal of Plant Sciences 6, 1493-1500.
Momma N, Usami T and Shishido M, 2007. Detection of Clostridium sp. inducing biological soil disinfestation (BSD) and suppression of pathogens causing fusarium wilt and bacterial wilt of tomato by gases evolved during BSD. Soil Microorganisms 61, 3-9.
Momma N, Usami T, Amemiya Y, Shishido M, 2005. Factors involved in the suppression of Fusarium oxysporum f. sp. lycopersici by soil reduction. Soil Microorganisms 59, 27-33. Muge S, Liang H, Zhang C, Shao C, Peng X, Liang L,
Su J and Li C, 2015. A DGGE Marker-Mediated Fast Monitoring of Bacterial Diversity and Comprehensive Identification of High-Temperature Daqu Starter. Journal of Food Science 80: 1519–1525
Muyzer G, De Waal EC, Uitterlinden AG, 1993. Profiling of complex microbial populations by denaturing gradient gel electrophoresis analysis of polymerase chain reaction-amplified genes coding for 16S rRNA. Applied and Environmental Microbiology 59, 695-700. Nakagawa A, Takahashi S, Suzuki M, Sato M, 1994.
Control of southern blight and black root rot of soybean by incorporation of organic matter under flooded soil condition. 2. Annal of Phytopathological Society of Japan 60, 789.
Noll M, Matthies D, Frenzel P, Derakshani M and Liesack W, 2005. Succession of bacterial community structure and diversity in a paddy soil oxygen gradient. Environmental Microbiology 7, 382-395.
Okabe A, Toyota K and Kimura M, 2000. Seasonal variations of phospholipid fatty acid composition in the floodwater of a Japanese paddy field under a long-term fertilizer trial. Soil Science and Plant Nutrition 46, 177-188. Okabe I, Hoshino YT and Matsumoto N, 2003.
Classification of bacteria isolated from sclerotia of Sclerotium rolfsii by 16S rDNA sequences. Soil Microorganisms 57, 143. Øvreås L, Forney L, Daae FL and Torsvik V, 1997.
Distribution of bacterioplankton in meromictic Lake Saelenvannet, as determined by denaturing gradient gel electrophoresis of PCR-amplified gene fragments coding for 16S rRNA. Applied and Environmental Microbiology 63, 3367-3373.
Pansou M and Gantheyrou J, 2006. Handbook of Soil Analysis: Mineralogical, Organic and Inorganic Methods. Springer-Verlag, Berlin, 993 pp. Patrick WH, Gambrell RP and Faulkner SP, 1986.
Redox measurements of soils. In: Bigham, J. (Ed.), Methods of Soil Analysis, Part 3, Chemical Methods. Soil Science Society of America Inc., Madison, WI, pp. 1255-1273. Punja ZK, Smith VL, Campbell CL and Djenkins SF,
1985. Sampling and extraction procedures to estimate numbers, spatial pattern, and temporal distribution of sclerotia of Sclerotium rolfsii in soil. Plant Disease 69, 469-474. Ramette A, Moenne-Loccoz Y and Défago G, 2006.
Genetic diversity and biocontrol potential of fluorescent pseudomonads producing phloroglucinols and hydrogen cyanide from Swiss soils naturally suppressive or conducive to Thielaviopsis basicola-mediated black root rot of tobacco. FEMS Microbiology Ecology 55, 369-381.
Rodriguez-Kabana R, Beute MK and Backman PA, 1980. A method for estimating numbers of viable sclerotia of Sclerotium rolfsii in soil. Phytopathology 70, 917-919.
Rotthauwe J-H, Witzel K-P and Liesack W, 1997. The ammonia monooxygenase structural gene amoA as a functional marker: Molecular fine-scale analysis of natural ammonia-oxidizing
populations. Applied and Environmental Microbiology 63, 4704-4712.
Sariah M and Tanaka K, 1995. Effect of flooding on the viability and pathogenicity of sclerotia of Sclerotium rolfsii in Malaysian soil. International Journal of Pest Management 41, 97-99.
Shannon CE and Weaver W, 1963. The Mathematical Theory of Community. University of Illinois Press, Urbana, Illinois, 144 pp.
Smit E, Leeflang P, Gommans S, van den Broek J, van Mil S and Wernars K, 2001. Diversity and seasonal fluctuations of the dominant members of the bacterial soil community in a wheat field as determined by cultivation and molecular methods. Applied and Environmental Microbiology 67, 2284-2291. Sugano A, Tsuchimoto H, Tun CC, Asakawa S and
Kimura M, 2005. Succession and phylogenetic profile of eubacterial communities in rice straw incorporated into a rice field: estimation by PCR-DGGE analysis. Soil Science and Plant Nutrition 51, 51-60.
Tanaka K, Mizokami H, Motomura T and Inada M, 1994. Effect of soil submerging on the sclerotial survival of Sclerotium rolfsii. Bulletin of the Faculty of Agriculture, Saga University 76, 87-93.
Usup G, Ahmad A, and Jin LS, 2014. Evaluation of Denaturing Gradient Gel Electrophoresis (DGGE) for the Determination of Marine Phytoplankton. Biosciences Biotechnology Research Asia, 11, 379-389
Ward DM, Weller R and Bateson MM, 1990. 16S rRNA sequences reveal numerous uncultured microorganisms in a natural community. Nature 345, 63-65.
Weber S, Stubner S and Conrad R, 2001. Bacterial populations colonizing and degrading rice straw in anoxic paddy soil. Applied and Environmental Microbiology 67, 1318-1327. Xu YH 2009. Occurrence and integrated management
of chilli root rot caused by Sclerotium rolfsii. Plant Doctor 22, 19–20.