Publisher’s version / Version de l'éditeur:
Technical Report, 1999-07
READ THESE TERMS AND CONDITIONS CAREFULLY BEFORE USING THIS WEBSITE.
https://nrc-publications.canada.ca/eng/copyright
Vous avez des questions? Nous pouvons vous aider. Pour communiquer directement avec un auteur, consultez la première page de la revue dans laquelle son article a été publié afin de trouver ses coordonnées. Si vous n’arrivez pas à les repérer, communiquez avec nous à [email protected].
Questions? Contact the NRC Publications Archive team at
[email protected]. If you wish to email the authors directly, please see the first page of the publication for their contact information.
For the publisher’s version, please access the DOI link below./ Pour consulter la version de l’éditeur, utilisez le lien DOI ci-dessous.
https://doi.org/10.4224/12328121
Access and use of this website and the material on it are subject to the Terms and Conditions set forth at Iceberg visualization database
Barker, Anne; Skabova, Ivana; Timco, Garry
https://publications-cnrc.canada.ca/fra/droits
L’accès à ce site Web et l’utilisation de son contenu sont assujettis aux conditions présentées dans le site LISEZ CES CONDITIONS ATTENTIVEMENT AVANT D’UTILISER CE SITE WEB.
NRC Publications Record / Notice d'Archives des publications de CNRC:
https://nrc-publications.canada.ca/eng/view/object/?id=9916e2db-fc14-4fc8-ab0e-95c86c228e5e https://publications-cnrc.canada.ca/fra/voir/objet/?id=9916e2db-fc14-4fc8-ab0e-95c86c228e5e
A. Barker, I. Skabova and G. Timco
Technical Report HYD-TR-042
PERD/CHC Report 20-44
Canadian Hydraulics Centre National Research Council of Canada
Ottawa, Ont. K1A 0R6 Canada
Technical Report HYD-TR-042 PERD/CHC Report 20-44
ABSTRACT
This report describes the 3-dimensional visualization of icebergs in the Grand Banks region of Canada. Seventy-nine icebergs have been animated to provide an informative view of actual icebergs showing keels, sails and complete icebergs. The data for the visualization was obtained from the Canatec (1999) iceberg shape database. The data is presented in an Access database. This report describes the visualization procedure and discusses the problems and limitations of 3D visualization of complex shapes. It also presents a users-guide to the visualization database.
TABLE OF CONTENTS
ABSTRACT ... i TABLE OF CONTENTS ... ii LIST OF FIGURES... ii LIST OF TABLES... ii 1. INTRODUCTION ...1 2. VISUALIZATION ...2 2.1 Data Sources...22.2 Visualization with Mathematica/Dynamic Visualizer ...2
2.3 Image Output...3
2.3.1 Manipulating Images ...3
2.3.2 Final Data Images ...4
3. DESCRIPTION OF ICEBERG VISUALIZATION DATABASE ...8
3.1 Introduction...8
3.2 Data Structure ...8
3.2.1 Tables in database ...8
3.2.2 Forms in database ...10
4. USING THE DATABASE ...11
5. SUMMARY...14
6. REFERENCES ...15
LIST OF FIGURES
Figure 2-1 Graphics output ...3Figure 2-2 The first frame of an iceberg animation...4
Figure 2-3 Sketch of non-convex surface of an iceberg keel...5
Figure 2-4 Convex and non-convex polygon diagrams ...6
Figure 2-5 Picture depicting triangulation problems for an iceberg keel ...6
Figure 3-1 Database Relationships ...10
Figure 4-1 Database Introduction Window ...11
Figure 4-2 Iceberg Characteristics form ...12
Figure 4-3 Reports form ...13
LIST OF TABLES
Table 3-1: Database Tables...9Iceberg Visualization Database
1. INTRODUCTION
Canatec (1999) recently produced a comprehensive database that integrated three-dimensional shape and geometry for icebergs observed on the Grand Banks of Canada. The information was derived from iceberg projects conducted on behalf of Industry and Government over the past 20 years. The database development was carried out for the Program on Energy Research and Development (PERD) and was managed by the Canadian Hydraulics Centre (CHC) of the National Research Council of Canada (NRC) in Ottawa.
The Canatec database and its accompanying report (Canatec 1999) contains a wide variety of information including sources of data and measurement techniques, as well as the profiled data presented in both tabular and single-image format. Data from 872 bergs are presented in the database. Of these, 79 have information that gives a 3-dimensional representation of the iceberg. This 3-D information is presented as a series of x-,y-,z- co-ordinates in the Canatec database.
This 3-dimensional data is very useful, but it is difficult to use and visualize in a tabular format. Since the Canadian Hydraulics Centre of NRC has considerable expertise in data visualization, a project was established for the 3-D data. Mathematica was used as the means for generating the visualization of the icebergs. It allows one to conveniently look at the iceberg from a number of different views.
This report describes the process used to visualize the 3-D iceberg data, and describes a simple database developed by the CHC that can be used to observe the visualization of each iceberg.
2. VISUALIZATION
2.1 Data Sources
From the original Canatec database, only the records that contained 3-dimensional data, in the form of x-y-z- co-ordinate data, could be used. Seventy-nine records were of this form. The data contained in the records were exported in a Microsoft Excel format. Once the data had been brought into Excel, each report was altered to remove text from the record, in order to make it easier to import into the visualization software. These files then contained only the x-y-z-data in table form. A new tab-delimited text file was created for each record. The name given to the new file was identical to the record name, in order to facilitate comparisons with the Canatec database.
2.2 Visualization with Mathematica/Dynamic Visualizer
The visualization software chosen for the task of representing the icebergs as 3D objects was Mathematica 4.0, a technical software package developed by Wolfram Research (Wolfram, 1999). This commercially available, mathematics-based package allows complex data manipulation without having to develop many lines of code.
The software package used to create the animations of the icebergs was Dynamic Visualizer, developed by Milo Hedge Inc. and released by Wolfram Research. Dynamic Visualizer allows real-time, 3-dimensional viewing of objects created with Mathematica. This package can display, animate and change the lighting and colouring properties of an object within an interactive window.
These two software packages can quickly process a large number of files once a notebook has been set up for the particular application. They also have sophisticated colouring and lighting options in order to create realistic-looking 3-dimensional surfaces. Pictures and animations can then be easily exported into standard formats that do not require either Mathematica or Dynamic Visualizer to view them.
The main disadvantage of using these packages is that initial set-up of the program may take a relatively long time until satisfactory colour and lighting properties are obtained. Another problem concerns the mathematical representation of certain types of data, where it becomes necessary to manipulate some of the internal functions in order to accurately visualize the data. More will be discussed about this point in Section 2.3.2.
2.3 Image Output
2.3.1 Manipulating Images
The x-y-z- data that were extracted from the Canatec database were not regularly spaced. While the data were taken in intervals along the z-axis, for example at a depth of 5,10,15 metres below the waterline, the x- and y- data are not at such intervals. In order to visualize the data, it was necessary to simplify the computation processes involved. To do this, the data were triangulated through a two-step process. The first step involved “resampling the data to obtain values defined on a more regular grid” (Wickham-Jones, 1994). This process included using internal Mathematica functions that averaged the record data and sorted it into bins. The second step used another Mathematica function that creates the surface itself, by projecting “the data into the x-y- plane, triangulating and plotting the resulting surface” (Wickham-Jones, 1994).
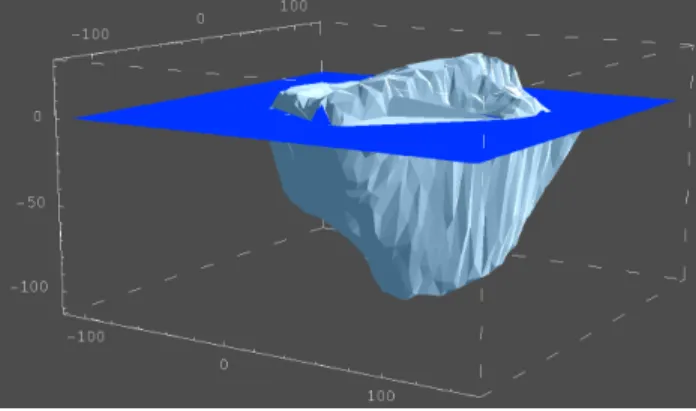
A picture of the iceberg was created within Mathematica. This surface plot was set at an appropriate viewpoint for exportation in a tagged image file format (.tif). The lighting and surface colour properties were selected based on both attempting to closely represent the true colours of an iceberg and showing the surface characteristics of each iceberg, such as indentations, ridges and so on. The surface plot incorporates axes for scale. An example of one of the graphics plots can be seen in Figure 2-1.
Figure 2-1 Graphics output
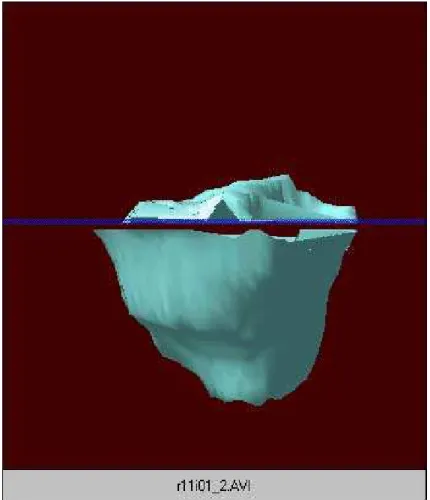
The animation of the iceberg visualization was created, as mentioned previously, using Dynamic Visualizer. The surface colour, lighting, transparency and camera angle properties were chosen to enhance the 3-dimensional representation of the iceberg, such as making the water surface somewhat transparent, and using a surface colour similar to the menthol green icebergs sometimes have. The animation output for each record was saved as an AVI animation file. The first frame from one of the animation records is shown in Figure 2-2. Further details
about both the graphics output and the animation output will be provided in the next subsection.
Figure 2-2 The first frame of an iceberg animation 2.3.2 Final Data Images
The data images fall into one of three categories. In most cases, information on only the iceberg sail is provided, and therefore only the sail could be visualized. In some cases, only the iceberg keel data was provided, so only the keel can be represented. In a few cases, the complete iceberg is provided. Each of these three cases will be discussed in turn.
Sails - Fifty-two sails were visualized from the original data set. Generally, the sail data created very good surface plots. Many recognizable types of sails were plotted, such as domed and dry docked. Since a large number of the sail data sets included z- co-ordinate data for a depth of one metre underwater, the water surface was made to be semi-transparent in order to show this feature more clearly.
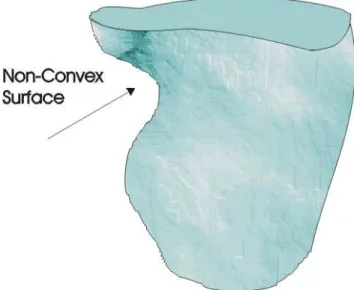
Keels - There were twenty-five keels in the original data set that were visualized. Most of these could not be as accurately represented as the sails. The reason was that the keel portions of many of the icebergs have very irregular shapes. Often, there will be portions of the iceberg that are non-convex, as shown in Figure 2-3. These non-convex shapes are often difficult to visualize.
Figure 2-3 Sketch of non-convex surface of an iceberg keel
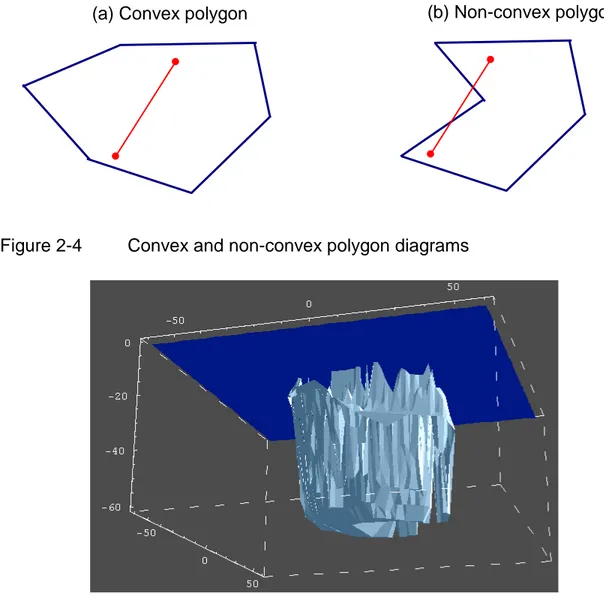
To explain further, a convex polygon may be defined as a surface wherein any two points within the polygon may be joined by a straight line that remains within the bounds of the polygon. This definition does not hold true for a non-convex polygon (Figure 2-4). The triangulation processes used by most visualization packages are often not capable of dealing with non-convex surfaces. For example, the non-convex surfaces of an object may be triangulated over, when the default process is set to deal with convex surfaces. Without sufficient data points, this triangulation process results in triangular surface areas where there may be a concavity feature on the keel. This is shown in Figure 2-5, at the lower right-hand side of the iceberg, where it seems that a concavity should exist. To a lesser degree, this is also true of the sails, but generally the sails did not appear to have as many non-convex features as the keels.
Figure 2-4 Convex and non-convex polygon diagrams
Figure 2-5 Picture depicting triangulation problems for an iceberg keel
The triangulation function used in Mathematica suffers from the above problem. It is set to deal with convex surfaces. It would be necessary to change the default mode in order to represent the concave surfaces. This in turn could lead to visualization problems, as the entire keel is not concave, simply some parts of it. The program would then have difficulty rendering convex surfaces instead, making this coding change impractical. Without having to move to more complicated visualization tools, it was determined that the representations of the keels were adequate.
Complete Icebergs - Three of the eighty records contained data for complete icebergs, i.e. both sail and keel data. Due to the aforementioned difficulties in visualizing the non-convex surface of the keels, the complete icebergs were divided between the 0m contour interval (the water line) and the next lower interval (general –5m or –10m), plotted separately, then recombined. As a result, there is a gap between the sail and the keel for each of the three icebergs.
The gap represents the distance from the lowest sail measurements to the highest keel measurements. This value ranges from five to ten metres, depending upon the recording intervals for each iceberg.
3. DESCRIPTION OF ICEBERG VISUALIZATION DATABASE
3.1 Introduction
Canatec (1999) produced a database containing the information on three-dimensional shape and geometry for icebergs observed on the Grand Banks of Canada. Based on this database, CHC developed a relational database that can be used to visualize each iceberg that contained 3-dimensional information on the iceberg shape.
Microsoft Access 97 was used as a database software as it is easy to use and to update, is compatible with other databases, spreadsheets, and word processors, and is widely available. Microsoft Access 97 uses menus in a Windows environment; therefore the user requires little knowledge of the application itself to use and work with the database.
Microsoft Access 97 was customized using the object-oriented programming language Visual Basic for Applications (VBA).
3.2 Data Structure
3.2.1 Tables in database
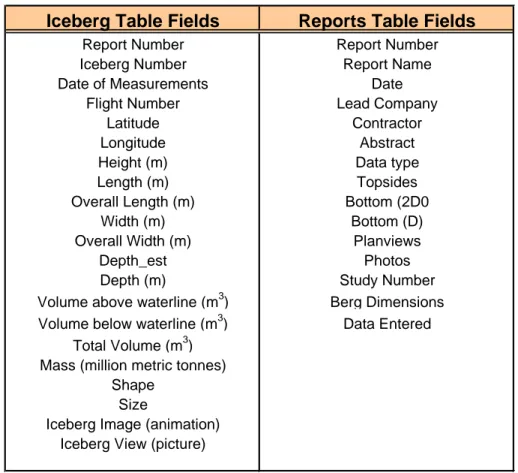
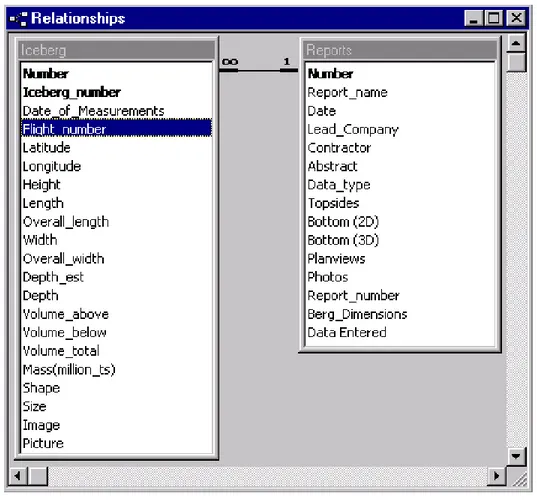
The database is comprised of two tables, “Iceberg” and “Reports”. The “Iceberg” table contains information on the iceberg characteristics, while the “Reports” table contains source information (Table 3-1). These tables are linked as one-to-many relationships shown in Figure 3-1. The relationships represent an association established between common fields in the two tables. In this database the “Iceberg” table can have many matching records in the “Reports” table while a record in the table “Reports” has only one matching record in the “Iceberg” table.
Iceberg Table Fields Reports Table Fields Report Number Report Number Iceberg Number Report Name Date of Measurements Date
Flight Number Lead Company Latitude Contractor Longitude Abstract Height (m) Data type Length (m) Topsides Overall Length (m) Bottom (2D0
Width (m) Bottom (D) Overall Width (m) Planviews
Depth_est Photos
Depth (m) Study Number Volume above waterline (m3) Berg Dimensions Volume below waterline (m3) Data Entered
Total Volume (m3) Mass (million metric tonnes)
Shape Size
Iceberg Image (animation) Iceberg View (picture)
Figure 3-1 Database Relationships 3.2.2 Forms in database
Five forms are employed in the database: a Title Page as a start-up window of the database; an Iceberg Characteristics form based on the records in the Iceberg table; a Reports form based on the records in the Reports table; and
Image Animation and Image Picture forms as pages for viewing icebergs
4. USING THE DATABASE
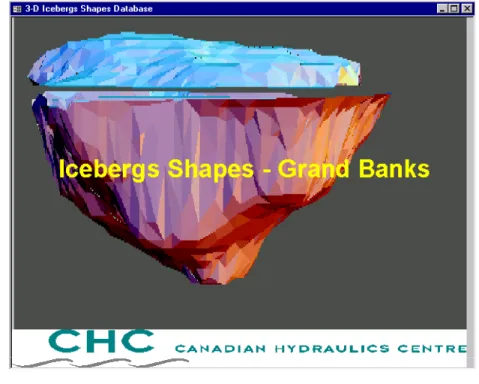
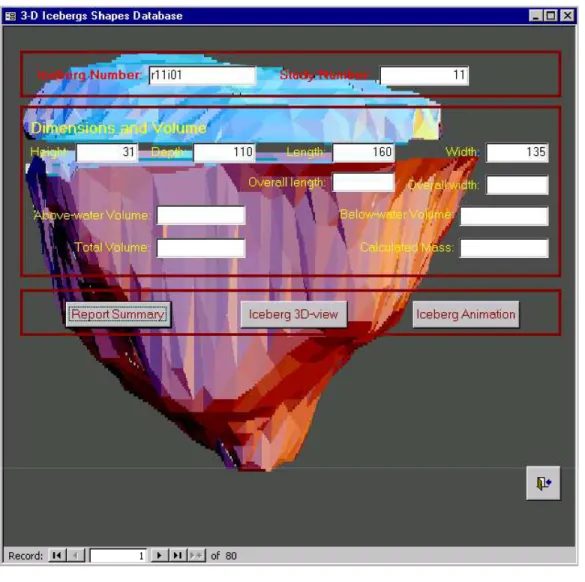
After opening the Iceberg Visualization database, a window with general information is opened (Figure 4-1). This window changes automatically to the window showing the Icebergs Characteristics form as seen in Figure 4-2. Navigation within the database is carried out by clicking an appropriate command button on the active form. The Iceberg Characteristics form contains 12 text fields with characteristics of the selected iceberg and four command buttons with a caption describing the function of each command button. The name of the selected iceberg appears in the text box with a caption “Iceberg Number” in the upper left corner of the form. The user can view the rest of icebergs either by changing the record (clicking the arrow) at the bottom of the form on the bar with navigation buttons, or by pressing Ctrl+F, then typing the name of the iceberg to be viewed into the Find What field of the Find in field: “Iceberg Number” dialog box, and then clicking on Find First and then the Close button of the dialog box.
Figure 4-2 Iceberg Characteristics form
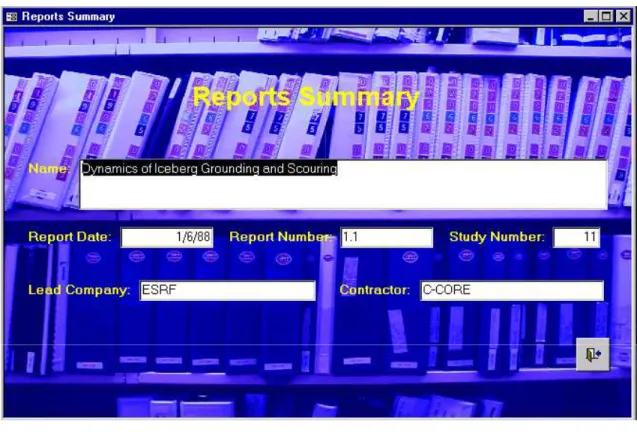
By clicking the Report Summary command button, the Reports form is opened, which is dynamically linked to the Icebergs Characteristics form (Figure 4-3). This form presents information about the data source. To close it, the user has to click on the icon in the lower right corner of the form.
Figure 4-3 Reports form
The Iceberg 3-D view command button opens a dynamically linked page on which the user can view a 3-D shape of the selected iceberg. The page can be closed by clicking the icon in the lower right corner.
The Iceberg Animation command button activates the Image Animation page. This page is again dynamically linked to the Icebergs Characteristics form, therefore presenting a 3-D shape of the selected iceberg. Double clicking activates the animation of the iceberg shape so the user can view the iceberg from each side. To stop the animation, the user has to click on the picture once. To close the page, the user has to double click the icon in the lower right corner. It should be noted that Access97 has limitations for embedding of video clips (.avi files). For proper playback operation, the video files must be in the same directory as that from which they were embedded (i.e. the files behave as if they were linked, not embedded). Therefore this database will operate properly only if the CD is the D: drive of the PC. If it is in any other drive letter, the video files can only be viewed by using the PC video player and activating each file directly. The last command button on the Iceberg Characteristics form is the exit button (icon in the lower right corner). Clicking this button opens the pop-up dialog box, giving the user the option to exit the database by selecting “Yes”.
5. SUMMARY
This report describes the visualization of Grand Banks icebergs that have been profiled with 3-dimensonal information. The visualization of each iceberg has been organized in an Access database, allowing easy viewing of each iceberg. The visualization provides an informative view of actual icebergs from the Grand Banks region of Canada.
6. REFERENCES
Canatec Consultants, 1999. Compilation of Iceberg Shape and Geometry Data for the Grand Banks Region. PERD/CHC Report 20-43, Calgary, Al. Canada. Report prepared for the National Research Council of Canada, Ottawa.
Wickham-Jones, Tom. 1994. Mathematica Graphics Techniques and Applications. TELOS, Santa Clara, California.
Wolfram, Stephen, 1999. The Mathematica Book, 3rd ed. Addendum. Wolfram Media, Cambridge University Press.
N°. DU RAPPORT HYD-TR-042
No. DU PROJET
500
CLASSIFICATION DE SÉCURITÉ ___ Top Secret/Très sécret ___ Secret ___ Confidential/Confidentiel ___ Protected/Protégée _x_ Unclassified/Non classifiée DISTRIBUTION/DIFFUSION ___ Controlled/Contrôlée _x_ Unlimited/Illimitée
DECLASSIFICATION: DATE OR REASON/DÉCLASSEMENT: DATE OU RAISON
TITLE, SUBTITLE/TITRE, SOUS-TITRE
Iceberg Visualization Database
AUTHOR(S)/AUTEUR(S)
Anne Barker, Ivana Skabova, Garry Timco
SERIES/SÉRIE
CORPORATE AUTHOR/PERFORMING ORGANIZATION/ AUTEUR D'ENTREPRISE/AGENCE D'EXÉCUTION
Canadian Hydraulics Centre
National Research Council of Canada
SPONSORING OR PARTICIPATING AGENCY/AGENCE DE SUBVENTION OU PARTICIPATION
Program on Energy Research and Development (PERD)
DATE July 1999
FILE/DOSSIER SPECIAL CODE/ CODE SPÉCIALE PAGES 15 FIGURES 9 REFERENCES 3 NOTES
DESCRIPTORS (KEY WORDS)/MOTS-CLÉS
Iceberg, data visualization, database, animation, 3-D graphics
SUMMARY/SOMMAIRE
Three-dimensional iceberg data from the Canatec database are visualized. The resulting pictures and animations are presented in a new database.
ADDRESS/ADDRESSE
Canadian Hydraulics Centre
National Research Council of Canada Montreal Road, Ottawa, K1A 0R6, Canada (613) 993-2417