HAL Id: hal-01870515
https://hal.archives-ouvertes.fr/hal-01870515
Submitted on 7 Sep 2018
HAL is a multi-disciplinary open access archive for the deposit and dissemination of sci-entific research documents, whether they are pub-lished or not. The documents may come from teaching and research institutions in France or abroad, or from public or private research centers.
L’archive ouverte pluridisciplinaire HAL, est destinée au dépôt et à la diffusion de documents scientifiques de niveau recherche, publiés ou non, émanant des établissements d’enseignement et de recherche français ou étrangers, des laboratoires publics ou privés.
Franziska Schmidt, Sigurdur Erlingsson, Carl van Geem
To cite this version:
Franziska Schmidt, Sigurdur Erlingsson, Carl van Geem. Extensive Infrastructure Design Criteria Review. [Research Report] IFSTTAR - Institut Français des Sciences et Technologies des Transports, de l’Aménagement et des Réseaux. 2018, 42 p. �hal-01870515�
CEDR TRANSNATIONAL ROAD RESEARCH PROGRAMME
Call 2015
FALCON
Freight And Logistics in a Multimodal Context
WPC Fit for purpose road vehicles to influence modal choice
(performance based standards)
Task 3.4 Extensive Infrastructure Design Criteria Review
Document : Report
Status : DRAFT
Authors
Company
Date
Approved
Franziska Schmidt, inputs from Sigurdur Erlingsson VTI) and Carl Van Geem 5BRRC)
Ifsttar 09/10/2017
Franziska Schmidt Ifsttar 31/10/2017 Version 1.1, inputs for
other countries from various experts
Work package leader name
Content
Content ... 4 Abbreviations ... 5 List of Figures ... 6 List of Tables ... 7 Management Summary ... 8 1. Introduction ... 9 2. Assumptions ... 92.1. Present design codes ... 9
2.2. Focus on design parameters linked with traffic ... 9
2.3. International (European) and national design criteria ... 9
3. Pavements ... 10
3.1. Pavement design principles ... 10
3.1.1. Traffic description. ... 11
3.2. Other design parameters ... 13
3.2.1. Material characteristics... 13
3.2.2. Environmental input ... 13
3.2.3. Swedish example... 14
3.3. Review of design criteria for pavements ... 14
4. Bridges ... 19
4.1. Methodology for bridge design or assessment ... 19
4.2. Traffic load models in Eurocode 1 ... 20
5. Tunnels... 25
6. Conclusion... 25
7. References ... 25
Appendix ... 27
8. Abnormal loads (LM3) for France ... 27
9. Abnormal loads in Belgium ... 31
10. Additional Information for the Netherlands... 33
Abbreviations
BWIM Bridge Weigh-in-Motion
LM Load Model
NA National Appendix (for the Eurocodes)
List of Figures
Figure 1: Example of influence line of bending moment at first mid-span (x=25 metres) and on support (x=50 metres), for a 2-span simply supported bridge, with both span length equal to 50
metres. ... 19
Figure 2: Load model LM1. ... 21
Figure 3: Load Model LM2. ... 21
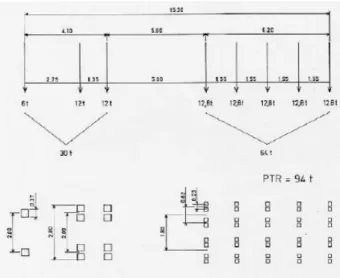
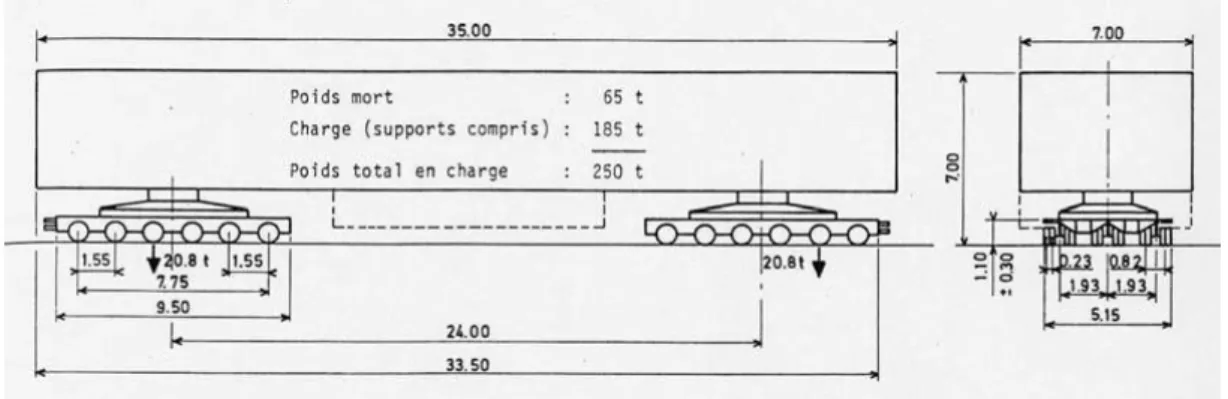
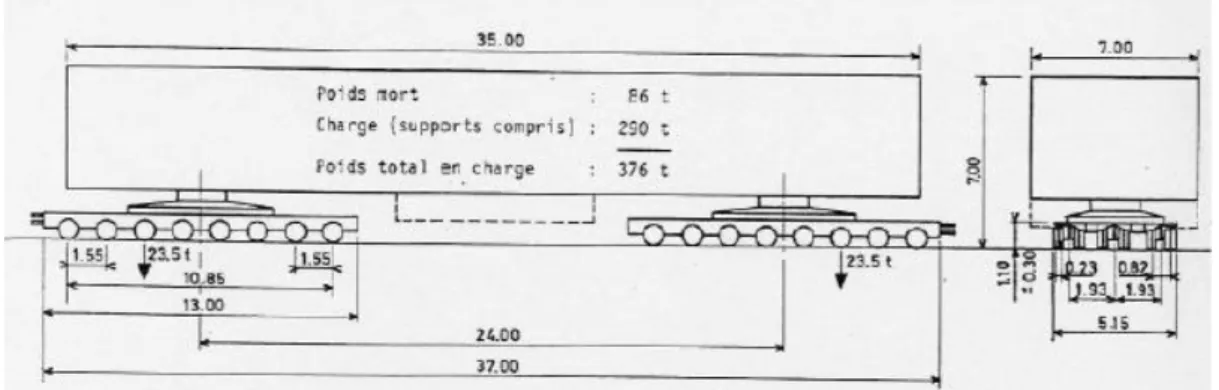
Figure 4: Convoy of type C1. ... 27
Figure 5: Convoy of type C2. ... 27
Figure 6: Convoy of type D.2 F.1 ... 28
Figure 7: Convoy of type D.2 F.2 ... 28
Figure 8: Convoy D.3 F.1 ... 28
Figure 9: Convoy D.3 F.2 ... 29
Figure 10: Convoy of type E.2 F.1 ... 29
Figure 11: Convoy E.2 F.2 ... 29
Figure 12: Convoy of type E.3 F.1 ... 29
Figure 13: Convoy of type E.3 F.2 ... 30
Figure 14: Military convoys MC80 (on the left) and MC120 (on the right). ... 30
List of Tables
Table 1: Definition of traffic classes, in daily number of heavy vehicles, in the French pavement design method. ... 11 Table 2: Construction class, according to the number of equivalent 100-kN standard loads. ... 11 Table 3: Review of European pavement design criteria. ... 15 Table 4: Correction factors related to the amount of heavy vehicles per annum per lane (The
Management Summary
This deliverable called D3.4 has the purpose to summarize the overview of infrastructure design criteria and legislation with the emphasis on roads, bridges and tunnels.
For pavements, there is no European design criteria. So the national design criteria for various European countries have been listed and explained. The parameters involved in these design criteria and to be chosen are parameters linked to the materials or structures, to climatic actions applied on the pavement all over the year and traffic. For traffic, the effect of a traffic or a given vehicle is evaluated through comparison with the effect of equivalent axle loads.
For bridges, European design criteria exist: the Eurocodes (Eurocode 0, Eurocode 1, … to Eurocode 8). These building codes are applicable all over Europe; in fact, their application is mandatory since 2010. Only partial, safety coefficients (α- factors) vary from one country to another. These factors can be found in the respective national appendixes, some of them are summarized here.
As for tunnels, it has been shown in report D3.2 that only the horizontal geometry of tunnels is designed according to traffic, as would be a road and its pavement. Therefore, the issue with traffic in tunnels is a problem of parking lots and management of truck passing’s through the tunnels.
The design criteria for pavements and bridges can now be used for the definition of Smart Infrastructure Access Policy (task 3.5 of project FALCON).
1.
Introduction
This report called D3.4 is the outcome of an infrastructure design criteria review, with focus on pavements, bridges and tunnels. It follows the deliverable D3.2, which is a catalogue of infrastructure elements in Europe. In both reports, the work has been split by infrastructure types, namely pavements, bridges and tunnels.
As already highlighted in the introduction of D3.2, this organisation of the report in categories of infrastructure elements is commonly used in the assessment of heavy vehicle impact on the road network: development of pavement and bridge design codes (series of Eurocodes, from Eurocode 0 to Eurocode 9), European studies on longer and/or heavier trucks ([1], [2] or [3]), and European research projects on the development of new type of trucks ([4] or [5]).
The design criteria that are explained and listed here deal with material parameters, environmental parameters and description of expected traffic loads. For each of the above-mentioned infrastructure elements, this information is given.
In chapter 2, assumptions made for this work are detailed. Then, chapters 3, 4 and 5 deal with the design criteria of respectively pavements, bridges and tunnels, the design of road geometry being dealt with in report 3.3.
2.
Assumptions
2.1. Present design codes
As in report D3.2, only infrastructure designed with existing standards and codes are considered.
2.2. Focus on design parameters linked with traffic
Design criteria involve material characteristics (for example elastic modulus for the bituminous material in bituminous pavements), environmental influence (seasonal changes, target temperature) or design traffic.
While discussing all these design parameters in this report, we will focus on traffic design criteria by explaining their definition. Indeed, design traffic (meaning the traffic for which the infrastructure element) has been designed is another concept than assessing the effect of a given vehicle.
In FALCON, the work will be mainly focussed on assessing and comparing the effect of individual vehicles.
2.3. International (European) and national design criteria
This report is supposed deal with international, European-level design criteria and national ones. But for pavements, there exist no European design criteria.
For bridges on the other hand, design criteria are European, as indicated by the series of Eurocodes which application is mandatory since 2010; for application, national partial safety factors, as indicated in the various national annexes, are applied and these are specific to the country.
3.
Pavements
3.1. Pavement design principles
Most countries use so-called mechanistic-empirical pavement design methods, which are similar In their principle. They are based on two main steps:
A calculation of the stress-strain response of the pavement to a reference load (generally defined as the “equivalent standard axle load”, or ESAL), using a multi-layer linear elastic pavement model.
The application of several pavement design criteria, which allow to calculate the number of standard axle loads (ESALS) which can be supported by the pavement before failure (also called the pavement life), in function of the maximum level of stress or strain calculated in each pavement layer.
The design criteria used depend on the type of pavement, and on the nature of the pavement materials:
For low traffic pavements, the design criterion is generally based on the maximum level of the vertical compressive strain at the top of the subgrade
z. This criterion is defined as a“rutting criterion” of the subgrade, because the level of permanent deformations in the subgrade is strongly related with
z For thick bituminous pavements, there are generally two design criteria:
o The first design criterion is based on the maximum tensile strain at the bottom of the bituminous layers,
t. This criterion is defined as a “fatigue criterion” of the bituminouslayers, because it relates the fatigue life of the bituminous material with the maximum tensile strain at the bottom of the bituminous layers,
t.o The second criterion is the same rutting criterion of the subgrade, based on the maximum vertical strain
z. at the top of the subgrade. For pavements with layers treated with hydraulic binders, there are two design criteria:
o The first design criterion is based on the maximum tensile stress at the bottom of the bituminous treated layers,
t. This criterion is a defined as a “fatigue criterion” of thelayers treated with hydraulic binders, because it relates the fatigue life of the hydraulic bound material with the maximum tensile stress
t.o the second criterion is again the rutting criterion of the subgrade, based on the maximum vertical strain
z at the top of the subgradeAll mechanistic pavement design methods are based on several main parameters:
The traffic level and the service life, which can be converted into a number of Equivalent Standard Axle Loads (ESAL) that the pavement must support,
The bearing capacity of the subgrade (elastic modulus), which is taken into account in the pavement model and the mechanical properties of the pavement materials (elastic modulus, Poisson ratio, fatigue properties…),
The climate, and in particular the temperature (single value, or several climatic periods) considered for the bituminous materials, which have a strongly temperature-dependent behavior,
A factor of safety, (called risk coefficient in the French method), which can be used to adjust the number of loads to failure. For example, in France, a low probability of failure is considered in the design for heavy traffic roads, on which a high level of service must be ensured.
3.1.1.
Traffic description.
3.1.1.1. Traffic classes
For classification of roads, and for design, traffic is generally described by traffic classes, which represent the daily mean number of heavy vehicles (HV) passing on the road.
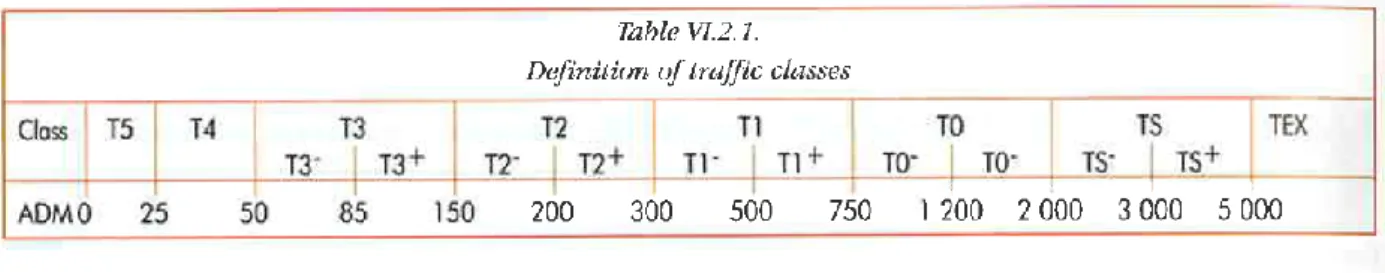
In France, heavy vehicles are defined as vehicles with a payload of 5 tons and more, and 8 traffic classes are defined, as described in Table 1.
Table 1: Definition of traffic classes, in daily number of heavy vehicles, in the French pavement design method.
These traffic classes cover a wide range, from very low numbers of HV/day (less than 25) to very high numbers ( > 5000 HV / day). They correspond approximately to 3 ranges:
Classes T5, T4, T3 (0 to 150 HV / day) correspond to low traffic roads (secondary roads), Classes T2 and T1 correspond to medium traffic roads,
Classes T0 and more correspond to major roads, with heavy traffic (National roads, motorways).
In Sweden, the design traffic is determined with use of B-WIM (Bridge Weigh-in-Motion) systems which monitor the traffic in a detailed way. Indeed, each truck passing the B-WIM system is recorded, in terms of time of passage, axle loads, distance between axles… This gives an exhaustive view on the traffic at this given location.
In Belgium (Flanders), traffic is described in terms of construction classes, which are linked to the number of equivalent 100-kN standard axle loads, see Table 2. These construction classes are then called B1 to B10.
Table 2: Construction class, according to the number of equivalent 100-kN standard loads. Cumulative traffic (in million of vehicles) 64 - 128 32 - 64 16 - 32 8 - 16 4 - 8 2 - 4 1 - 2 0.5 – 1 0.25 – 0.5 0.125 – 0.250
Construction class
B1 B2 B3 B4 B5 B6 B7 B8 B9 B10
This number of equivalent 100-kN standard axle loads is determined based on the expected traffic on the road structure to be designed.
3.1.1.2. Equivalent traffic used for design
For design calculations, the number of heavy vehicles corresponding to the real traffic (with variable vehicle types, and variable axle loads) is generally converted into a number of Equivalent Standard Axle Loads NE.
In France, for example, the reference axle is a dual wheel, isolated axle, loaded at 130 kN (maximum legal axle weight). The number of heavy vehicles N is converted into a number of standard axles NE using a mean Coefficient of Aggressiveness of the vehicles CAM, using the following equation:
NE = N x CAM
Therefore, the mean coefficient of aggressiveness CAM represents the mean fatigue damage caused by one heavy vehicle, compared with the damage caused by the standard axle load. The value of CAM can be calculated using the real axle load distributions of the real traffic, and depends:
On the axle and vehicle load distributions
But also on the type of pavement structure (because the damage caused by one vehicle depends on the characteristics of the pavement structure and of the pavement materials). The concept of coefficient of aggressiveness CAM can represent a practical indicator for describing the impact of a given vehicle on a given type of pavement, and for comparing the relative aggressiveness of different heavy vehicles.
3.1.1.3. Assessment of individual vehicles
For fatigue of concrete pavements, the coefficient of fatigue aggressiveness CAv of a vehicle v is
defined by: ref v v d d CA (1) where:
dv is the fatigue damage produced by the heavy vehicle v (as defined in report D3.2),
dref is the fatigue damage due to a reference load (for example a 5-axle 40-ton standard
vehicle) used as reference for comparison with new vehicle concepts developed in the project. For rutting (bituminous pavements), COST 334 Study “Effects of Wide Single Tyres and Dual Tyres”, published in 2001 [7] has defined a so-called tyre configuration factor (TCF). The TCF value relates the pavement wear of a given tyre to the pavement wear of a reference tyre. Within different axle categories (steered, driven or towed axle), there is a wide range of TCF values which reflects the fact that there are more and less pavement damaging tyres and tyre configurations as options possible. The damage contribution of a single passage of an axle is expressed by the so-called axle wear factor (AWF). This AWF is a dimensionless factor relating the damage contribution of a specific tyre at a given axle load to the damage contribution of a single passage of the reference tyre(s) with a reference axle load. Reference for the AWF means a passage of a 10-t axle equipped with 295/80R22,5 tyres mounted
as twin assembly. To adjust the axle load effect on pavement damage a load equivalency factor (LEF) was introduced in the COST 334 formulas. If only asphalt roads in the primary road network are considered and only primary rutting as damage cause is taken into account, the pavement damage increases with the power of 2 by axle load.
The sum of all axle wear factors of a truck combination are called vehicle wear factor (VWF). For equal TCF and LEF the higher the number of axles the higher is the vehicle wear factor, but on the other hand the higher the payload can be.
For the same gross vehicle weight, the higher the number of axles the lower is the axle wear factor for each axle and also the vehicle wear factor as sum of all axles.
The performance of a vehicle regarding pavement wear can be calculated by relating the payload to the vehicle wear factor. This performance indicator: VWF / Payload is abbreviated in the following as PER (vehicle road wear performance). It can be used for relative comparisons of aggressiveness of different vehicles.
The following formulas are generally used for calculation: • Load Equivalence Factor (dimensionless):
LEF= (axle load / 10)² (2)
• Tyre Configuration Factor (dimensionless):
TCF: (tyre width/470) -1,65 x (tyre diameter /1059) -1,12 (3)
• Axle Wear Factor (dimensionless):
AWF=TCF x LEF (4)
• Vehicle Wear Factor (dimensionless):
VWF=SUM (AWF) (5)
Vehicle Road Wear Performance (dimensionless):
PER: VWF / Payload (6)
3.2. Other design parameters
3.2.1.
Material characteristics
For bituminous materials and materials treated with hydraulic binders (as concrete pavements), the parameters to be chosen are:
E : elastic modulus, ν: Poisson ratio,
𝜀6: limit tensile strain leading to failure for 106 cycles, b: exponent of the fatigue law.
3.2.2.
Environmental input
Target temperatures have to be chosen. These are given by national regulations which link the geographic position of the road with the target temperature (and/or seasonal changes) to be considered.
3.2.3.
Swedish example
The country (Sweden) is divided into five climate zones (basically from south to north). The year is divided into six seasons (winter, winter-thawing, spring thawing, late spring, summer and autumn) and represented as number of days for each season (giving a sum of 365). The material parameters (the stiffness) for the different layers are affected based on the seasons and climate zone. The stiffness values are given in tables (for each climate zone and season) for many materials. They are also incorporated in the design software (PMS Objekt). All calculations are 2-D Axisymmetric calculations with a circular contact area loading.
All traffic volume is transformed to standard axles (ESAL´s). In Sweden, one ESAL is defined as 100 kN dual tyre axle with 300 mm spacing between the wheels and tyre pressure 800 kPa. The amount of traffic is frequently based on BWIM measurements (usually during a 7-day period) but for many project BWIM measurements are lacking and some predictions are done based on other similar roads. The BWIM measurements are processed to represent a B-factor (similar to truck factor in the US). The B-factor (usually in the range 0.8 – 1.3) is the average load equivalency factor of each heavy vehicle and is calculated based on the fourth power law. The expected AADT and the % share/portion of heavy traffic and traffic growth is used to calculate the total number of ESAL´s (called N100) for the design period.
The accumulation for the design criteria is based on Miner´s rule where calculation is only done once for each season and then summed up for the traffic volume for each season, each year, and finally for the total design period.
3.3. Review of design criteria for pavements
Table 3: Review of European pavement design criteria. Pavements
Sweden Norway Netherlands Germany France (source: [9]) UK Belgium
Design period 20 years
20 years (Design Guide “N200
Vegbygging”) 20 years
30 years as a rule, according to German pavement design catalogue RStO 12 (guidelines
for the standardization of pavement structures), also according to RDO Asphalt 09
(guidelines for the analytical design of asphalt pavement
structures)
20 years
HD 26/06 2.27 For trunk roads including motorways where
design traffic is heavy in relation to the capacity of the layout, and in all cases where Whole Life Value is taken into account, 40 year designs must be included as permitted options. 20 year designs may be appropriate
for less heavily trafficked schemes or for major maintenance where other
site constraints apply. In England, a ‘Departure from Standard’ must be obtained
from the Overseeing Organisation for use of 20
year designs. The design traffic in msa should be obtained from HD 24 (DMRB 7.2.1). 20 or 30 years Description of ESAL 100 kN axle loading on dual tyres with 800
kPa tyre pressure
Number of equivalent 10 tonne
axle loads per lane. Calculated using annual daily heavy
vehicle traffic (AADT_Heavy), number of lanes, expected annual traffic growth, length of design period (years), average number of
axles per heavy
SAL = 100 kN load on axle with SPDM dual wheel sets ESAL = equivalent number of SAL’s computed from actual traffic loading data
RStO 12: weighted number of equivalent 10-tonnes axle load repetitions in the design period
(in the most heavily loaded lanes). Calculated using annual
average daily heavy traffic (AADT_Heavy), design period
in years, load configuration factor, average number of axles per heavy vehicle, lane factor, lane width factor, slope
factor und average annual increase of heavy traffic
RDO Asphalt 09:
cumulative number (NE) of passages of reference axle loads
(isolated axle with 130-kN dual wheels)
HD 24/06 A ‘standard axle’ is defined
as an axle exerting or applying a force of 80kN. The
fourth power law is used to equate the wear caused by each vehicle type to the
number of equivalent standard axles, to give the structural wear factor of that
vehicle.
Flanders: Equivalent 100 kN axle loads computed from expected
number of lorries, taking into account wander, number of lanes, traffic speed, type of
road, type of tyres. Wallonia: number of lorries, spectrum of axle loads, average
permitted axle load. 11 load classes for consideration of truck traffic
Climatic parameters
Yes. Climate seasons (five climatic regions –
six seasons per year)
Risk for frost heave based on frost susceptibility of materials on which
the road is being built influences thickness of
base-layer and frost protection layer. Annual mean temperature and amount of frost (degree-hours). For drainage: Frequency of flooding of a defined magnitude or precipitation of defined intensity. Average temperature: 14oC airtemperature for asphalt pavements Temperature gradient spectrum for concrete roads
RStO 12: the minimum thickness of frost-resistant road structure is dependent
on:
- frost susceptibility of the soil in combination with traffic load
(load class/ construction class ) - Local conditions (frost impact: three different frost
zones, small-area climate changes, water conditions in
the subgrade, position of gradient, drainage of carriageway/execution of
border areas) RDO Asphalt 09: considering of the temperature gradients
in all asphalt layers using thirteen different temperature
gradients (5 K temperature classes/intervals) and the frequency of occurrence of these temperature gradients
(Surface temperature frequency distribution depends on 4 temperature zones), frost protection according to the
RStO 12
15° (metropolitan France) & Pavement strength
during freeze-and-thaw periods is
assessed separately
HD 26/06 3.1 All material within 450mm of the road surface, where the mean annual frost
index (MAFI) of the site is ≥50 must be non frost susceptible in the long-term.
Where the MAFI is < 50 the thickness of non-frost susceptible material may be
350 mm. For slower curing HBM appropriate measures must be taken to prevent frost damage in the short term. Further guidance is
provided in HD 25.
Wallonia: Thermal gradient within concrete layers, average temperature in each month and
its influence on the E-modulus of bituminous layers, depth of frost penetration is checked against freeze index and used for determination of lower layer
thicknesses.
Fatigue criteria
Tensile strain at the bottom of the asphalt concrete is calculated for each season under an ESAL loading and
thereafter accumulated for all traffic loading (ESAL´s)
using Miner´s law
No direct criterion, but inherent in other material requirements. Cumulative fatigue damage for asphalt pavements at the bottom of the tensile stressed layers under axle
load spectrum
RStO 12: The thickness of the road structure shall be
specified as to ensure sufficient fatigue resistance to
strains from traffic and weather during the intended
service life RDO Asphalt 09: Fatigue function is determined by indirect tensile test. Tensile
The design criterion for asphalt pavements
is the strain at the bottom of the tensile
stressed layers. For pavements with
Hydraulic-Binder-Treated Base and Concrete Pavements,
HD 26/06 3.2 (Bitumen bound materials) The binder content should be sufficient
to provide thick enough binder films on the aggregate to create fatigue
resistance and achieve durability.
Tensile strain at the bottom of the asphalt concrete is calculated for each season under an ESAL loading and thereafter accumulated for all
traffic loading (ESAL´s) using Miner´s law. Different fatigue laws are used
and tyre spectrum. Cumulative fatigue damage for concrete pavements at the bottom of the concrete layer under axle load spectrum and tyre
spectrum and temperature
gradient spectrum. Lateral wander and edge effects
are taken into account for both
asphalt and concrete. For pavements
with Cement treated Base and
Concrete Pavements, the design criterion is the maximum allowable horizontal tensile stress as a result of an extreme axle load.
strain at the bottom of the asphalt base course is calculated for each of the 143
loading cases (resulting from 11 load classes for consideration of truck traffic
times 13 temperature distributions). For each of the 143 calculated
strain values ε, the maximum allowed number of load cycles
is calculated. Miner´s law is used to estimate accumulation
of fatigue damage. Resistance to fatigue macro cracking is given as long as the
sum of the partial damages is less than or equal to one.
the design criterion is the stress at the base of the tensile-stressed
layers.
“Alternative ‘analytical’ pavement design” The following fatigue considerations must be
taken into account: •surface initiated fatigue cracking in thicker/long-life pavements •fatigue resistance of asphalt materials •excessive stress/strain (combination of magnitude
and number of load applications) causing fatigue
cracking (typically at the bottom of the base layer) of
the asphalt, HBM or concrete material;
for asphalt or concrete pavements. For asphalt pavements, the law
takes into account: the deformation at the bottom of
the asphalt layers. For concrete pavements, the
law takes into account: deflection, thermal deformation
and failure constraints.
Rutting criteria
The vertical compressive strain is calculated at the top of the subgrade for each season under an
Wheel-track values for Stone Mastic Asphalt (SMA) and
Asphalt Concrete (AC). Limitation of the vertical permanent deformation at the top of
Equivalent tensile stress in the load axle from the surface until the boundary between the asphalt binder course and the
asphalt base course
Limitation of the vertical strain on the top of the concerned courses (subgrade and
HD 26/06 3.3 (Bitumen bound materials) Early age deformation (rutting) in surface and binder course
Limitation of the vertical permanent deformation at the
top of each of the concerned layers.
thereafter accumulated for all traffic loading using
Miner´s law.
Asphalt rutting is not in the design method but only in the material
specifications (creep resistance
fc)
Assessing the deformation resistance of the asphalt surface and asphalt binder course mixtures by means of
the Cyclic compression test.
unbound pavement courses).
layers may be linked to trafficking by slow moving commercial vehicles (e.g. in a contraflow), especially on uphill lengths and when pavement temperatures are
high, relatively soon after the materials have been laid
(e.g. after major maintenance in the summer). Therefore, such situations should be avoided.
Where Hot Rolled Asphalt (HRA) (if permitted) is used,
Clause 943 of the Specification (MCHW1) sets
out the requirements for performance based
surfacing. “Alternative ‘analytical’
pavement design” 4.6 deformation resistance
of asphalt materials only, which governs rutting
behaviour must be considered when designing
4.
Bridges
4.1. Methodology for bridge design or assessment
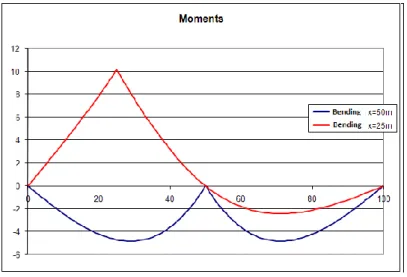
As stated in deliverable D3.2, the structural behaviour of bridges can be summarized by their influence lines. Therefore bridges are designed or assessed by calculating the convolution of the axles loads of the vehicle/traffic/load model with the influence line of the studied effect. Some examples of influence lines are given in Figure 1, where one can see the influence lines for bending moment at first mid-span and middle support, for a 2-span simply supported bridge with both span length equal to 50 metres.
Figure 1: Example of influence line of bending moment at first mid-span (x=25 metres) and on support (x=50 metres), for a 2-span simply supported bridge, with both span length equal to 50
metres.
For bridge design against exterior actions (traffic but also climatic actions, like snow, water, …), one calculates the stresses induced in the structure by the load models given by the European standards. These standards are the Eurocodes:
Eurocode 0 [1] gives the general framework of bridge design in Europe,
Eurocode 1 gives the actions to be considered, and more particularly Eurocode 1 – Part 2 [2] gives the traffic actions to be used,
Eurocodes 2 to 9 explain the methodology to verify that the stresses induced in the structure by the actions chosen in the step before are consistent with convenient structural and material behaviour. For example, Eurocode 3 [3] details how to verify that the stresses induced in the steel structure are not prone to fatigue problems.
These standards are common all over Europe. Only the adjustment factors, called α-factors, may differ from one country to another. That is why each Eurocode i is accompanied by a document called “Eurocode I – National Annex” (specific to each country) which specifies the numerical values of these factors. For more information, [4] summarizes many issues around Eurocodes.
But, if one wants to compare the effect of various vehicles, the methodology is to compute the effects of these vehicles and compare them in terms of extreme loads and fatigue. This methodology has been used during the background works of the US Bridge Formula and the European studies on longer and/or heavier trucks.
In this case, as the evaluation is done in comparison, the influence lines can be theoretical ones. This was also the methodology used during the background works of Eurocode 1.
The following table list the design criteria (α-factors) around Europe, as the abnormal load models.
4.2. Traffic load models in Eurocode 1
Load models of Eurocode 1 are only applicable for loaded length inferior to 200 metres. In many countries, this rule is loosened in the National Appendix to span length inferior to 200 metres. Above these values, the load models to be applied have to be defined for each project particularly.
These models have been calibrated carefully in the 1980s, based on traffic recordings of 1986 on highway A6 near Auxerre (France). These models incorporate:
Impact factor (dynamical behaviour) corresponding to a medium road rugosity (category C in ISO8608:1995, older pavement not maintained),
Additional impact factor for spans less than 15 metres (corresponding for example to holes in the pavement),
Covers both the situation where the traffic is flowing with dynamic behaviour a traffic jam of heavy vehicles on the structure.
The characteristic values have been determined statistically for a return period of 1000 years (or probability of exceedance of 5% in 50 years).
Other assumptions have been made:
The width of lanes have been taken equal to 3.00 metres (instead of physical 3.50metres for roads).
Any lateral positions of the lanes is possible (in order to cater for any unsuspected situation, like tightening of lanes or works).
Several load models are proposed: originally, LM1 was supposed to be for very heavy truck traffic that is often congested (for example, highways entering cities), and LM2 for more conventional highways. Nevertheless, with the increase in volume and weight of traffic, it is now advised to use LM1 for every highway.
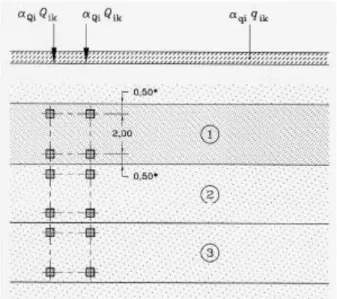
Load Model 1 (LM1) : Concentrated and uniformly distributed loads, which cover most of the effects of the traffic of lorries and cars. This model should be used for general and local verifications, see Figure 2. The numbers of the lanes are defined: The lane giving the most unfavourable effect is numbered Lane Number 1, the lane giving the second most unfavourable effect is numbered Lane Number 2, etc.
Figure 2: Load model LM1.
Load Model 2 (LM2) : A single axle load applied on specific tyre contact areas which covers the dynamic effects of the normal traffic on short structural members, see Figure 3.
Figure 3: Load Model LM2.
Load Model for abnormal loads : A set of assemblies of axle loads representing special vehicles (e.g. for industrial transport) which can travel on routes permitted for abnormal loads. It is intended for general and local verifications. This load model is defined in the national appendix, and is therefore specific to each country.
To finish, we should mention that Eurocode 1 also defines rules for dispersal of concentrated loads (for example through pavement and a concrete slab), and horizontal forces (braking and acceleration forces, and centrifugal and other transverse forces).
Bridges
Sweden Norway Netherlands Germany France UK Belgium
Application of EC1-2 Yes Yes Yes Yes
Yes Yes (guidelines of NBN EN 1991-2 ANB table M.1 ANB) α-factor Alpha-factors (LM1 of Eurocode 1): 𝛼𝑄1= 0.6
All the other alpha-factors= 1.0. LM1: see Appendix 2, Table 4 in addition i>2 and Nobs 2 000 000 per annum: αq1 = 1,15 and for i >1 αqi = 1,40 LM2: 𝛽𝑄= 𝛼𝑞1 𝛼𝑄1= 0.8 𝛼𝑄2= 0.8 The other alpha-factors 𝛼𝑄𝑖 equal to 0. ∀𝑖, 𝛼𝑞𝑖= 1 LM1: 𝛼𝑄1= 1 𝛼𝑄𝑖= 1, ∀𝑖 ≥ 2 𝛼𝑞1= 1 𝛼𝑞1= 1.2, ∀𝑖 ≥ 2 𝛼𝑞𝑟= 1.2 LM2: 𝛼𝑄1= 0.9 𝛼𝑄𝑖= 0.8, ∀𝑖 ≥ 2 𝛼𝑞1= 0.7 𝛼𝑞1= 1, ∀𝑖 ≥ 2 𝛼𝑞𝑟= 1 LM1: ∀𝑖, 𝛼𝑄1= 1 𝛼𝑞1= 0.61 𝛼𝑞𝑖= 2.2, ∀𝑖 ≥ 2 (see Appendix 11) LM2: 𝛽𝑄= 𝛼𝑄1 (see Appendix 11)
For new bridges: European class 1 (alpha-factors = 1)
For existing bridges: Belgian class 2 (alpha-factors in general = 0,8).
Use of real traffic data
Yes, only for amount of vehicles. See
Table 4
Yes, for span length > 200 meters
LM1 valid for loaded lengths up to 1,500m
See table NA.4 (Appendix 11)
Yes
Load models for abnormal loads
Load models now:
1- Total weight: 3240 kN, 18 axles of 180 kN. Distances between axles: 1.50 m (total length: 25.50 m) 2- Total weight: 5400 kN, 15 · No Special vehicles defined by the National regulation on special permit vehicles or military vehicles
(see Appendix Abnormal loads)
Contained in NA (see Appendix 11) Examples for abnormal
values: SV80: 6 × 130 𝑘𝑁 separated by 2 × 1.20𝑚 + 3𝑚 + 2 × 1.20𝑚 900/150, 1200/150, 1800/150 1200/200, 1800/200, 2400/200 2400/300, 3600/300 Where: • First number = total
180 kN + 15 · 180 kN. Distances between axles: 14 · 1,50 m + 12 m + 14 · 1,50 m (total length: 54 m) The need to take this into
account is considered in each project. Proposed but not yet
decided LM3: 1- Total weight: 2700 kN, 18 axles of 150 kN. Distances between axles: 1.50 m (total length: 25.50 m) 2- Total weight: 4500 kN, 15 · 150 kN + 15 · 150 kN. Distances between axles: 14 · 1,50 m + 12 m + 14 · 1,50 m (total length: 54 m) If decided, every public
bridge owned by the counties or the state should
be designed for this load model. SV100: 6 × 165 𝑘𝑁 separated by 2 × 1.20𝑚 + 3𝑚 + 2 × 1.20𝑚 SV196: 12 × 165 𝑘𝑁 separated by 4 × 1.20𝑚 + 2𝑚 + 3 × 1.20𝑚 + 4𝑚 + 1.6𝑚 + 4.4𝑚 Also exist SV250, SV350, SV450, SV600.
• Second number = axle weight kN • Longitudinal spacing between the axles: 1,5m
See Appendix Abnormal loads
5.
Tunnels
It has been shown in deliverable D3.2 that only the horizontal geometry of tunnels is designed according to traffic, as would be a road and its pavement, outside a tunnel. Therefore, if one assesses the road geometry and the pavement before and after un tunnel, the results are valid also for the tunnel.
Therefore, the issue with traffic in tunnels is a problem of parking lots and management of truck passing’s through the tunnels.
More precisely, the tunnel managers do have basically two ways for dealing with heavy vehicles, especially after the fire at Mont Blanc tunnel:
They can limit the number of trucks in the tunnels, and therefore the calorific volume, (reduction of risk),
They can decide to let all heavy vehicles pass through the tunnel at a time timeslot, when there are no other vehicles (reduction of consequences).
There are actually no design guidelines for parking lots in tunnels, but this type of infrastructure is a big issue presently [7] as there have been very important accidents. It is telling to cite the one in the tunnel de la Sierre where a bus has had an impact with the end-wall of such a lay-by on the 13th March
2012. 28 people out of 52 (22 children) have been killed. Therefore the general principle is to include enough drive lanes in the tunnel, so that traffic can flow by even if a vehicle is stopped on the carriage way.
6.
Conclusion
7.
References
[1] EN1990, Eurocode 0 - Basis of structural design, 1990.
[2] EN1991, Eurocode 1: Actions on structures - Part 2: Traffic loads on bridges, 1991.
[3] EN1993, Eurocode 3: Design of steel structures - Part 1-1: General rules and rules for buildings, 1993.
[4] http://eurocodes.jrc.ec.europa.eu/
[5] Final report - Effects of adapting the rules on weights and dimensions of heavy commercial vehicles
as established within Directive 96/53/EC, January 2009, available online
https://ec.europa.eu/transport/sites/transport/files/themes/strategies/studies/doc/2009_01_weigh
ts_and_dimensions_vehicles.pdf
[6] OECD, Moving Freight with Better Trucks: Improving Safety, Productivity and Sustainability, OECD Publishing, 2011, available online https://www.itf-oecd.org/sites/default/files/docs/truckssum.pdf
[7] Lay bys and protection against lateral obstacles – Current practices in Europe, PIARC report, 2016.
[8] Règlementation sur les convois exceptionnels et militaires – Historique des textes publiés entre 1852 et 2009, SETRA, 2009.
[9] Corte, J.F. and Goux, M.T. 1996. Design of pavement structures: the French technical guide. Transport Research Report, 1539: 116–124.
Appendix
8.
Abnormal loads (LM3) for France
The abnormal loads that may be used for designing of road infrastructure can be found here [8]:
Figure 4: Convoy of type C1.
Figure 6: Convoy of type D.2 F.1
Figure 7: Convoy of type D.2 F.2
Figure 9: Convoy D.3 F.2
Figure 10: Convoy of type E.2 F.1
Figure 11: Convoy E.2 F.2
Figure 13: Convoy of type E.3 F.2
Figure 14: Military convoys MC80 (on the left) and MC120 (on the right).
9.
Abnormal loads in Belgium
For LM3 are used the following configurations: 900/150, 1200/150, 1800/150 1200/200, 1800/200, 2400/200 2400/300, 3600/300
Where:
First number = total weight kN Second number = axle weight kN
Longitudinal spacing between the axles: 1,5m Transverse configuration for axles of 150 and 200 kN:
10. Additional Information for the Netherlands
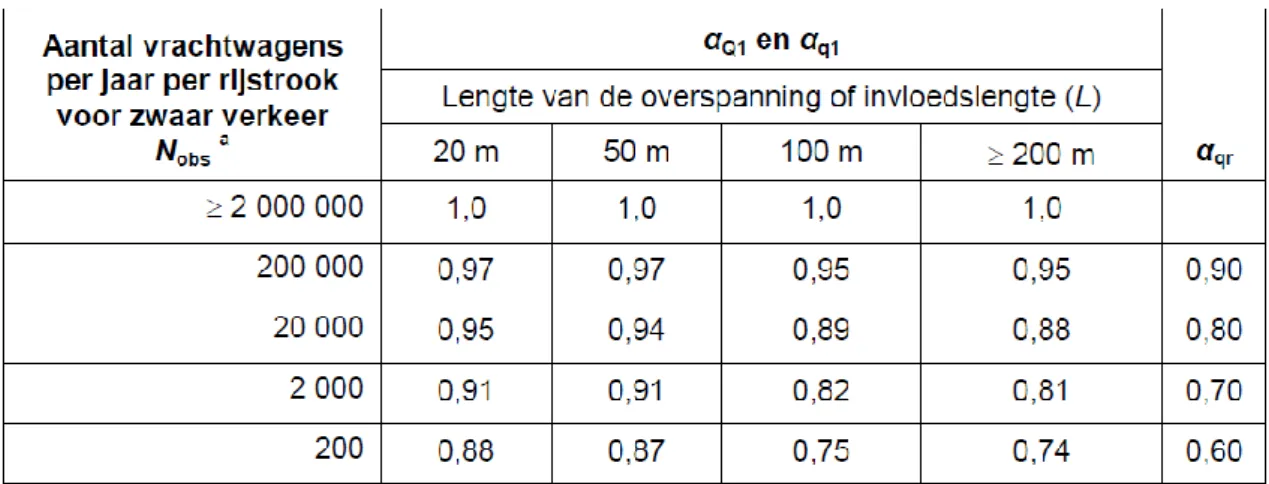
Correction factors related to the amount of heavy vehicles per annum per lane
Table 4: Correction factors related to the amount of heavy vehicles per annum per lane (The Netherlands)