HAL Id: hal-01219250
https://hal.archives-ouvertes.fr/hal-01219250
Preprint submitted on 22 Oct 2015
HAL is a multi-disciplinary open access archive for the deposit and dissemination of sci-entific research documents, whether they are pub-lished or not. The documents may come from teaching and research institutions in France or abroad, or from public or private research centers.
L’archive ouverte pluridisciplinaire HAL, est destinée au dépôt et à la diffusion de documents scientifiques de niveau recherche, publiés ou non, émanant des établissements d’enseignement et de recherche français ou étrangers, des laboratoires publics ou privés.
Laetitia Duval, François-charles Wolff
To cite this version:
Laetitia Duval, François-charles Wolff. ” I Even Met Happy Gypsies ” : Life Satisfaction of Roma Youth in the Balkans. 2015. �hal-01219250�
“I Even Met Happy Gypsies”:
Life Satisfaction of Roma Youth in the Balkans
#
Laetitia Duval* François-‐Charles Wolff**
October 2015
Abstract: Economic studies on the Roma population, which is the largest and the poorest ethnic minority in Europe, remain sparse due to the limited availability of appropriate micro level data. This paper provides a comparative analysis of life satisfaction between Roma and non-‐Roma young adults aged between 15 and 24 using survey data collected from Serbia in 2010 and from Bosnia and Herzegovina in 2011. Results from raw answers show that young Roma living in settlements are less satisfied with life than non-‐Roma. However, we find instead that the former group is more satisfied once we account for the fact that Roma have more disadvantaged characteristics on average. Also, Roma young adults expect a better life within one year compared to non-‐Roma in Serbia while there is no difference in Bosnia and Herzegovina.
JEL classification: I31, J15, J13
Keywords: Life satisfaction, ethnicity, youth, Roma, Bosnia and Herzegovina, Serbia
# “I Even Met Happy Gypsies” is a reference to the Yugoslav film directed by Aleksandar Petrovic, which sets within Roma settlements in the Northern province of Vojvodina (Serbia today). At the 1967 Cannes Film Festival, this movie won the Special Grand Prize of the Jury.
We are indebted to two anonymous reviewers for their very helpful comments and suggestions on a previous draft. Remaining errors are ours.
* Corresponding author. Imperial College London, School of Public Health, St Mary’s Campus, London W2 1PG, United Kingdom. E-‐mail: l.duval@imperial.ac.uk
** LEMNA, Université de Nantes, BP 52231 Chemin de la Censive du Tertre, 44322 Nantes Cedex, France and INED, Paris, France. E-mail: francois.wolff@univ-nantes.fr
1. Introduction
The Roma constitute the largest, the poorest and the youngest ethnic minority in Europe -‐ estimated to number 10-‐12 million (Ringold et al., 2005). While the Roma have focused unprecedented attention of the media and governments in Western European countries over the last years, essentially with the fear of massive waves of Roma migrants, 80 per cent of them are living in the Eastern Europe and Balkan Peninsula. Even though the Roma have emigrated from India to Europe centuries ago, they live outside the mainstream population and face discrimination across European countries (Ringold et al., 2005). However, almost nothing is known concerning the subjective well-‐being of the Roma population.
The purpose of this paper is to study the determinants of the self-‐reported life satisfaction of Roma young adults living in settlements and to investigate whether there is any difference in the well-‐being of Roma and non-‐Roma. Our empirical study is based on an usually rich household survey, the fourth global round of Multiple Indicator Cluster Survey (MICS4 hereafter), conducted in Serbia in 2010 and in Bosnia and Herzegovina (BiH hereafter) in 2011 by the United Nations Children’s Fund. In the context of The Decade of Roma inclusion 2005-‐2015, studying the perceptions of Roma young adults versus non-‐ Roma regarding their life satisfaction seems particularly relevant for policy makers in understanding on what matters in terms of well-‐being1. How do Roma young adults living in settlements perceive their current life satisfaction compared to the mainstream population? How can we explain their life satisfaction? Are the Roma young adults more optimistic or pessimistic about their future than non-‐Roma?
Over the last decade, subjective well-‐being has received growing interest from economists (Frey and Stutzer, 2002; Dolan et al., 2008). Empirical evidence shows that the self-‐reported data on life satisfaction are reliable, useful and comparable across countries (Senik, 2005). Life satisfaction is positively correlated with income, but progressively less significant in increasing well-‐being in developed countries (Easterlin, 2001; Clark et al., 2008). Unemployment, health status and family support have also a significant impact on life satisfaction (Di Tella and MacCulloch, 2006). In transitional and post-‐civil war countries
1 The Decade of Roma Inclusion 2005-‐2015 is an initiative organized by the World Bank, the European Commission, the UNDP and the countries of Central and South-‐Eastern Europe among others, to close the gap in welfare between Roma and non-‐Roma. See the documentation available at http://www.romadecade.org/.
where economic uncertainty may have more harmful consequences as people face very low standards of living, this topic has been little explored (Andren and Martinsson, 2006; Mitrut and Wolff, 2011). To the best of our knowledge, our study is the first to account for the potential role of Roma ethnicity on the subjective perception of individuals concerning their life satisfaction using two cross-‐country household surveys collected in the Balkans.
The lacuna on the Roma population in the literature is explained by the difficulty to find appropriate micro level data, some countries refusing to include questions on ethnicity in their national census or rejecting to register some specific ethnic group as a legitimate category. Another explanation is that Roma are distrustful towards the mainstream population and are reluctant to reveal their ethnicity for fear of discrimination (Ringold et al., 2005). The recent works of Kertesi and Kézdi (2011a, 2011b) on the ethnic gap between Roma and non-‐Roma in Hungary are insightful exceptions. Kertesi and Kézdi (2011a) analyze the ethnic employment gap after the post-‐communist transition between 1993 and 2007 and show that it is mainly driven by education. Kertesi and Kézdi (2011b) decompose the test score gap between Roma and non-‐Roma eighth graders in 2006. In terms of education and employment, the gap between Roma and the mainstream population is larger than the gap between African Americans and Whites in the United States.
BiH and Serbia as a context of this study are especially relevant, as they have significant proportions of Roma in their population. These two neighbouring countries also share a similar experience of transition from communist system to market economy and intense ethnic conflicts from 1991 to 1999 on the territory of former Yugoslavia. This has led to severe vulnerability of the population, especially for Roma people (Kertesi and Kézdi, 2011a, 2011b; O’Higgins, 2010). In that context, the MICS4 data provides a unique opportunity to study the life satisfaction of Roma young adults and non-‐Roma from a comparative perspective in the Balkans2. In each country, the survey was conducted on two different samples: a national sample representative of the whole population and a Roma sample representative of the population living in Roma settlements. Both for young women and men aged 15-‐24 years, each respondent indicates not only their current level of satisfaction with life overall, but also realized change and expectation in life satisfaction.
2 In the MICS4 data, there are Roma samples for three following countries: BiH, Serbia and Macedonia. However, there is no information on life satisfaction for the young men in Macedonia, which explains why we only focus on BiH and Serbia.
When comparing raw answers both in BiH and Serbia, we find that Roma young adults are less satisfied with life than non-‐Roma. However, once individual characteristics are controlled for, we find (more surprisingly) the opposite pattern: Roma young adults are on average more satisfied with their life than non-‐Roma. Education level and asset index are the most important factors behind the gap in life satisfaction between Roma and non-‐Roma. We also find that Roma young adults living in Serbia expect a better life within one year compared to non-‐Roma, the corresponding ethnic gap being insignificant in BiH.
The remainder of this paper is organized as follows. In the next Section, we provide background on Roma in BiH and Serbia. In Section 3, we present the MICS4 data and some descriptive statistics on current, past and expected life satisfaction. We describe our econometric methodology in Section 4. In Section 5, we study the determinants of life satisfaction and assess the ethnic gap in life satisfaction between Roma and non-‐Roma young adults. We discuss our results in Section 6. Section 7 provides a conclusion.
2. The context in BiH and Serbia
BiH and Serbia are interesting settings to study whether ethnic origin matters in comparative life satisfaction of young adults. Firstly, the Balkans are a relevant region to examine because of the high degree of diversity between ethnic groups. BiH and Serbia include different ethnicities, languages and religions, which were involved in civil wars on the territory of former Yugoslavia in the 1990s. The ethnic composition and economic disparity between groups still pose a challenge to these countries in the conditions of stability in a post-‐conflict context3.
Secondly, most of the Roma live in the Eastern Europe and Balkan Peninsula. While estimating the exact number of Roma is both difficult and controversial in these countries, BiH and Serbia have significant shares of Roma within their overall population. According to the estimates of the Council of Europe (in 2009), the percentage of Roma in the total population was around 1.1 per cent in BiH and around 8.2 per cent in Serbia4. These shares
are likely to increase in the future because of the high birth rates among the Roma population (European Commission, 2011). Nevertheless, data collection on the Roma
3 The ethnic cleansing during the wars in the 1990s changed the ethnic composition of the population in BiH and Serbia. Today the tensions are high across ethnic groups, especially at the border between Serbia and Kosovo (Duval and Wolff, 2015).
population is challenging. For instance, BiH recognizes three official ethnic groups (Bosniak, Serb and Croat) and excludes the others. Therefore, the Roma in that country are not registered as a legitimate ethnic group and have no ethnic minority status. Conversely, in Serbia, the Roma are recognized as an ethnic group with the Serbs, the Hungarians and the Bosniaks. Additional difficulties for researchers working on the Roma are that this ethnic group is not easily accessible and is distrustful towards the mainstream population.
Thirdly, the living conditions of Roma in BiH and Serbia have declined more severely than for other groups during the transition from communist system to market economy and the ethnic conflicts in the 1990s (Kertesi and Kézdi, 2011a, 2011b; O’Higgins, 2010). On the one hand, the breakup of Yugoslavia and the fall of communist regime were accompanied by high unemployment and impoverishment for the population. On the other hand, the civil wars between 1991 and 1999 resulted in infrastructure destruction, large numbers of victims and population displacement. Especially, many Roma were displaced either internally or abroad (Ringold et al., 2005). In such contexts, it appears relevant to study the subjective life satisfaction of youth in the post-‐war period. Today, BiH and Serbia are upper middle-‐income countries according to the World Bank, with a per capita gross domestic product of $8,200 in 2012 for the former and $10,900 for the latter. At the same time, these countries are still characterized by a lack of employment opportunities with high rates of emigration5.
Finally, the living conditions of the Roma have become an issue in negotiations for accession to the EU (European Commission, 2011)6. Specifically, BiH is a potential candidate to the EU while Serbia is a candidate county. In the context of enlargement, another challenge for the two countries is international migration. According to the World Bank (2011), the countries of former Yugoslavia represent large exporters of international migrants. For instance, BiH is currently in the top countries ranked by emigrants as percentage of population (38.9 per cent) in the world. The Roma emigration is definitively one of the most heated issues facing European countries.
3. Data and descriptive statistics
5 According to the World Bank Development Indicators in 2012, the total unemployment rate was 27.2 per cent in BiH and 19.2 per cent in Serbia.
6 The European Union accentuates the issue of ethnic minority protection and anti-‐discrimination in the Copenhagen criteria (European Commission, 2011).
3.1. The MICS4 data
We use the fourth global round of MICS surveys collected in Serbia in 2010 and in BiH in 2011 by the National Institute of Statistics of each country with the financial and technical support from the United Nations Children’s Fund7. In both countries, each survey comprises two distinct samples: a national sample representative of the whole population and a Roma sample representative of the population living in Roma settlements.
Our empirical analysis is based on the comparison between the national sample and the sample of Roma living in settlements. We assume that there is no respondent of Roma origin in the national sample. Two arguments give credit to this assumption. First, the small share of the Roma within the total population (especially in BiH, around 1%) suggests that the national sample will be essentially made of non-‐Roma respondents. Second, Roma do not live in the same places than non-‐Roma and are most often reluctant to be interviewed or to reveal their ethnicity for fear of discrimination, meaning that the likelihood of having Roma is the national sample is certainly very low8.
In BiH, 6,838 non-‐Roma households and 1,791 Roma households were interviewed. In Serbia, 6,885 non-‐Roma households and 1,815 Roma households were interviewed. The MICS4 survey was organized around the following four questionnaires: a household questionnaire, a questionnaire for individual women, a questionnaire for individual men, and a questionnaire for children under five. The individual adult questionnaires included information on objective variables like marital status, education or employment and on subjective perceptions of life satisfaction.
Both in the non-‐Roma and Roma samples, respondents indicated their satisfaction with respect to their current situation and also expectations and realized changes in their situation. However, these questions were asked only to respondents aged between 15 and 24. While it would have been of course better to have information on life satisfaction of all family members, the focus on life satisfaction of young women and men remains nonetheless very interesting and stimulating. Indeed, the Roma ethnic group is considered
7 The MICS is an international household survey program developed by UNICEF since the 1990s providing comparable data on the situation of men, women and children and measuring key indicators that allow countries to monitor progress towards the Millennium Development Goals. For further information on the MICS project, see the documentation available at http://mics.unicef.org/surveys.
as the youngest in Europe and providing a comprehensive picture of young adults’ life satisfaction in the Balkans is useful in contexts of post-‐civil wars and reconstruction.
Our main dependent variable is a commonly used indicator of subjective well-‐being, namely satisfaction with life. In the MICS4 survey, respondents were asked: “how satisfied are you with your life overall?”. Possible answers were “very satisfied”, “somewhat satisfied”, “neither satisfied, nor unsatisfied”, “somewhat unsatisfied”, “very unsatisfied”9.
Interestingly, the MICS4 survey offers the opportunity to account for some dynamic aspects of life satisfaction since it includes questions about past and expected life satisfaction (again only for the 15-‐24 age group). Concerning experienced change, the question is: “compared to this time last year, would you say that your life has improved, stayed more or less the same, or worsened, overall?”. Expectations are obtained from the following question: “in one year from now, do you expect that your life will be better, will be more or less the same, or will be worse, overall?”.
Using subjective questions about life satisfaction requires some comments as such data have been the subject of debates (Frey and Stutzer, 2002; Senik, 2005). Until recently, many economists were skeptical about the empirical content of subjective data, pointing to problems concerning psychological mechanisms, interactions with the surveyor or question formulation, among others. The situation is different nowadays, after a rapid growth in subjective data use. Many studies have shown that subjective questions were reliable and useful (Senik, 2005). As they stand, the MICS4 questions related to life satisfaction are well formulated and easy for respondents to understand.
The selection of young adults aged from 15 to 24 strongly reduces the sample size. In BiH, the sample comprises 3,053 individuals: 1,955 are non-‐Roma (64 per cent) and 1,098 are Roma (36 per cent). In Serbia, the sample comprises 3,248 observations: 1,891 are non-‐ Roma (58.2 per cent) and 1,357 are Roma (41.8 per cent). In what follows, we investigate the determinants of life satisfaction separately for each country as life satisfaction is expected to depend on local economic conditions.
3.2. The pattern of life satisfaction
9 To assist respondents in answering the questions on current life satisfaction, expectations and realized changes, cards with smiling faces were provided in the MICS4 survey.
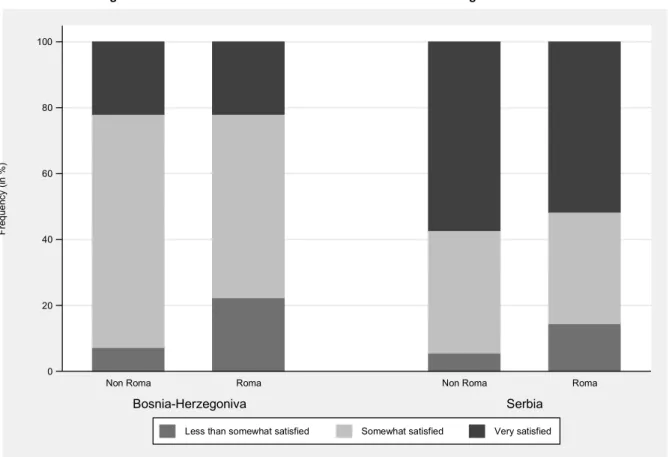
We begin with a description of the life satisfaction of young adults in the selected countries. In BiH, the proportion of individuals claiming that they are very satisfied with their life is 22.0 per cent, while it amounts to 51.8 per cent in Serbia. Conversely, the proportion of individuals being at best neither satisfied nor unsatisfied is 22.2 per cent in BiH and 14.4 per cent in Serbia10.
Next, we investigate whether there is any difference between Roma and non-‐Roma young adults in each country. According to Figure 1, the proportion of respondents being very satisfied is the same for non-‐Roma and Roma in BiH (22.0 per cent), while this proportion is slightly lower for Roma (51.8 per cent) compared to non-‐Roma (57.4 per cent) in Serbia. In BiH, the majority of people interviewed report being somewhat satisfied with their life, around 70 per cent for non-‐Roma and 56 per cent for Roma. Among non-‐Roma, the proportion of unsatisfied respondents is low both in BiH (7.3 per cent) and Serbia (5.5 per cent), while it is significantly higher among Roma young adults. 20.2 per cent of respondents in BiH and 14.4 per cent in Serbia claim that they are unsatisfied.
Insert Figure 1
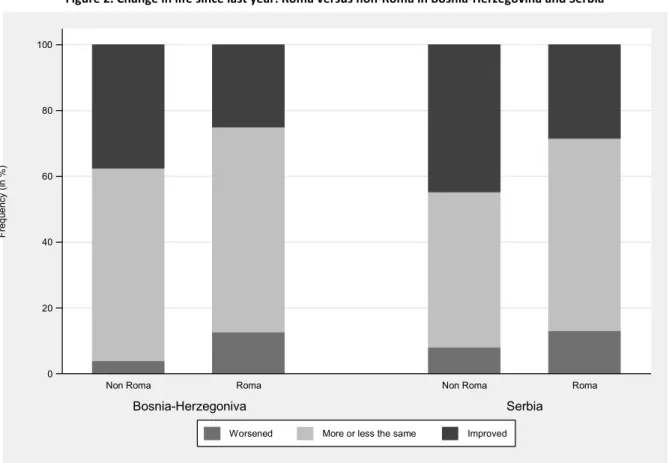
Besides perceptions on their current life satisfaction, respondents were also asked to assess how their life satisfaction has evolved over the last year. For most respondents, their satisfaction has not deteriorated over the last twelve months. This situation is reported by 7.1 per cent of respondents in BiH and 10.1 per cent in Serbia. However, we find significant differences between Roma and non-‐Roma young adults. As shown in Figure 2, the proportion of Roma claiming that their life satisfaction has worsened is 12.7 per cent among Roma against 3.9 per cent among non-‐Roma in BiH. The corresponding figures are respectively 8.0 per cent (Roma) and 13.0 per cent (non-‐Roma) in Serbia. At the same time, Roma respondents have a much a lower probability to claim that their life has improved, 25.1 per cent in BiH and 28.5 per cent in Serbia against 37.5 per cent and 44.8 per cent for non-‐Roma.
Insert Figure 2
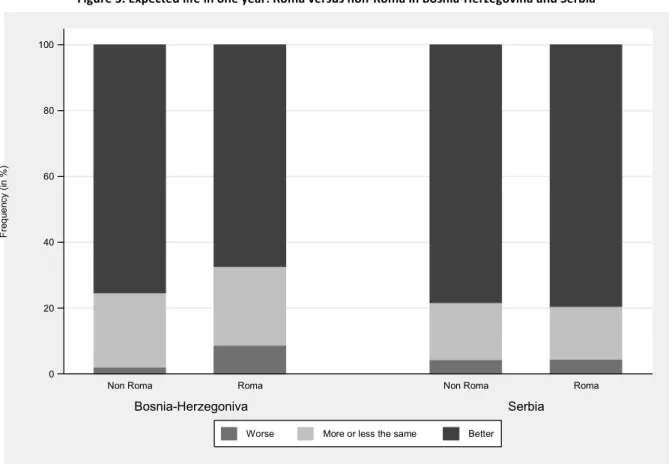
We have also investigated the pattern of expected changes in life satisfaction over the next 12 months. Young adults are rather optimistic about the future since 72.6 per cent
10 We decided to group the “neither satisfied nor unsatisfied”, “somewhat unsatisfied” and “very unsatisfied” answers given the low frequencies observed for the two lowest outcomes. In BiH for instance, the proportion of young adults somewhat unsatisfied is 1.7 per cent and that of adults very unsatisfied is 0.3 per cent.
of them expect a better life in one year from now in BiH and 78.9 per cent in Serbia. In both countries, very few of them believe that their life will be worse than their current situation in one year. When comparing answers from Roma and non-‐Roma, the situation depends on the country. As shown in Figure 3, both ethnic groups give very similar answers in Serbia. Conversely, Roma respondents are less optimistic than non-‐Roma in BiH. 75.4 per cent of non-‐Roma believe that their life will improve within one year, while the corresponding proportion is only 67.5 per cent for Roma.
Insert Figure 3
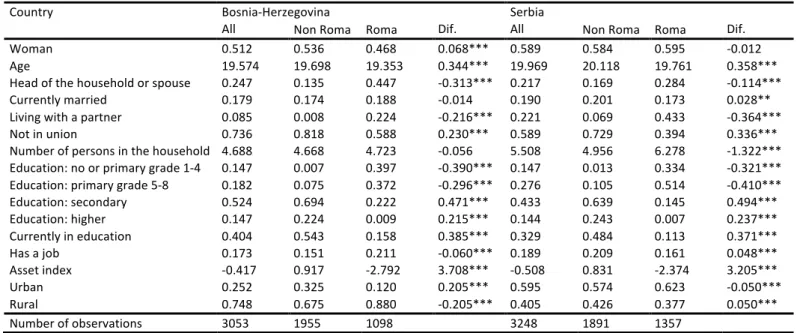
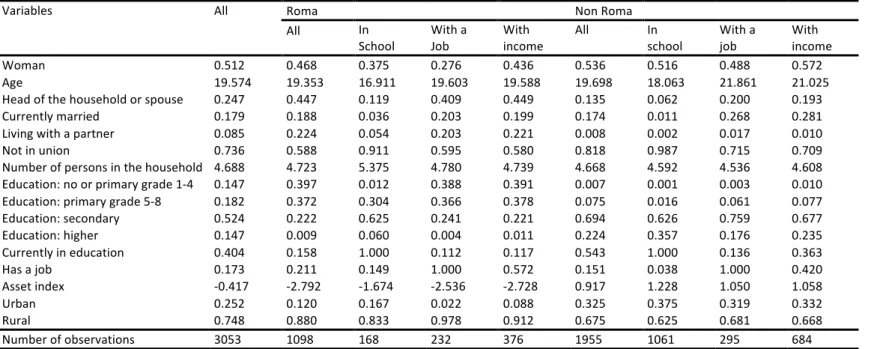
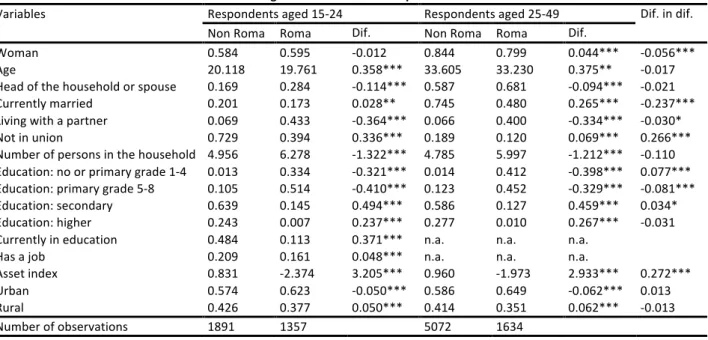
In Table 1, we provide a description of the different explanatory variables that we introduce in our regressions explaining life satisfaction. First, we account for basic demographic information like gender, age, marital status and household size. We also add a dummy variable indicating whether the young adult is the head of the household or its spouse. This covariate may be seen as a proxy of the home leaving decision as household heads and their spouses are expected to live by their own. Second, we introduce a set of socio-‐economic characteristics but there are data constraints. Specifically, we control for completed education, currently in school, having a job, asset index and rural versus urban location11. Unfortunately, given data constraints there is no way in the MICS4 surveys to
know whether the young adult is unemployed and there is also no information on income, either at the household or individual level.
Insert Table 1
Our samples are of comparable size in both countries, with 3,053 young adults in Bosnia-‐Herzegovina and 3,248 in Serbia. The proportion of Roma is slightly lower in the former country (36.0 per cent against 41.8 per cent). There are more men than women, especially in Serbia. In BiH, the proportion of women is significantly lower among Roma respondents (46.8 per cent), which is likely to be due to a higher likelihood of leaving the parental home for Roma young girls. This is consistent with the much higher proportion of head or spouse found among Roma in that country12. On average, Roma respondents are
more likely to be married or to live with a partner: 41.2 per cent in BiH against 18.2 per cent for non-‐Roma and 60.6 per cent in Serbia against 27.0 per cent for non-‐Roma.
11 Following Filmer and Pritchett (2001), we turn to a principal component to construct an asset index which is derived from asset ownership indicators. The method is implemented on country-‐specific samples pooling both Roma and non-‐Roma respondents, so that the average of the asset index is set to zero for each country.
There are substantial differences in the socio-‐economic characteristics of Roma and non-‐Roma young adults. Roma young adults living in settlements have achieved lower educational attainment. For instance, 39.7 per cent of Roma in BiH have not completed primary school, while the proportion is below one per cent among non-‐Roma. A similar situation is observed in Serbia (33.4 per cent against 1.3 per cent). Also, the likelihood of being currently in school is around 3-‐4 times higher for non-‐Roma in both countries. Concerning employment status, the proportion of people having a job is slightly higher among Roma (21.1 per cent) than non-‐Roma (15.1 per cent) in BiH, which is not the case in Serbia (16.1 per cent for Roma against 20.9 per cent for non-‐Roma). Given the large ethnic differences in enrollment rate, this suggests a high unemployment rate for Roma. Finally, the asset index is clearly unfavorable to Roma in both countries, which reflects the more difficult economic situation faced by this ethnic group.
To summarize, these descriptive results show that the Roma and non-‐Roma groups have very different demographic and socio-‐economic characteristics both in BiH and in Serbia. This is likely to explain why the self-‐assessment about current life satisfaction is lower among Roma compared to the mainstream population. In what follows, we present our estimation strategy to study the factors influencing the current, past and expected life satisfaction in BiH and Serbia.
4. Econometric methodology
4.1. A random effect ordered Probit specification
The level of satisfaction is measured by an ordered variable in the MICS4 surveys so that we rely on a latent variable econometric model to study the relative situation of Roma versus non-‐Roma young adults. A key feature is that all family members living in the household and aged between 15 and 24 were interviewed. Since we have repeated observations at the household level for a substantial proportion of families, we are able to account for unobserved heterogeneity at the household level in our regressions13.
For the presentation, let 𝑆!"∗ be a latent variable measuring the propensity for
respondent 𝑖 in family 𝑗 to be satisfied with current life. We rely on the following linear specification to explain the latent outcome 𝑆!"∗:
𝑆!"∗ = 𝛿ℝ
!" + 𝑋!"𝛽 + 𝜃!+𝜀!" (1)
with ℝ!" a dummy variable equal to one when the respondent is Roma and zero otherwise,
𝑋!" is a set of demographic and economic control variables, 𝛿 and 𝛽 are coefficients to
estimate, and 𝜃! and 𝜀!" are error terms. In (1), the term 𝜃! picks up the influence of the
unobserved family characteristics common to the young adults living in the household. This will include for instance parental economic resources for young men and women co-‐residing with their parents or parental subjective life satisfaction if there is some transmission of happiness across generations. Unobserved variables which are specific to children as well as measurement errors affecting child-‐specific variables are picked up by the residual 𝜀!"14.
The latent outcome 𝑆!"∗ is not observed in the MICS4 data. Instead, we have
information on the ordered level of current life satisfaction such that 𝑆!" = 1 when the
respondent is either “very unsatisfied”, “somewhat unsatisfied”, or “neither satisfied nor unsatisfied”, 𝑆!" = 2 for “somewhat satisfied” and 𝑆!" = 3 for “very satisfied”. For a given
level of satisfaction 𝑘 (with 𝑘 = 1,2,3), the relationship between 𝑆!"∗ and 𝑆!" is:
𝑆!" = 𝑘 if 𝜇!!! ≤ 𝑆!"∗ < 𝜇! (2)
In (2), the different 𝜇! correspond to threshold levels that have to be estimated jointly with
𝛿 and 𝛽. We set 𝜇! = −∞, 𝜇! = +∞ and assume that 𝜇!!! < 𝜇!. We suppose that there is
no correlation between the family specific heterogeneity term 𝜃! and the various
explanatory variables ℝ!" and 𝑋!", so that the corresponding model is a random effect
ordered Probit (Greene and Hensher, 2010)15. The probability for a respondent 𝑖 to report a
level of life satisfaction 𝑘 is Pr 𝑆!" = 𝑘 = Pr 𝜇!!! ≤ 𝑆!"∗ < 𝜇! . As it depends on the
unobserved family component 𝜃!, the likelihood of the model depends on the distribution of
𝜃! and is hence estimated using quadrature techniques (Butler and Moffitt, 1982; Frechette,
2001). For the sake of robustness, we will also report estimates from random effect Generalized Least Squares regressions as the estimated coefficients may directly be interpreted as marginal effects.
4.2. A decomposition of differences in life satisfaction
14 These residuals are supposed to follow a normal distribution such that 𝜃
!~𝑁(0; 𝜎!!) and 𝜀!"~𝑁(0; 1). The
variance of 𝜀!" is set to 1 for normalization purpose.
15 We are unable to estimate fixed effect ordered models with the MICS4 data since this would exclude the dummy Roma, this covariate being invariant at the household level.
The ordered estimates allow us to further examine the gap in life satisfaction between Roma and non-‐Roma young adults. Specifically, we rely on the Blinder-‐Oaxaca decomposition which was originally proposed to study gender differences in labor market outcomes (Blinder, 1973; Oaxaca, 1973). Briefly, the mean difference in wages between men and women was divided into one component measuring differences in characteristics and one component measuring differences in the return to these characteristics16. We turn
to such decomposition to analyze the ethnic gap in life satisfaction in BiH and Serbia.
Dropping 𝑖 and 𝑗 as subscript to ease the notation, we suppose first that the latent level of satisfaction 𝑆∗ is observed. For each group ℝ, the level of satisfaction is expressed as
a linear function of covariates: 𝑆ℝ∗ = 𝑋
ℝ𝛽ℝ+ 𝜖ℝ (3)
with 𝜖ℝ a perturbation which encompasses both a household specific heterogeneity term
and a pure random perturbation. The gap between non-‐Roma (ℝ = 0) and Roma (ℝ = 1) may be decomposed in the following way17:
𝑆ℝ!!∗ − 𝑆
ℝ!!∗ = 𝑋ℝ!!− 𝑋ℝ!! 𝛽ℝ!!+ (𝛽ℝ!!− 𝛽ℝ!!)𝑋ℝ!! (4)
In (4), the first term on the right-‐hand side 𝑋ℝ!!− 𝑋ℝ!! 𝛽ℝ!! corresponds to
differences in explanatory variables between Roma and non-‐Roma individuals. For instance, satisfaction will differ between both groups if Roma young adults have achieved lower education or have a lower probability of having a job. The second term (𝛽ℝ!!− 𝛽ℝ!!)𝑋ℝ!!
measures differences in the coefficients associated to these characteristics. For instance, the influence of education on life satisfaction may depend on ethnicity and this will have an impact on the gap in satisfaction between Roma and non-‐Roma young adults.
When the dependent variable is continuous, decomposing the difference 𝑆ℝ!!∗ −
𝑆ℝ!!∗ is easy to implement since it requests only estimates from linear regressions for each
group. The problem is more complex with a discrete dependent variable since the OLS estimates can no longer be used in the decomposition18. A few studies have recently focused on the Oaxaca-‐Blinder approach to decompose group differences using non-‐linear
16 This unexplained part of the gender gap has been interpreted as a measure of discrimination against women. 17 As emphasized in Oaxaca and Ransom (1994), there are several ways to decompose the difference 𝑆
ℝ!!∗ −
𝑆ℝ!!∗ . In (4), we introduced a fictitious group of individuals having the characteristics of Roma 𝑋
ℝ!!, but do as if
the influence of these covariates on life satisfaction was those experienced by Roma young adults (𝛽ℝ!!). An
alternative decomposition is to consider the group of individuals endowed with the characteristics of non-‐ Roma 𝑋ℝ!!, but the coefficients associated to these variables are those of the Roma group (𝛽ℝ!!).
18 In particular, the conditional expectation 𝐸(𝑆
models (Fairlie, 1999; Yun, 2004; Bauer and Sinning, 2008). However, these generalizations based on the sample means of estimated functions for non-‐linear specifications appear somewhat problematic to identify the “discrimination” component (unexplained part) of the decomposition (Bazen and Joutard, 2013).
Instead of working on the conditional expectation 𝐸(𝑆ℝ|𝑋ℝ), we rely on the strategy
proposed in Wolff (2012) which consists of a decomposition of the gap in life satisfaction using the latent outcome 𝑆ℝ∗ and the standard Blinder-‐Oaxaca linear decomposition. The
main difficulty is that the latent values of 𝑆ℝ∗ are unobserved. A solution is to rely on the
simulated residuals methodology described in Gouriéroux et al. (1987). We proceed in the following way when turning to the MICS4 data. First, for each group ℝ = 0 and ℝ = 1, we estimate separate ordered Probit regressions from which we obtain 𝛽ℝ and 𝜇ℝ,!. Then,
residuals 𝜖ℝ are drawn from the normal distribution 𝑁(0; 1). For a given outcome 𝑆ℝ = 𝑘,
𝑆ℝ∗ = 𝑋
ℝ𝛽ℝ+ 𝜖ℝ is the first value satisfying the following condition 𝜇ℝ,!!!≤ 𝑆ℝ∗ < 𝜇ℝ,!.
Finally, the linear Oaxaca-‐Blinder decomposition is applied to the difference 𝑆ℝ!!∗ − 𝑆ℝ!!∗ .
5. Results
5.1. The determinants of current life satisfaction
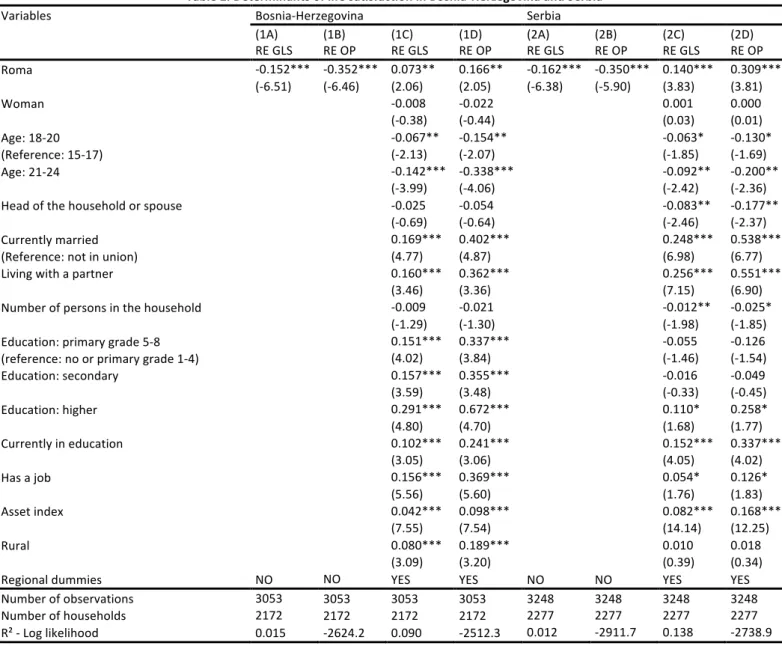
Given differences in economic situation and context in BiH and Serbia, we estimate separate ordered models for each country. Random effect estimates both from linear and ordered regressions results are reported in Table 2 for the current level of life satisfaction.
Insert Table 2
As a preliminary step, we estimate regressions that only control for ethnicity (models 1A and 1B for BiH, 2A and 2B for Serbia). In doing so, we neglect the potential influence of individual characteristics on life satisfaction. Both in BiH and Serbia, being Roma is associated with a lower level of life satisfaction on average. The GLS estimates provide an order of magnitude concerning the role played by ethnicity. The coefficients associated to the Roma dummy are equal to -‐0.152 (t=-‐6.51) for BiH and -‐0.162 (t=-‐6.38) for Serbia. Since the average level of satisfaction amounts to 2.093 and 2.458 in these countries, this means that the level of satisfaction is 7.26 per cent lower in BiH and 6.59 per cent lower in Serbia for Roma respondents compared to non-‐Roma respondents. As shown below, this lower
satisfaction in life observed among Roma young adults living in settlements is due to some composition effect of the respondents.
In models (1C) and (1D) for BiH and (2C) and (2D) for Serbia, we introduce individual characteristics as exogenous explanatory variables. Our main conclusion is that controlling for the role played by observables characteristics leads to opposite results concerning the influence of ethnic origin. With respect to our previous estimates, we find that the level of life satisfaction is higher for Roma than for non-‐Roma both in BiH (at the 5 per cent level) and in Serbia (at the 1 per cent level). This inversion in the role of the Roma ethnicity is due to the fact that Roma respondents have on average less favorable characteristics compared to non-‐Roma. Using estimates from GLS models, we now find that life satisfaction increases on average by 3.5 per cent in BiH and by 5.7 per cent in Serbia when the respondent is of Roma origin.
As shown in Table 2, most of selected covariates have a very similar influence on life satisfaction in both countries. While there is no difference between men and women, life satisfaction decreases with age and is higher among respondents currently married or living with a partner19. Our results show a positive correlation between socio-‐economic status and life satisfaction. In Serbia, life satisfaction is significantly higher only for respondents with more than secondary education, while the various education levels are all positively correlated with life satisfaction in BiH. Being currently in school is associated with higher levels of satisfaction. This is also the case for those claiming that they have a job, although the corresponding coefficient is only significant at the 10 per cent level in Serbia20. In both countries, young men and women are more likely to be satisfied with their life when they live in a household characterized by a high asset index.
In the ordered models, we have assumed fixed threshold values both for Roma and non-‐Roma in each country. However, it could be argued that these two groups do not necessarily have the same scale in mind when assessing their life satisfaction. For instance, being very satisfied in life may not have exactly the same meaning for each ethnic group. As
19 Also, being the head of the household does not influence life satisfaction. While young adults are expected to be more satisfied by living by they own, they will certainly face more financial constraints compared to children living with their parents. Unfortunately, we are not able to account for incomes in our regressions due to data constraints.
20 The effect of having a job on life satisfaction is likely to be underestimated as the reference group includes both unemployed and out of the labor force young adults. We are not able to account for unemployment in our regressions due to data constraints.
a consequence, we have attempted to relax the assumption of parallel lines of the ordered model by allowing for thresholds that vary over the observations as a function of ethnic group. The appropriate specification is now a generalized ordered model (Greene and Hensher, 2010; Williams, 2006). Following Pfarr et al. (2011), random effects are introduced in order to account for unobserved family heterogeneity since we have repeated observations at the household level.
Our results, not reported, show that both in BiH and Serbia, being Roma makes it more likely that the respondent will report the highest level of satisfaction (very satisfied) once individual characteristics are controlled for. The coefficient associated to the Roma dummy in the second threshold of the generalized ordered model is equal to 0.464 (t=5.21) in BiH and 0.417 (t=4.94) in Serbia, respectively. Again, this stands in contrast with the raw difference in life satisfaction, which was reported in Figure 1. This indicates that it is very important to account for observed heterogeneity since Roma have less favorable individual characteristics21. Overall, the generalized ordered estimates confirm that Roma respondents
living in settlements are more likely to be very satisfied with their life.
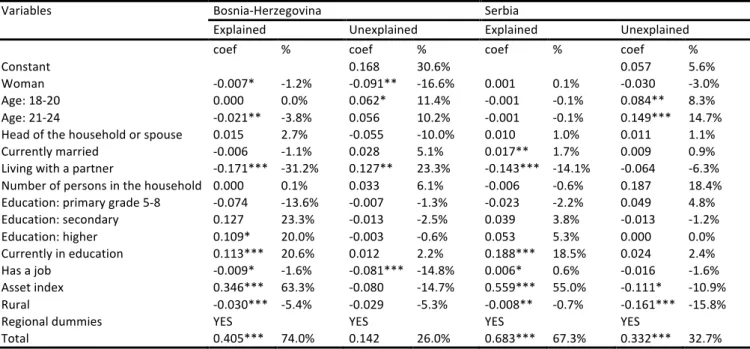
5.2. A Oaxaca-‐Blinder decomposition of current life satisfaction
Next, using the ordered estimates reported in Table 2, we implement the Oaxaca-‐ Blinder decomposition following the methodology described earlier. Our results are presented in Table 3.
Consider first the case of BiH. Overall, the gap in life satisfaction between non-‐Roma and Roma is equal to 0.547. We find that 74.0 per cent of the difference between both ethnic groups is due to differences in their observable characteristics. In Serbia, 67.3 per cent of the overall difference in life satisfaction (which amounts to 1.015) is explained by the fact that the Roma and non-‐Roma young adults interviewed in the survey do not have the same characteristics. So, in both countries, the gap in life satisfaction would be much lower had the two ethnic groups of young adults the same demographic and socio-‐economic characteristics. Nonetheless, the contribution of the unexplained component (26.0 per cent
21 When estimating generalized ordered models without any covariates, we find negative coefficients for the Roma dummy for the upper threshold value. The Roma coefficient is significant at the 1 per cent level only in Serbia (the coefficient remains insignificant in BiH).
and 32.7 per cent, respectively) indicates that some observable characteristics do not have the same influence on the satisfaction outcome among Roma and non-‐Roma.
Insert Table 3
A detailed decomposition sheds light on the contribution of each covariate to both the characteristic (explained) and structure (unexplained) effects. In BiH, we find that education and assets are the most influential factors to the explained component of the decomposition. For instance, the difference in satisfaction would be reduced by 63.3 per cent if Roma and non-‐Roma young adults were characterized by the same asset index. In the same vein, the gap in life satisfaction would be reduced by one-‐fifth if Roma and non-‐Roma were reporting the same likelihood of being currently in education. The situation is very similar in Serbia where the most important covariate is the asset index (55.0 per cent) followed by being currently in education (18.5 per cent). In both countries, the contribution of living with a partner to the explained term of the decomposition is negative and significant.
Conversely, a look at the structure effect shows that the role of covariates differs in both countries. At the same time, the number of significant variables in the decomposition remains limited. In BiH, the covariates that contribute the most to the unexplained component of the difference in life satisfaction are gender (-‐16.6 per cent), living with a partner (23.3 per cent) and having a job (-‐14.4 per cent). Consider for instance the case of gender. Estimates from sex-‐specific regressions show that life satisfaction is higher for young women among Roma, while the reverse pattern is found among non-‐Roma. Thus, the ethnic gap in life satisfaction would have been reduced had the effect of gender been the same for Roma and non-‐Roma. In Serbia, the most influential covariates to the structure effect are age, asset index and living in a rural area.
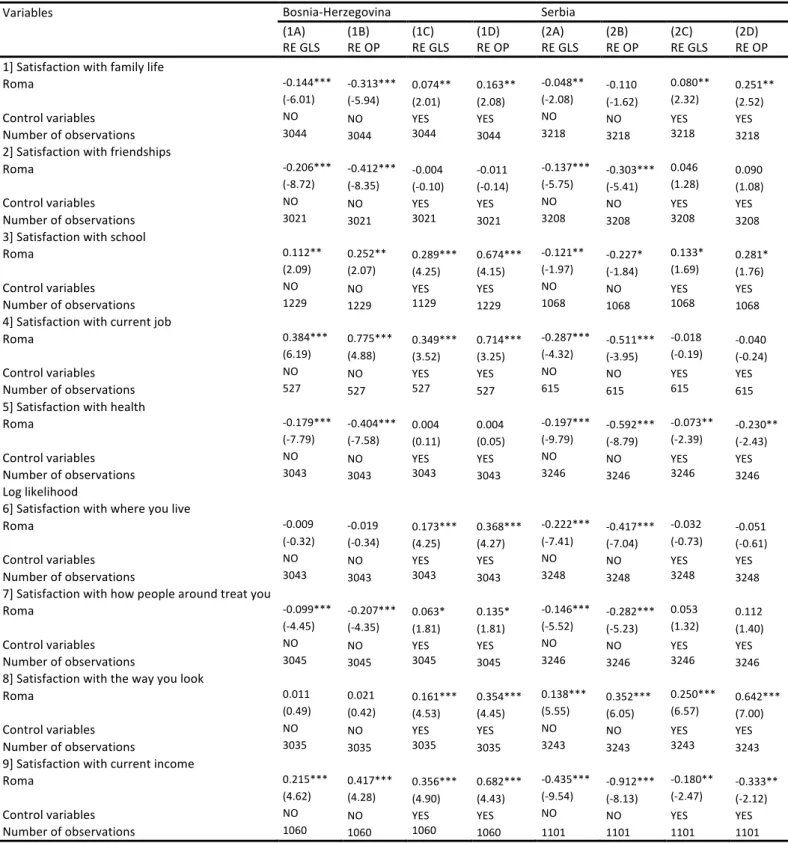
5.3. Ethnicity and detailed aspects of life satisfaction
So far, we have shown that Roma living in settlements were more satisfied with their life than non-‐Roma once we account for the fact that Roma come more often from disadvantaged backgrounds. As the life satisfaction outcome may be seen as a composite indicator, we now attempt to further examine the role played by specific components contributing to life satisfaction.