HAL Id: halshs-01500643
https://halshs.archives-ouvertes.fr/halshs-01500643
Preprint submitted on 3 Apr 2017HAL is a multi-disciplinary open access archive for the deposit and dissemination of sci-entific research documents, whether they are pub-lished or not. The documents may come from teaching and research institutions in France or abroad, or from public or private research centers.
L’archive ouverte pluridisciplinaire HAL, est destinée au dépôt et à la diffusion de documents scientifiques de niveau recherche, publiés ou non, émanant des établissements d’enseignement et de recherche français ou étrangers, des laboratoires publics ou privés.
A Sustainability Index of Mining Countries
Issaka Dialga
To cite this version:
EA 4272
A Sustainability Index of
Mining Countries
Issaka Dialga *
2017/09
(*) LEMNA - Université de Nantes
Laboratoire d’Economie et de Management Nantes-Atlantique Université de Nantes
Chemin de la Censive du Tertre – BP 52231 44322 Nantes cedex 3 – France http://www.lemna.univ-nantes.fr/ Tél. +33 (0)2 40 14 17 17 – Fax +33 (0)2 40 14 17 49
Docum
ent
de Tra
vai
l
W
or
kin
g P
ape
r
1
A Sustainability Index of Mining Countries
Issaka DIALGA
LEMNA, Laboratory of Economics and Management of Nantes-Atlantique Section Economics
Contacts: DIALGA Issaka, [email protected] Chemin de la Censive du Tertre, 44322 Nantes cedex 3, France Tel: +336 69 32 87 67
2
Abstract
This paper discusses the issue of Sustainable Development (SD) in countries with abundant natural resources with the aim to construct a Sustainability Index of Mining Countries (SIMC) based on the Hartwick's (1977) weak sustainability theoretical framework and the Brundtland et al. (1987) SD’s vision. The specific studies on mining and Top down/ Bottom-up approach allow us to identify five dimensions of sustainability of mining countries namely an economic dimension, a social dimension, an environmental dimension, a transverse dimension and a dimension involving governance, political and institutional issues. Each dimension is declined into measurable indicators, and then, the indicators are weighted and aggregated. An implementation of the constructed tool with Burkina Faso and Niger data reveals a dichotomy between perceived rents and development indicators. A sensitivity and robustness analysis of the SIMC with other development indicators confirms the strength of the tool.
Keywords: Top down/ Bottom-up approach; Weak sustainability; Environmental cumulative impacts; Tool for decision making; Mining country, Composite index, Burkina Faso; Niger
3
1. Introduction
The countries with exhaustible natural resources (gas, oil, diamonds, gold, uranium ...) face a major issue: how to reconcile the operation of an exhaustible resource with the vision of sustainable development as defined by Brundtland et al. (1987)1? Specifically, how to ensure a sustainable extraction of exhaustible resource? How to minimize the cumulative negative impacts of the extraction both on the environment and local communities? How do the rents from the extraction of exhaustible resource improve the living conditions of local people? How to ensure the sustainability of a harmonized development after the exhaustion of the resource? The answers to all these questions can be synthesized using an index that assesses the level of sustainability of exhaustible natural resources countries. This paper aims to develop a Sustainability Index of Mining Countries2 (SIMC) applied to Burkina Faso and Niger. The remainder of the paper is organized as follows: Section 2 describes the approach used to build the SIMC. Section 3 establishes the theoretical framework of the index. This section identifies the dimensions of Sustainable Development (SD) in the context of mining countries and defines the individual indicators for each dimension. Section 4 describes the data collection method, the nature of the collected data and the sources used for the collection of such data. Section 5 discusses the choice of normalization, weighting and aggregation of the composite index (CI). In Section 0, we perform an analysis of robustness and validity of the SIMC. Section 7 concludes by recalling the main outcomes, lessons learned and limitations of the study.
2. Methodology
The construction of the SIMC is based on the so-called Top down bottom up approach. This approach mobilizes academic knowledge, professional experiences and life experience of
1 In the Brundtland et al. (1987) report, this vision establishes that development is said sustainable when it allows the satisfaction of basic needs for the present generations without compromising the ability of future generations to meet their own needs.
2 According to the Natural Resource Governance Institute, a country is said mining country when the income from the exploitation of mining resources contributes to at least 25% to the GDP of the country, or export revenues or the Budget of the State. From this criterion, Burkina Faso and Niger are mining countries insofar as the gold mining contributes to the export earnings of the country to the tune of 62.77% and 58% in budget of the State. In Niger, the mining of uranium provides 80% of the state budget. This contribution represents 70% of export earnings according to statistic institutions of both countries.
4
citizens. In the CIs area, the top down bottom up approach defines a set of candidate3
indicators (from the literature) on the requirements of SD and issues related to the exploitation of mining resources. The candidate indicators are grouped by themes related to issues of development and exploitation of mining resources (see Survey form in appendix). The identified themes are submitted to appreciation through a field survey. Participatory survey involved four categories of development actors: policy makers, mining companies, NGOs and citizens. The central government and local authorities participate in the survey through their technical and specialized services structures such as Ministry of Environment and SD, Ministry of Economy, Ministry of Mines, Petroleum and careers, Department of Child Protection, Ministries of agriculture and livestock, Directions of statistical studies, Directions of studies and planning, Design bureaus and environmental impact assessment. Mining companies are represented by Chamber of Mines of Burkina Faso and civil society organizations via associations of defense of human rights, environment and development. Citizens and local residents close to mining exploitation are also involved. The survey also includes three key open questions. These questions are intended to enable participants in the survey (176 participants) to response about the expectations, reflections in connection with both development and mining activities in their countries that would not be identified by the literature. Participants evaluate the relevance of the identified themes on a scale of 0 to 9 in where 0 indicates that the identified theme is not important at all and 9 is quite important (see section III of the Survey form). The stakeholders also involved in the choice of indicators weighting through the so-called the Budget Allocation Process (BAP) weighting approach described in Section 5. After the field survey, we proceed to a reforming of initial indicators. Indicators for which the themes were considered not important at all are excluded. We also perform lexical analysis of participant responses. Lexical analysis helps us to detect new emerging themes. Such themes are subsequently declined into measurable indicators.
3. Theoretical framework, dimensions and sub-indicators identification
3.1. Theoretical framework
The construction of the SIMC is based on the SD vision proposed by Brundtland et al. (1987), which still meets the basic needs of the present generations and ensures the ability of future
3 They are called candidate indicators in the sense that after the field survey, we reframe the initial set of indicators. During this realignment, we eliminate the indicators deemed irrelevant by the stakeholders. We also undertake a restatement of some initial indicators when these are not easily understood by the involved stakeholders.
5
generations. The issue of this kind of development in connection with the operation of a non-renewable resource is organized around the Hartwick's (1977) theoretical framework. The author considers that the countries which rely heavily on rents from the extraction of non-renewable resources can register on a sustainable development dynamic called weak sustainability. The author develops a rule of that weak sustainability, which stipulates that countries with exhaustible natural resources can be on a sustainable path as soon as all the rents from the extraction of non-renewable resource are reinvested in reproducible capital such as physical capital (machines), and social capital (education, health, institutions, governance).
6
Figure 1-The SIMC theoretical framework
Perfect substitutability one way
Weak substitutability &reciprocal
Ressources Minières
I1 Social Dimension
I2
In
I3
Weak substitutability & reciprocal GPI Dimension I1 I1 In Possible compensation In I3 I2 I3
SIMC
Transverse DimensionWeak substitutability & reciprocal
Weak substitutability & reciprocal
I1
I2 I1
I3
In
In
Weak substitutability & reciprocal
I3 I2 Source: Author Economic Dimension Environmental Dimension Mining resources I2
7
The SIMC’s theoretical framework is illustrated by Figure 1. There is a perfect one-way substitutability between mining resources (natural capital) and the five dimensions of the SIMC. The perfect substitutability is due to the fact that the reinvestment of the entire mining revenue (Hartwick 1977 rule) improves the performance of the five pillars of development. However, it is not possible to reconstitute the mining resource stock after its exhaustion. We postulate that the indicators within the same dimension may be substitutable, i.e., it is possible to compensate the loss of an indicator by improvement of another indicator. By contrast, the substitutability is imperfect or limited between dimensions / pillars of the CI as each pillar reflects a different reality of this complex concept.
3.2. The SIMC’s dimensions and sub-indicators
According to SD vision of Brundtland et al. (1987), Hartwick (1977) weak sustainability theoretical framework and studies 4 on mining issues and the involvement of local development actors across the field survey, we identify five key dimensions of sustainability of mining countries. In that way, we identified two additional dimensions: a transverse dimension and governance, political and institutional dimension. The three traditional dimensions of SD are included: the economic dimension, the environmental dimension and the social dimension.
The economic dimension of the SIMC is declined into four indicators: (i) Resource exploitation Profitability Indicator (RPI) is defined as the ratio measured by mining revenues paid to the state and local authorities, the amount of social achievements for the benefit of local people and net5 profits of mining companies in the country. (ii) Household Purchasing Power Indicator (PPI) is calculated from the evolution of the country's household income and the evolution of inflation rate in the country. (iii) Rural Development Indicator (RDI): the rural sector (agriculture and livestock) has been identified as a sector that employs more labor force of the country and is able to replace the mining sector after the exhaustion of the resource. It is also a structuring sector (Irz et al. 2001). The RDI is defined as the share of the state budget and the domestic credit that feed the rural development fund and in proportion to
4 Reader can find more details on mining case studies in Carney (1998); Hausmann and Rigobon (2003); Hugon (2009); Hilson (2010); Andersen and Aslaksen (2008); Van der Ploeg (2011); Arezki, Gylfason, and Sy (2012); Jensen and Wantchekon (2004); Auty (2001); Chen et al. (2010); Papyrakis and Gerlagh (2004); Bolt et al. (2005); Sba-Ecosys-Cedres (2011); Reed, Fraser, and Dougill (2006); Kaufmann, Kraay, and Mastruzzi (2009); Brollo et al. (2010); Frankel (2010); Oxfam (2013); Geiregat and Yang (2013); Bardhan (2014) et Dialga (2015). 5 The turnover of mining companies deducted from taxes, amortization of mining investment, interest rates of loan repayment, the amount of social achievements made by mining companies.
8
the rural population regarding to the total population. (iv) Public debt sustainability indicator (PDSI) is set to assess the ability of the economy to cope with the state borrowing. This indicator is also used to ensure that existing loans do not compromise the leeway of future generations (Dialga 2015). It is defined as the ratio per capita GDP and public debt per capita. In the social dimension, stakeholders and literature have defined five individual indicators, which are: (i) Intra-generational equity indicator (IGEI), (ii) Intergenerational Equity Indicator (IEI), (iii) Human Capital Indicator (HCI), (iv) Altruism and Solidarity Indicator (ASI) and (v) Children well-Being Indicator (CBI). The IGEI uses the CPIA-Country Policy and Institutional Assessment indicators from the World Bank. They reflect the efforts in equal opportunity (access to the labor market, justice, public services) and gender equality. The IEI is defined as the ratio between expenditure and investments for immediate needs and long-term investments, i.e., whose positive effects are observed beyond one generation. The ASI is the share of migrant remittances and relief funds and solidarity in household income. The CBI reflects the children's living conditions in the country and specifically in areas of mining. This index is constructed from data on physical child labor and their residential environment (access rate to drinking water, sanitation utilization). The HCI is derived from the Human Development Index (HDI) sub-indicators namely education and health indices.
We define three environmental indicators including (i) Environmental Compensation Indicator (ECI), (ii) Resource Sustainability Indicator (RSI) and (ii) Eco-Production Indicator (EPI). The ECI is the ratio of green6 investment and environmental damage caused by mining. The resource sustainability indicator gives an idea of leeway for the State and future generations, given the stock of mining resources remaining and the total stock proven over the country.
Regarding to the transverse dimension, two indicators are defined notably both indicators which overlap with other dimensions of the SIMC. The first indicator is Mining sector Employability Indicator (MEI) defined as the ratio between the number of jobs created by the mining sector per unit gross revenue and total employment of the economy reported to the country's GDP. Employment is at the crossroads of the economy and social in the sense of self-fulfillment (Dubois 2009; Ballet, Dubois, and Mahieu 2012; Clément, Douai, and Gondard-Delcroi 2012).The second one is the Technology Access Indicator (TAI) due to its
6 Green investment refers to investment in cleanup technologies, resource optimization used in the mining extraction, wastewater treatment, alternative technology to cyanide and mercury, etc.
9
catalyst role in the achievement of the other indicators (Cherchye et al. 2008; OECD and JRC 2008). The access to technology allows more environmentally friendly production (environmental dimension), optimizes the use of resources (economic dimension), improves working conditions in the company and strengthens family ties, social and professional ( social dimension), improves governance by the possibility of citizen control, synchronization services of the public administration, reduces direct contact with users of public services and officers. All these benefit effects reduce the risk of corruption (the fifth dimension of the CI). The Governance, Political and Institutional (GPI) dimension is composed by five indicators related to political issues, governance, and institutions. Indeed, we have (i) the Institutional and Political Stability Indicator (IPSI) which reflects the quality and efficiency of institutions and the stability of political regimes in the country. (ii) Resource Governance Indicator (RGI) is defined to assess the resource management method in the country. The values for this indicator come from the Natural Resource Governance Institute publications. (iii) The National Sovereignty Index (NSI) is a simple average of two sub-indicators: an index of sovereignty on the exploited resource (SRI) (share of the state and national enterprises in the total shares of mining companies) and a monetary sovereignty indicator (MSI) revealing the limited degree of power of the two countries in the definition of monetary policies in favor of development of their populations (Agbohou 1999; Nubukpo and Tinel 2016). (iv) Corruption’s Absence Indicator (CAI) based on the Transparency International publications is defined in order to reveal the level of integrity and sound management of mining rents in both countries. (v) The National Security Indicator (NSI) reflects the risk of conflict, the level of peace, human rights in the mining countries and the country's ability to deal with these contingencies. One of resource curse's manifestations is the permanent conflicts in areas with mining activities (Auty 2001; Hugon 2009; Van der Ploeg 2011; Busse and Gröning 2013). The construction of this indicator required the use of variables such as the level of equipment of the national army, the number of displaced people to conflict pattern, the number of political prisoners, etc. The synthesis of the SIMC’s dimensions and the associated individual indicators is given in Table 5 in the Appendix.
10
4. Data collection and sources
The implementation of the SIMC requires both primary data and secondary data7. The collection of primary data through field survey mainly concerns the weight to assign to each dimension of the CI in the aggravation phase. Indeed, the field survey allows assigning the candidate indicators to the various actors of development for evaluation. The respondents access each indicator identified by assigning a value of appreciation (see Survey form in appendix) corresponding to the relative importance of the issue in terms of sustainable development that the indicator represents. As the SIMC aims to access the sustainability at country level, it is necessary to ensure the representativeness of the study sample. Burkina Faso with 17.8 million in 2014, 53% of population is women, 46.2% are young i.e., less than 15 years old. 86% of people live in rural areas and engaged in two main sectors: agriculture and livestock8. In Niger, 50.6% of people (17.12 million people in 2014) are women. Young people represent 49.2% of the total population and 79% of Nigerien live in rural areas and do, as main activity, land work. These statistics help us to calibrate our sample.
Secondary data come from both national, international statistics institutes and mining companies’ reports 9. The main sources mobilized are: Burkina Faso Statistics and Demographic National Institute, Niger National Statistic Institute, Statistic department of Mine, Petroleum Ministry, Ministry of Economics and Finance of both countries. The international statistic institutes are mainly African Development bank, World Bank, Revenue Watch Institute, Statistical Yearbook, UNPD, UNESCO, UNICEF, Extractive Industries Transparency Initiative, Transparency International, Perspectives Monde, Economist Intelligence Unit and IMF.
The environmental data are estimated. Using mining companies’ yearly reports, Leduc and Raymond (2000); Field, Kirchain, and Clark (2000); Levine, Gloria, and Romanoff (2007) and Sba-Ecosys-Cedres (2011) whose studies refer to the environmental cumulative damages, we define a computable function as follows:
7 Primary data: data from field survey; Secondary data: data compiled by national or international institutions or statistical data from government administrations.
8 Data sources: National Institute of Statistics and Demography (NISD-Burkina), NIS-Niger
9 Kiaka Gold Sarl (2014); SOMAIR-Société des Mines de l’Aïr (2012); SOMINA-Société des Mines d’Azélik (2014); COMNAK-Compagnie Minière d’Akouta (2012); Plan African Minerals LTD (2014); SEMAFO Burkina SA (2013); Midas Gold Sarl (2013); Endeavour mining-Avion Gold Burkina Sarl (2014); Bissa Gold SA (2014); Ampella Mining Limited (2013); IAM Gold Essakan SA (2013); Gryphon Minerals Limited (2014).
11 t t n t t n t t t t t a I r r I a I (1 ) ) 1 ( 0 0 + ∆ = + ∆ =
∑
∑
= = − (1) Where: tI is the cumulative impact at t ;
t
I
∆ the impact attributable to the operations of period 𝑡𝑡;
ris a capitalization10 rate. It is indexed to public investments rate. Since the environmental
impacts are assessed in monetary terms (current value of the currency), it is important to capitalize the amounts of past impacts.
t I t I of reduction t at impact generated year t impact of reduce the effort to t a ∆ ∆ − = −
=1 1 is the net impact
accumulation. The coefficient
t
a is an impact's multiplier that takes into account the
aggravating nature of cumulative impacts of past years and their impact on the environment, biodiversity and local communities. If no action is taken, reducing the effort of the impact is zero and a is 1. The impacts of the previous year’s activities are added in full to those of the t
current year and so on. In contrast, if the remediation efforts are equivalent to the generated impacts, are zero, this implys a level of zero impact for the year.
5. Normalization, Weighting and Aggregation
5.1. Normalization step
The normalization of individual indicators is a mandatory step of the CIs construction. This step aims to unify the units of measure of core indicators. For the SIMC, this mandatory step is overcome. Indeed, the basic indicators, summarized in Table 5, are neutral in units’ measurement by definition. In other words, all the indicators are performance ratios defined by 𝑆𝑆𝑆𝑆 = 𝑉𝑉𝑖𝑖𝑖𝑖
𝑉𝑉𝑚𝑚𝑚𝑚𝑚𝑚𝑖𝑖 (2),
where:
12
𝑆𝑆𝑆𝑆 is the normalized sub-indicator, 𝑉𝑉𝑖𝑖𝑖𝑖 is the initial variable 𝑗𝑗 for the entity 𝑖𝑖 and 𝑉𝑉𝑚𝑚𝑚𝑚𝑚𝑚𝑖𝑖 is the
maximum value reached by 𝑗𝑗. Values of scaled ratio range from 0 to 1. Accordingly,
(
1)
%100 −SI indicates the remaining effort to do to be in 𝑉𝑉𝑚𝑚𝑚𝑚𝑚𝑚𝑖𝑖. Nevertheless the merits are presented, one can discuss the sensitivity of the results due to the change of method. Does a redefinition of the basic indicators by using min-max11 method or based on a reference value
change the results? In the case of both countries in this study, the changes of the scores of individual indicators following a change of normalization method are low. We found a negative variation of 0,6% on data from Burkina Faso and 1,6% on the Niger data when we change the scale-ratio normalization method to the min-max one.
5.2. Weighting step
The issue of individual indicators weighting is difficult because assign weights to the indicators or the SD dimensions is akin to a value judgment. How to legitimize weights associated to the indicators in a scientific approach? Literature specific to CIs provides several weighting methods (see OECD and JRC 2008; Dialga and Le 2016). The simplest but most arbitrary is to give equal weights for all individual indicators. This option, although transparent, has implications for the choice of aggregation method. Choosing an equal weighting assumes that elements are considered equally important. Another weighting system is the Principal Components Analysis (CPA) weighting system which allows generating weights that reflect the structure of statistical data. The weights reflect the changes in initial variables involved in the explanation of the total variance of the CI.
In this paper, we choose the so-called Budget Allocation Process (BAP). This method allows gathering opinions from various stakeholders (experts of respective fields, NGOs, policy makers) on the studied issue. The main motivation to adopt this method is the desire to give both scientific and professional legitimacy to the SIMC. The approach also aims to ensure local acceptability of the decision support tool. However we are aware of the methodological limitations inherent in such an approach. How to converge viewpoints of stakeholders with competing interests? How to engage stakeholders in order to reach a consensual compromise? How to ensure coherence of the actors in their assessment? How to objectify the results from such a participatory approach? Although the aggregation of individual views does not
11 Min-max is defined by 𝑆𝑆𝑆𝑆 = 𝑉𝑉𝑖𝑖𝑖𝑖−𝑉𝑉𝑚𝑚𝑖𝑖𝑚𝑚
𝑉𝑉𝑚𝑚𝑚𝑚𝑚𝑚−𝑉𝑉𝑚𝑚𝑖𝑖𝑚𝑚with 𝑉𝑉𝑚𝑚𝑚𝑚𝑚𝑚and 𝑉𝑉𝑚𝑚𝑖𝑖𝑚𝑚the maximum and minimum values of the sample. The reader can refer to Dialga and Le (2016) for critical review.
13
necessarily lead to an optimal and consensual solution, it is close to what might be termed the second best. In addition, we calculate a consistency index12 of appreciation to objectify the
BAP method.
Table 1-Summary of BAP weighting method
Education &health Political stability& governance Sharing of wealth from
growth Actual needs
Future needs (children’ s future) Environment& sustainable management of
mines Rural development Children live conditions Employ
Obs. 164 164 164 164 164 164 164 164 164 Min 0.026 0.000 0.000 0.000 0.020 0.000 0.000 0.022 0.022 Mean 0.126 0.119 0.104 0.090 0.119 0.100 0.106 0.118 0.118 Median 0.126 0.119 0.104 0.090 0.119 0.100 0.106 0.118 0.118 Mode 0.200 0.111 0.111 0.111 0.111 0.111 0.111 0.111 0.111 Max 0.237 0.209 0.209 0.250 0.222 0.210 0.179 0.231 0.205 St. Deviation 0.227 0.035 0.036 0.038 0.040 0.027 0.040 0.033 0.030 Consistency index: 0.000 Source: author
Table 1 shows that the subjects in sustainability which are submitted for consideration of stakeholders can be categorized into two groups. Respondents believe that "health and education", "political stability and institutional quality," the "future of children," their "living conditions" and the current "employment" have almost the same importance. These issues constitute the first group. The average attributed weight is 0.12 with a slight appreciation rising to the theme "education and health". The "fairness" in the distribution of the fruits of growth, "satisfaction of the current needs", "environment and sustainable management of mines" and "rural development" belong to the second group of issues. On average, participants assigned a weight of 0.10; either a percentage point less than the emphasis on themes of the first class of SD issues. Dispersion statistics show a consistent appreciation by all stakeholders: the standard deviation is about 3%, the median blends perfectly average and the modal value is the average of the two groups categorized by stakeholders.
The extreme values (min and max) can be interpreted as specific weightings. They result differentiated assessments of the expert groups based on their deep or non knowledge of the submitted issues (see Table 6). As an illustration, the environmentalists tended to
12 𝑆𝑆 = 𝑥𝑥𝑤𝑤𝑖𝑖
𝑤𝑤𝑖𝑖′ ; With 𝑥𝑥 the ratio of budget allocations to sub-indicatorssij andsij'; wjand wj' being the relative weights of indicators sij and sij' , obtained from the Budget allocation. Decision criterion: 𝑆𝑆 ≤
14
overestimate the importance of this pillar while the social workers did much for the theme "Education and Health". The zero weights can testify to the misconception of the issue or even ignorance of the issues raised by the theme submitted for their consideration. For example, the theme "sharing the fruits of growth" was understood differently by respondents. Accordingly, it was poorly rated by a number of respondents. After a lexical analysis, it appears that some evil noted this theme because they think the benefits of growth should not be distributed directly to individuals (the term “sharing” was understood in the proper sense of the term) but rather allocated to the investment of works, public and community infrastructure. With others, talking about the equitable distribution of the fruits of growth, it is necessary to pose the issue in terms of distribution of the fruits of growth in proportion to the effort of every citizen in the creation of that wealth. According to other respondents, the equity in the distribution of the fruits of growth is not worth asking. For these last ones, in liberal economies, it is entirely appropriate that people who provide more effort are richer than others, even if they are a minority. All these different ways of conceiving the concept of sharing and social equity have justified the different appreciations from the solicited people, sometimes extreme assessments. The same exercise can be done when we analyze the respondents’ answers by taking theme by theme. Therefore, it is important to consider the weight resulting from the BAP method as importance coefficients because emanating opinions of the different actors involved in sustainable development issues in the studied countries. The assessments are also consistent in regard to the zero value of the consistency index.
5.3. Aggregation step
The concept of aggregation in the synthetic indices area is an exercise that aims to condense the information contained in individual indicators to obtain a single number. Aggregation is a delicate step as well as the others because there are several methods, each leading to more or less different scores. The crucial question for the researcher therefore is: what method should be chosen in the absence of standard methodology framework (Dialga and Le 2016) or more specifically how to choose the right method of aggregation ? Here, we synthesize the most used aggregation methods.
15 weight. associated the is and variable normalized initial the is score; composite , ; variables ,..., 1 entites; ,... 1 , 1 w I IC n j m i I w IC n ij j j i = ∑ = = =
It is a simple and transparent method. The indexes built from this method have the advantage of escaping from the criticism related to the complexity or those considering CIs as "black boxes" whose expertise is restricted to a small group; those who are insider. However, the perfect substitutability hypothesis own to this method (Zhou, Ang, and Poh 2006) is constantly controversial (Munda and Nardo 2003; Munda 2005; Munda and Nardo 2009). Regarding to the field of CIs, the method raises a problem of interpretation of the associated weights. The weight associated in linear aggregation method should be interpreted as "compromise coefficients" among different dimensions measured (Munda and Nardo 2003); what is different to importance coefficients that the weights would reflect . In the specific case of the SIMC, the linear aggregation method is inappropriate as we have conflicting dimensions. How and to what levels of tolerance, natural resources depletion and pollution levels can be offset by gains in economic or social performance? For Munda and Nardo (2009), the assumption of perfect substitutability between different dimensions is, descriptive point of view, not desirable: " Complete compensability implies that an excellent performance
on the economic dimension can justify any type of very bad performance on the other dimensions, which is exactly what the concept of sustainability tries to avoid"(Munda 2005).
Non-compensatory aggregating method under perfect complementarity hypothesis: This
method results from the multi-criteria approach. Given two entities j and k , the composite score of the entity j relative to the performance of entity k , considering M individual
indicators is given by: ∑
( )
( )
+ = = M m m jk m jk jk w P w I e 1 2 1 ,
( )
jk q P w and wq( )
Ijk individual indicators' weights showing a preference and indifference relation respectively for entities j and k . The final score of the various possible rankings derived from the sum of the pairwisecomparison scores13. ϕ* =max
∑
ejk .The non-compensatory aggregating method is appealing in its approach. This is an advantageous method in which it relieves us the step of normalizing the individual indicators, thereby reducing the sources of uncertainty. Another advantage of this method is that it allows
16
joint use of both qualitative and quantitative data (OECD and JRC 2008, p.115). The method is also suitable for indicators using ratios or interval scales as normalization method. Following Bouyssou (1986); Bouyssou and Vansnick (1986) this method imposes itself because it allows realizing and/or taking into account the social choices expressed by stakeholders.
However, it is a method which, theoretically, based on an assumption as strong as that of perfect substitutability i.e., the assumption that a country can improve its sustainability index if it performs in each dimension of the index at the same time. Therefore, it is difficult to verify in practice Also, we must have at least two countries to assess country score. It is a method to comparative vocation rather than national policy guideline. Yet, the SIMC aims to help public policies upstream and ensure their monitoring and evaluation downstream.
Another method usually used in the CIs aggregating step is the geometric aggregating
method. It is defined by: n i m entities j n iables
i j w ij I i CI , 1,..., ; 1,... var 1 = = ∏ = = . It admits
imperfect compensation between aggregate variables. This method is consistent with our theoretical framework (see Figure 1). Zhou, Ang, and Poh (2006) argue that the geometric method is preferable because it is less sensitive to extreme values.
However, the method penalizes all poor performance making that performing well in some areas of the measured phenomenon are overshadowed. The method also requires positive values for the variables, as well as associated weights.
In view of the merits and its relevance regarding to the SIMC's theoretical framework, the geometric method seems more realistic because if the assumption of perfect substitution between dimensions is undesirable in a context of sustainable development (Munda 2005), that of a perfect complementarity is methodologically not suitable for CIs and operationally ineffective. Also, OECD and JRC (2008) argue that when we are in the presence of non-comparable data, leading us to use the ratio as a normalization method, so, the geometric aggregation method is the most appropriate one14.
17
Hence, our SIMC is defined as follows: ∏
( )
= = 5 1 i Di SIMCi i wi ; i Di is the normalized
dimensional indicator,wiis the associated weight.
Table 2-The Burkina Faso and Niger SIMC score and their associated Resources Profitability Index
SIMC 2010 RPI 2010 SIMC 2015 RPI 2015
Burkina Faso 0.348 0.053 0.357 0.0096
Niger 0.285 0.013 0.298 0.029
Source: Author
Table 2 shows the SIMC’s scores of Burkina Faso and Niger for the years 2010 and 2015. Table 2 associates the RPI for each of the countries and corresponding to the years 2010 and 2015. An overview shows a dichotomy between perceived natural resources rents and sustainable level of development in both studied countries. Indeed, Niger enjoys relatively better exploitation of subsoil resources compared to Burkina Faso. Despite of long experience in the extraction of uranium, the Niger's SIMC score is small compared to that of Burkina Faso, although the level of sustainability of this last one also remains low compared to the value maximum which is 1. These contradicted findings raise questions concerning the opportunity to establish a sustainable development based rents of exhaustible resources (Dialga 2015) as highlighted in the (Hartwick 1977) rule.
6. Sensitivity and Robustness analysis
In this section, we get down to the following three exercises: first, we evaluate the sensitivity of the index with respect to changes in weighting methods and aggregation. To do this, we consider three possible methods of weighting the index namely equal weighting, weighting by PCA and weighting by Budget Allocation Process (our baseline). These weighting methods are associated with three aggregation methods: the linear aggregation, the geometric mean (our baseline) and non-compensatory aggregation. We analyze changes in index scores for the two countries. Second, we assess the robustness of the composite index. In other words, it is to evaluate the ability of the CI to return the information contained in the individual variables. For this we use the measure of Shannon-Spearman lost information proposed by Zhou, Ang, and Poh (2006) and Zhou and Ang (2008). The third step is to analyze possible links that may exist between the new index and some well-known indexes. We conduct a correlation test
18
between the SIMC and the HDI, as well as between the SIMC and the Human Sustainable Development Index (HSDI) of Togtokh (2011).
6.1. Sensitivity analysis
In this sub-section, we drive two sensitivity analyzes of the SIMC's score. The first is a decomposition of the total variance of the CI to assess the influence of each dimensional indicator to the composition of the country's composite score. The second is to evaluate the sensitivity of the composite index following a change in method of weighting and aggregation.
Sensitivity analysis by variance decomposition
As described by Homma et Saltelli (1996), Cherchye et al.( 2006), Saisana and Saltelli (2010) and adopted by Aguna and Kovacevic (2010); Aguna and Kovacevic (2010) and Dialga and Le (2016), the sensitivity analysis by variance decomposition is used to assess the contribution of each input variable (dimensional index) in the formation of the total output ( composite score). The contribution of each individual indicator is given by: 𝑆𝑆𝑖𝑖=
𝑉𝑉𝑋𝑋𝑖𝑖(𝐸𝐸𝑋𝑋−𝑖𝑖(𝑌𝑌\𝑋𝑋𝑖𝑖))
𝑉𝑉(𝑌𝑌) =
𝑉𝑉𝑖𝑖
𝑉𝑉(𝑌𝑌) . 𝑆𝑆𝑖𝑖 gives the relative contribution of the j-th variable (only) to the
composition of the total variance. Thus, the more important the area or the dimension defined by variable 𝑋𝑋𝑖𝑖 is, the greater 𝑆𝑆𝑖𝑖 will be. In particular, when the variable explains almost all variations of output, sensitivity indicator tends toward unity.
Figure 2-The Burkina Faso and Niger SIMC score variance decomposition
21.07% 19.96% 17.32% 20,65% 21.00% Economic dimension Social dimension Environmental dimension Transverse dimension GPI dimension
19 Source: Author
The variance decomposition applied to data of our study is highlighted by Figure 2. The dimension of economics Governance, Politics and Institutions and the transverse dimension explain the SIMC's variability (62.72%) both in Burkina Faso and Niger. Then, the social and environmental dimensions contribute 19.96% and 17.32% respectively. These differentiated contributions highlighted by the CI's total variance decomposition, consolidate our choice of differentiated weighting. However, this statistical evidence contrasts with the choices made by stakeholders from both surveyed countries which provide a first-rate importance to the social dimension and the Governance, Political and Institutional dimension firsly; the economic, environmental and transverse ones come in last position.
Sensitivity analysis by changing the aggregating and weighting methods
The baseline is the composite score built from the geometric method of aggregation and BAP weighting technique. The Figure 3 shows the variations of the SIMC scores relative to its benchmark.
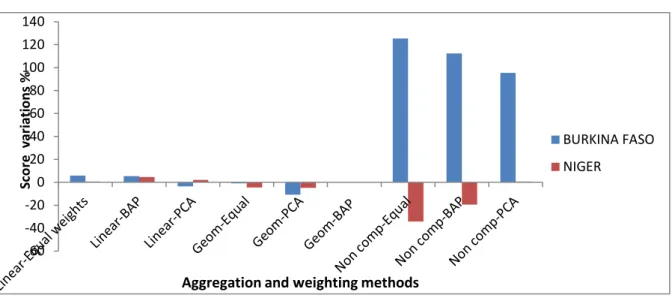
Figure 3-The 2015 SIMC score variation compared to the baseline
Source: Author
Apart from the non-compensatory aggregation method, the index scores are relatively stable regardless of whether the aggregation-weighting system considered. Indeed, there is a certain stability of the composite score if we admit a fluctuation band of plus or minus 6% around the reference value of the composite score. These small changes are certainly due to some differences in the weighting systems. For example, there is no significant difference in score between the geometric-equal-weighted aggregation method and the baseline. Similarly, we
-60 -40 -20 0 20 40 60 80 100 120 140 Sc or e va ria tio ns %
Aggregation and weighting methods
BURKINA FASO NIGER
20
could say that despite of the different theoretical frameworks, linear geometric aggregation and aggregation lead to similar composite scores for both countries and that, whatever the weighting system adopted. Figure 3 thus indicates that the SIMC relies both on a sound theoretical basis and provides stable statistical results. This result is also interesting because most of previous studies (see Desai 1991; Coste et al. 2005; Zhou et al. 2006; Brand et al. 2007; OECD and JRC 2008; Cherchye et al. 2008; Cherchye et al. 2008; Nathan et al. 2012; Chinn and Ito 2008; Tarantola and Vertesy 2012; Perišić 2015; Dialga and Le 2016) pointed out that the composite scores are unstable when both aggregation and weighting method change.
The large variation in the composite score observed in the non-compensatory aggregation method is justifiable by definition of the method. Indeed, the perfect complementary method contains a strong assumption, which assumes that each entity must perform in all areas where it is evaluated to improve its final score. Thus, the method artificially increases the composite score of Burkina Faso to the detriment of Niger with the simple reason that in 4 of the 5 dimensions of SD, Burkina performs better than its neighbor, Niger. This sensitivity analysis by changing aggregations methods and weights is somehow a confirmatory analysis of the choice made for the construction of the SIMC.
6.2. Robustness analysis: the Loss Information Measure (LIM)
The LIM or coefficient of adequacy of the aggregation method is a measure of the non restored information between the information contained in the original variables 𝑋𝑋𝑖𝑖 and the restored by the composite score 𝑆𝑆𝑘𝑘 for the entity 𝑘𝑘. It is a measure proposed by Zhou, Ang,
and Poh (2006) to assess the appropriateness of a method of aggregation of the CI over another. The LIM is defined as follows:
, , ) 1 ( ) 1 ( 1 ight ociated we is the ass w r e r e w LIM j sj s j n j j − − − =
∑
= m k p n j countries g e entities m i p m i k k m i ij ij I I k X X ij ,..., 1 , variables ,..., 1 ; ) : . ( ,..., 1 , 1 1 = ∑ = = = ∑ = = = ij21
∑
∑
= = − = = − = m i k k m ij m i ij m j p p e n j p p e 1 ln 1 1 ln 1 ln ,..., 1 , ln je and e are performance measures for each entity. According to Zhou, Ang, and Poh (2006), Zeleny (1982) shows that 0≤ej,e≤1
. When ejand eare close to 1, it means a certain
homogeneous of the sample.
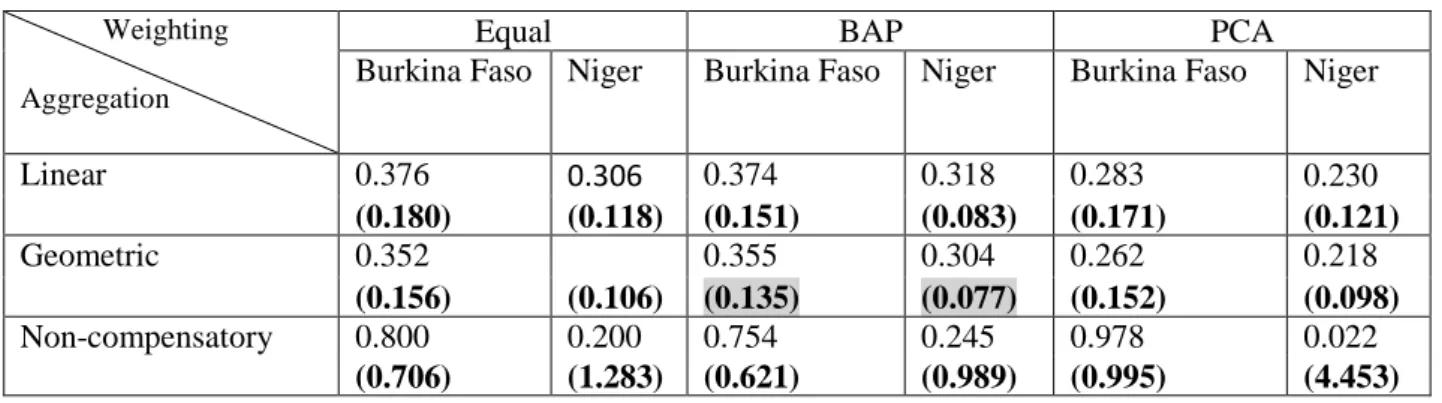
Table 3-The Loss Information Measure according the Weighting and aggregating technique15
Weighting
Aggregation
Equal BAP PCA
Burkina Faso Niger Burkina Faso Niger Burkina Faso Niger
Linear 0.376 0.306 0.374 0.318 0.283 0.230 (0.180) (0.118) (0.151) (0.083) (0.171) (0.121) Geometric 0.352 0.355 0.304 0.262 0.218 (0.156) (0.106) (0.135) (0.077) (0.152) (0.098) Non-compensatory 0.800 0.200 0.754 0.245 0.978 0.022 (0.706) (1.283) (0.621) (0.989) (0.995) (4.453) Source: Author
Table 3 shows that the choice of the geometric aggregation and weighting by the Budget Allocation Process is both theoretically and statistically relevant. Indeed, when we compare the values of the LIM calculated for three different weighting methods and three different aggregating methods, the geometric method and the BAP restore better the information contained in the individual initial variables. Depending on the LIM's values, restitution of the information contained in individual indicators is much more effective for Niger data (LIM = 0.077) than those of Burkina Faso (LIM = 0.135). However, the loss of information related to the aggregation of the initial variables is minimized to the geometric method of aggregation and weighting BAP than any other aggregation-weighting method for each of the studied countries. This finding bodes a judicious choice of aggregating and weighting method although all sources of uncertainty are not eliminated. The main uncertainty source is related to the deficient quality of collected data. This significant limit requires a more careful analysis of these exploratory results.
6.3. Link with others development indices analysis
15 We report in this table, composite scores from the different methods of aggregation and weighting and the corresponding values of the LIM in parentheses. Highlighted values indicate the optimum combination for each country
22
The aim of this sub-section is to conduct a correlation test between the SIMC and two development CIs: the UNDP's HDI and the Togtokh (2011) Human Sustainable Development Index (IDHS). The choice of both indices for the analysis of possible links with the SIMC is motivated by two main reasons. First, the HDI remains a development benchmark index even if it is partial. Second, it is an index for which the ranking covers our two countries in the study; this allows us to have data to conduct the test. We retain the Togtokh (2011) HSDI for his expanded vision of development which is close to the SIMC. Togtokh (2011) provides a "more complete" human development index with four dimensions by adding to the traditional HDI, an environmental dimension measured by CO2 emissions per capita. As the HDI, this index covers several countries, including Burkina Faso and Niger. For purposes of reasonable comparisons, the selected SIMC values for the correlation test are those obtained by simple geometric mean.
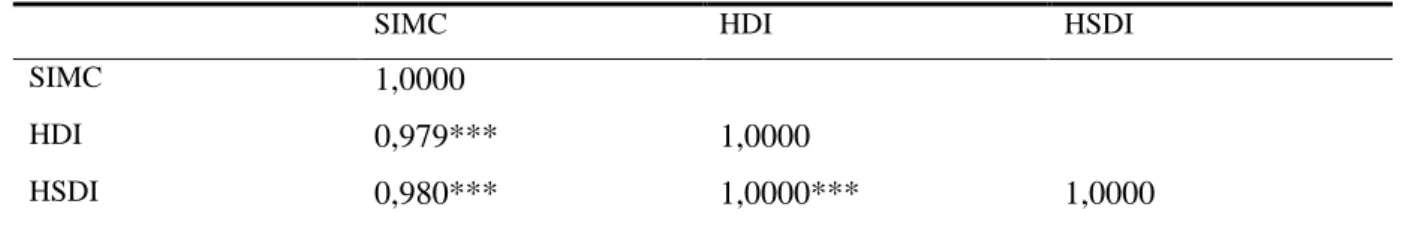
Table 4-Correlation test between SIMC, HDI and HSDI
SIMC HDI HSDI
SIMC 1,0000
HDI 0,979*** 1,0000
HSDI 0,980*** 1,0000*** 1,0000
*** denotes statistically significant correlation coefficients at the 1% level.
The correlation test summarized in Table 4 shows that the three development indices are highly correlated. In addition, the correlation coefficients are statistically significant. What suggests this test? The strong correlation between SIMC, HDI and HSDI must be interpreted as redundant measurements of development translates by the new index or should it be interpreted as the capacity of the three indices to grasp the same development challenges in these countries with different conceptual frames? By definition, such strong correlations between the three composite indexes mean they translate the same concept of development. However, it is clearly to see that the SIMC is a richer index in terms of its conceptual enlargement including Governance, Political and Institutional dimension and a transverse dimension.
23 Source: Author
In addition, from the viewpoint of the measurement of the absolute performance, the three indices provide scores with slight differences as illustrated in Figure 4. Indeed, in 2015, Burkina Faso has recorded different scores depending on the considered indices. The SIMC underestimates the performance of the country while the HSDI overestimates the level of the country's development compared with the score provided by the HDI 2015. The good performance given by the HSDI is due to low levels of carbon dioxide emissions recorded in the country, the amount of C02 emitted per capita being the main variable introduced by Togtokh (2011) in the HDI. The deterioration of the country SD performance, (referring to the SIMC) is due to the new dimensions introduced in the new index. Remember that the total variance decomposition of the index (Figure 2) shows that Governance, Political and Institutional dimension and transverse dimension contribute 42% to the explanation of changes in the SIMC score. When we remove these two dimensions, one enhances Burkina score of 28%. This finding is also checked for Niger which registers 7% growth when the two additional dimensions are removed. The expansion of the concept of SD improves its theoretical framework but it deteriorates countries' statistic performances (countries' scores).
7. Concluding remarks
This paper aimed to develop a Sustainability Index of Mining Countries. The Hartwick (1977) rule served as a theoretical framework for the identification of the SIMC's dimensions. This rule has been extended to take into account the specific characteristics of the countries studied: the States who are holders of the exhaustible resources are not those who exploit
Burkina Faso 0.351 0.402 0.505 score SIMC HDI HSDI
24
them. This dichotomy between operators and the exploited resource owners renders the Hartwick (1977) rule inapplicable. The expansion of this theoretical framework has identified five dimensions of sustainable development. These dimensions are then declined into indicators. The so-called "Budget Allocation Process- BAP" weighting technique is used to aggregate the CI. The BAP method gives a professional legitimacy and local acceptability of the CI to actors involved in its construction process. The relevance and scientific validity of the approach have been proven by consistency tests. The method of geometric aggregation was deemed relevant in relation to its relevance to the theoretical framework of the index. We conducted sensitivity and robustness analysis on the obtained composite scores. The total variance decomposition analysis confirmed the relevance of expanding sustainable development dimensions with the introduction of a transverse dimension and Governance, Political and Institutional dimension. The sensitivity analysis by changing the aggregation methods and weighting indicates a certain stability of the country scores, except for the aggregation method by multi-criteria approach. This stability of the composite scores is observed, regardless of the adopted weighting system. The robustness analysis of the CI aimed to assess the rendering power of the information contained in the original variables by the composite index. To do this, we mobilize the "information loss measure- LIM" developed by Zhou et al. (2006). This measure of LIM revealed that the aggregation and weighting methods which guarantee the lowest loss of information are the geometric aggregation and weighting BAP regardless of the selected country. Finally, we performed a linkage analysis of the index built with other well-known development indices. This analysis showed a very strong correlation between the SIMC and the HDI (0.979) and between the SIMC and theTogtokh (2011) HSDI (0.980). These strong correlations, therefore, suggest that the three indices reflect the same concept of development with the only difference that they are based on different theoretical and conceptual approaches. However, the analysis indicates a total lack of relationship between the rents collected by States and their sustainable development level, leading us to conclude partially that the perceived rents in these countries are sufficiently weak, they fail to initiate sustainable development. This conclusion is close to thoese of Dialga (2015) which highlighted the high risk of non-sustainability of the Burkina Faso economy regarding to its current development path. The Hartwick (1977) rule, even extended, is not satisfied in both studied countries. The study has some limitations including limits of the low quality of data and the uncertainties in the estimation techniques for missing
25
data. Taking into account these limits, it is early to conclude on the existence of natural resources curse in both countries.
References
Agbohou, Nicolas. 1999. “Le Franc CFA et l’Euro Contre l’Afrique.” Coignieres, Éditions Solidarité
Mondiale.
Aguna, C., and Milorad Kovacevic. 2010. “Uncertainty and Sensitivity Analysis of the Human Development Index.” Human Development Research Paper 11.
Ampella Mining Limited. 2013. “Etude d’impact sur l’Environnement (EIE). Projet minier
Batié-ouest, Burkina Faso.” Final. Ouagadougou, Burkina Faso: Bureau National des Evaluations
Environnementales, Ministère de l’Environnement et du Développement Durable.
Andersen, Jørgen Juel, and Silje Aslaksen. 2008. “Constitutions and the Resource Curse.” Journal of
Development Economics 87 (2): 227–46.
Arezki, Rabah, Thorvaldur Gylfason, and Amadou Sy. 2012. “Beyond the Curse: Policies to Harness the Power of Natural Resources.” Africa Growth Agenda, 12–14.
Auty, Richard M. 2001. Resource Abundance and Economic Development. Oxford University Press. Ballet, Jérôme, Jean-Luc Dubois, and François-Régis Mahieu. 2012. “La soutenabilité sociale du
développement durable : de l’omission à l’émergence.” Mondes en développement 156 (4): 89–110.
Bardhan, Pranab. 2014. “Corruption and Development Policy (Drawing Upon the Recent Indian Debate).” Journal of Public Economic Theory, September, n/a-n/a.
Bissa Gold SA. 2014. “Etude d’Impact sur l’Enronnement du projet d’extension du permis
d’exploitation aurifère de Bissa/Zandkom.” Ouagadougou, Burkina Faso: Bissa Gold SA.
Bolt, Katharine, Anil Markandya, Giovanni Ruta, Glenn-Marie Lange, Kirk Hamilton, M. Saeed Ordoubadi, Patricia Silva, Suzette Pedroso-Galinato, and Liaila Tajibaeva. 2005. “Where Is the Wealth of Nations? : Measuring Capital for the 21st Century.” 34855. The World Bank. Bouyssou, Denis. 1986. “Second EURO Summer InstituteSome Remarks on the Notion of
Compensation in MCDM.” European Journal of Operational Research 26 (1): 150–60. Bouyssou, Denis, and Jean-Claude Vansnick. 1986. “Noncompensatory and Generalized
Noncompensatory Preference Structures.” Theory and Decision 21 (3): 251–66.
Brand, Donald A, Michaela Saisana, Lisa A Rynn, Fulvia Pennoni, and Albert B Lowenfels. 2007. “Comparative Analysis of Alcohol Control Policies in 30 Countries.” PLoS Med 4 (4): e151. Brollo, Fernanda, Tommaso Nannicini, Roberto Perotti, and Guido Tabellini. 2010. “The Political
Resource Curse.” Working Paper 15705. National Bureau of Economic Research.
Brundtland, Gro Harlem, World Commission on Environment, and Development. 1987. Our Common
Future. Vol. 383. Oxford University Press Oxford.
Busse, Matthias, and Steffen Gröning. 2013. “The Resource Curse Revisited: Governance and Natural Resources.” Public Choice 154 (1–2): 1–20.
Carney, Diana. 1998. “Sustainable Rural Livelihoods: What Contribution Can We Make? Papers Presented at the Department for International Development’s Natural Resources Advisers’ Conference, July 1998.” In Sustainable Rural Livelihoods: What Contribution Can We Make?
Papers Presented at the Department for International Development’s Natural Resources Advisers’ Conference, July 1998. Department for International Development (DFID).
Chen, Dongjing, Xiaoyan Ma, Hairong Mu, and Peiying Li. 2010. “The Inequality of Natural
Resources Consumption and Its Relationship with the Social Development Level Based on the Ecological Footprint and the Hdi.” Journal of Environmental Assessment Policy and
Management 12 (1): 69–86.
Cherchye, Laurens, Willem Moesen, Nicky Rogge, and Tom Van Puyenbroeck. 2006. “An
Introduction to ‘Benefit of the Doubt’ Composite Indicators.” Social Indicators Research 82 (1): 111–45.
Cherchye, W. Moesen, N. Rogge, T. Van Puyenbroeck, M. Saisana, A. Saltelli, R. Liska, and S. Tarantola. 2008. “Creating Composite Indicators with DEA and Robustness Analysis: The
26
Case of the Technology Achievement Index.” Journal of the Operational Research Society 59 (2): 239–51.
Chinn, Menzie D., and Hiro Ito. 2008. “A New Measure of Financial Openness.” Journal of
Comparative Policy Analysis: Research and Practice 10 (3): 309–22.
Clément, Matthieu, Ali Douai, and Xclaire Gondard-Delcroi. 2012. “Réflexions sur le concept de soutenabilité sociale dans le contexte des pays du Sud.” Mondes en développement 156 (4): 7– 18.
Cominak. 2012. “Bilan social 2012.” Niamey, Niger: Areva Niger.
COMNAK-Compagnie Minière d’Akouta. 2012. “Rappor Environnemental, Social et Sociétal 2012.” Annuel. Niamey, Niger: Areva Niger.
Coste, Joël, Stéphane Bouée, Emmanuel Ecosse, Alain Leplège, and Jacques Pouchot. 2005. “Methodological Issues in Determining the Dimensionality of Composite Health Measures Using Principal Component Analysis: Case Illustration and Suggestions for Practice.” Quality
of Life Research 14 (3): 641–54.
Desai, Meghnad. 1991. “Human Development: Concepts and Measurement.” European Economic
Review 35 (2–3): 350–57.
Dialga, Issaka. 2015. “Du boom minier au Burkina Faso, opportunité de développement ou risques de péril pour des générations futures ?” Revue Cedres Etudes Sciences Economiques, Cedres, , no. 59 (September): 27–47.
Dialga, Issaka, and Thi Hang Giang Le. 2016. “Highlighting Methodological Limitations in the Steps of Composite Indicators Construction.” Social Indicators Research, February, 1–25.
Dubois, Jean-Luc. 2009. “The Search for Socially Sustainable Development Conceptual and Methodological Issues.” Against Injustice: The New Economics of Amartya
Sen. Cambridge, Cambridge University Press, Cambridge, 275–294.
Endeavour mining-Avion Gold Burkina Sarl. 2014. “Etude d’impact environnemental, projet minier
Houndé, Burkina Faso.” Final. Ouagadougou, Burkina Faso: Bureau National des Evaluations
Environnementales, Ministère de l’Environnement et du Développement Durable, Burkina Faso.
Field, Frank, Randolph Kirchain, and Joel Clark. 2000. “Life-Cycle Assessment and Temporal Distributions of Emissions: Developing a Fleet-Based Analysis.” Journal of Industrial
Ecology 4 (2): 71–91.
Frankel, Jeffrey A. 2010. “The Natural Resource Curse: A Survey.” Working Paper 15836. National
Bureau of Economic Research.
Geiregat, Chris, and Susan Yang. 2013. “Des richesses trop abondantes?” Fonds monétaire
internationale, Finance & Développement, 50 (3): 57.
Gryphon Minerals Limited. 2014. “Projet aurifère de banfora, Burkina Faso, étude d’impact
environnemental et social.” Final. Ouagadougou, Burkina Faso: Bureau National des
Evaluations Environnementales, Ministère de l’Environnement et du Développement Durable. Hartwick, John M. 1977. “Intergenerational Equity and the Investing of Rents from Exhaustible
Resources.” The American Economic Review 67 (5): 972–74.
Hausmann, Ricardo, and Roberto Rigobon. 2003. “An Alternative Interpretation of the ‘Resource Curse’: Theory and Policy Implications.” Working Paper 9424. National Bureau of Economic
Research.
Hilson, Gavin. 2010. “‘Once a Miner, Always a Miner’: Poverty and Livelihood Diversification in Akwatia, Ghana.” Journal of Rural Studies 26 (3): 296–307.
Homma, Toshimitsu, and Andrea Saltelli. 1996. “Importance Measures in Global Sensitivity Analysis of Nonlinear Models.” Reliability Engineering & System Safety 52 (1): 1–17.
Hugon, Philippe. 2009. “Le rôle des ressources naturelles dans les conflits armés africains.” Hérodote n° 134 (3): 63–79.
IAM Gold Essakan SA. 2013. “Plan d’action réinstallation.” Rapport Final. Ouagadougou, Burkina Faso: Bureau National des Evaluations Environnementales, Ministère de l’Environnement et du Développement Durable.
Irz, Xavier, Lin Lin, Colin Thirtle, and Steve Wiggins. 2001. “Agricultural Productivity Growth and Poverty Alleviation.” Development Policy Review 19 (4): 449–66.
27
Jensen, Nathan, and Leonard Wantchekon. 2004. “Resource Wealth and Political Regimes in Africa.”
Comparative Political Studies 37 (7): 816–41.
Kaufmann, Daniel, Aart Kraay, and Massimo Mastruzzi. 2009. “Governance Matters VIII: Aggregate and Individual Indicators, 1996-2008.” World Bank Policy Research Paper, no. 4978.
Kiaka Gold Sarl. 2014. “Projet aurifère Kiaka, Burkina Faso, Etude d’impact environnemental et
social, rapport final.” Final. Ouagadougou, Burkina Faso: Kiaka Gold Sarl.
Leduc, Gaétan A., and Michel Raymond. 2000. “L’évaluation des impacts environnementaux : Un outil d’aide à la décision.” VertigO - la revue électronique en sciences de l’environnement, 403.
Levine, Stephen H., Thomas P. Gloria, and Eliahu Romanoff. 2007. “A Dynamic Model for Determining the Temporal Distribution of Environmental Burden.” Journal of Industrial
Ecology 11 (4): 39–49.
Midas Gold Sarl. 2013. “Etude d’impact environnemental et social: unité de traitement semi-mécanisé des haldes et stériles.” Ouagadougou, Burkina Faso: Midas Gold Sarl.
Munda, Giuseppe. 2005. “‘Measuring Sustainability’: A Multi-Criterion Framework.” Environment,
Development and Sustainability 7 (1): 117–34.
Munda, Giuseppe, and Michela Nardo. 2003. “On the Methodological Foundations of Composite Indicators Used for Ranking Countries.” Ispra, Italy: Joint Research Centre of the European
Communities.
———. 2009. “Noncompensatory/Nonlinear Composite Indicators for Ranking Countries: A Defensible Setting.” Applied Economics 41 (12): 1513–23.
Nathan, Hippu Salk Kristle, Srijit Mishra, and B. Sudhakara Reddy. 2012. “An Alternative Approach to Measure HDI.” Working Paper.
Nubukpo, Kako, and Bruno Tinel. 2016. Sortir l’Afrique de la servitude monétaire. La Dispute. OECD, and JRC. 2008. Handbook on Constructing Composite Indicators: Methodology and User
Guide. OECD Publishing.
Oxfam. 2013. “Niger: A qui profite l’uranium? L’enjeu de la renégociation des contrats miniers
d’Areva.” Oxfam International.
Papyrakis, Elissaios, and Reyer Gerlagh. 2004. “The Resource Curse Hypothesis and Its Transmission Channels.” Journal of Comparative Economics 32 (1): 181–93.
Perišić, Ana. 2015. “Data-Driven Weights and Restrictions in the Construction of Composite Indicators.” Croatian Operational Research Review 6 (1): 29–42.
Plan African Minerals LTD. 2014. “Etude d’impact environnemental et social du projet d’exploitation
du manganèse de Tambao.” Final. Ouagadougou, Burkina Faso: Bureau National des
Evaluations Environnementales, Ministère de l’Environnement et du Développement Durable. Reed, Mark S., Evan D. G. Fraser, and Andrew J. Dougill. 2006. “An Adaptive Learning Process for
Developing and Applying Sustainability Indicators with Local Communities.” Ecological
Economics 59 (4): 406–18.
Saisana, Michaela, and Andrea Saltelli. 2010. Uncertainty and Sensitivity Analysis of the 2010
Environmental Performance Index. OPOCE.
Sba-Ecosys-Cedres. 2011. “Analyse économique du secteur des mines: liens pauvreté et
environnement.” Rapport final. Ouagadougou, Burkina Faso: Ministère de l’Environnement et
du Développement durable.
SEMAFO Burkina SA. 2013. “Etude d’impact environnemental et social du projet F1: extension du
permis de Mana.” Ouagadougou, Burkina Faso: SEMAFO SA, Société d’Exploration Minière
en Afrique de l’Ouest.
SOMAIR-Société des Mines de l’Aïr. 2012. “Rapport Environnemental, Social et Sociétal
2011-2012.” Annuel. Niamey, Niger: Areva Niger.
SOMINA-Société des Mines d’Azélik. 2014. “Rapport Environnemental, Social et Sociétal
2013-2014.” Annuel. Niamey, Niger: SOMINA.
Tarantola, Stefano, and Daniel Vertesy. 2012. “Composite Indicators of Research Excellence.” EUR -
Scientific and Technical Research Reports, Institute for the Protection and Security of the
Citizen.
28
Van der Ploeg, Frederick. 2011. “Natural Resources: Curse or Blessing?” Journal of Economic
Literature, 366–420.
Zeleny, Milan. 1982. “Multi Criteria Decision Making.” TIMS Studies in Manage, 31–57.
Zhou, P., and B. W. Ang. 2008. “Comparing MCDA Aggregation Methods in Constructing Composite Indicators Using the Shannon-Spearman Measure.” Social Indicators Research 94 (1): 83–96. Zhou, P., B. W. Ang, and K. L. Poh. 2006. “Comparing Aggregating Methods for Constructing the
Composite Environmental Index: An Objective Measure.” Ecological Economics 59 (3): 305– 11.
Appendices
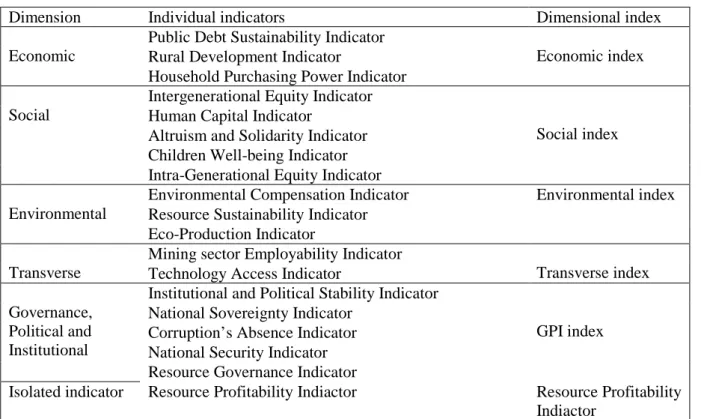
Table 5-Summary of final indicators by dimension and associated dimensional indices
Dimension Individual indicators Dimensional index
Economic
Public Debt Sustainability Indicator
Economic index Rural Development Indicator
Household Purchasing Power Indicator Social
Intergenerational Equity Indicator
Social index Human Capital Indicator
Altruism and Solidarity Indicator Children Well-being Indicator Intra-Generational Equity Indicator Environmental
Environmental Compensation Indicator Environmental index Resource Sustainability Indicator
Eco-Production Indicator Transverse
Mining sector Employability Indicator
Transverse index Technology Access Indicator
Governance, Political and Institutional
Institutional and Political Stability Indicator
GPI index National Sovereignty Indicator
Corruption’s Absence Indicator National Security Indicator Resource Governance Indicator
Isolated indicator Resource Profitability Indiactor Resource Profitability Indiactor
Source: Author
Table 6-Pairwise comparison matrix
Referring to the themes listed 1 to 9 in the first page of the questionnaire, you are requested to wear your judgment in terms of "more important than" by comparing issues by pair. Example: if you believe that "the future of your children" (theme 5) is more important than "political stability and governance" (Theme 2), you will enter the number 5 in the case of intersection between column 5 and line 2 of the table.
1 2 3 4 5 6 7 8 9 1 2 3 4 5 6 7 8 9 Source: Author