VARIABILITÉ SPATIALE ET TEMPORELLE DU
COEFFICIENT D'ABSORPTION DE LA L UMIÈRE PAR LE
PHYTOPLANCTON DES MERS ARCTIQUES
CANADIENNES
Mémoire présenté
dans le cadre du programme de maîtrise en océanographie en vue de l'obtention du grade de maître ès sciences
PAR
© Corinne Bourgault Brunelle
UNIVERSITÉ DU QUÉBEC À RIMOUSKI Service de la bibliothèque
Avertissement
La diffusion de ce mémoire ou de cette thèse se fait dans le respect des droits de son auteur, qui a signé le formulaire « Autorisation de reproduire et de diffuser un rapport, un mémoire ou une thèse ». En signant ce formulaire, l’auteur concède à l’Université du Québec à Rimouski une licence non exclusive d’utilisation et de publication de la totalité ou d’une partie importante de son travail de recherche pour des fins pédagogiques et non commerciales. Plus précisément, l’auteur autorise l’Université du Québec à Rimouski à reproduire, diffuser, prêter, distribuer ou vendre des copies de son travail de recherche à des fins non commerciales sur quelque support que ce soit, y compris l’Internet. Cette licence et cette autorisation n’entraînent pas une renonciation de la part de l’auteur à ses droits moraux ni à ses droits de propriété intellectuelle. Sauf entente contraire, l’auteur conserve la liberté de diffuser et de commercialiser ou non ce travail dont il possède un exemplaire.
Composition du jury :
Prof. Suzanne Roy, présidente du jury, ISMER-UQAR
Dr Pierre Larouche, directeur de recherche, Institut Maurice-Lamontagne Prof. Michel Gosselin, codirecteur de recherche, ISMER-UQAR
Dr Emmanuel Devred, membre externe, Institut océanographique de Bedford
Dépôt initial le 17 mai 20 Il Dépôt final le 27 avril 2012
AVANT-PROPOS
Ce mémoire de maîtrise traite de la variabilité spatiale du coefficient d'absorption de la lumière par le phytoplancton des mers arctiques dans le détroit et la baie d'Hudson, la baie de Baffin, l'archipel arctique canadien et le golfe d'Amundsen. Il traite également de la variabilité de ce coefficient dans le golfe d'Amundsen au cours de trois saisons (i.e. à l'automne 2007, au printemps 2008 et à l'été 2008). Cette étude vise l'amélioration des connaissances sur les propriétés optiques inhérentes de l'eau de mer et le développement de modèles bio-optiques appropriés pour les milieux polaires. Ce mémoire est une contribution aux programmes canadiens de recherche Étude du chenal de séparation circumpolaire 1 Circumpolar Flaw Lead (CFL) system study et ArcticNet, un réseau de centres d'excellence du Canada (RCE).
Ce mémoire se compose d'un résumé et d'une introduction générale en français, d'un chapitre central rédigé sous forme d'article scientifique en anglais et d'une conclusion générale en français. Cet article a été soumis et accepté au Journal of Geophysical Research - Oceans, édition spéciale de CFL. Les résultats de ce travail ont été présentés à plusieurs rencontres scientifiques sous forme d'affiche (en 2008: Ocean Optics Conference, Accra, ltaly, Assemblée générale annuelle de Québec-Océan, Rivière-du-Loup et Arctic Change Conference, Québec; en 2009 : Assemblée générale annuelle de Québec-Océan, Rimouski, CFL All-Hands Meeting, Winnipeg et au colloque de vulgarisation scientifique La biologie dans tous ses états des étudiants aux cycles supérieurs de l'Université du Québec à Rimouski (UQAR), Rimouski.
Je tiens à remercier les professeurs Suzanne Roy (ISMER-UQAR) pour son aide précieuse lors de l'analyse des pigments, Huixiang Xie (ISMER-UQAR) pour m'avoir permis d'analyser les données concernant l'absorption de la lumière par la matière dissoute et colorée dans le golfe d'Amundsen (projet CFL) et Yves Gratton (INRS-ETE) pour m'avoir fourni les profils de température et de salinité de la colonne d'eau. Un remerciement spécial aux officiers et à l'équipage du navire de recherche NGCC Amundsen pour leur soutien logistique et technique lors des missions dans l'Arctique canadien, à Sélima Ben Mustapha pour l'échantillonnage lors de la mission ArcticNet 2007, à Eva Alou pour les analyses pigmentaires, à Mathieu Ardyna, Benoît Philippe et Joannie Ferland pour la collecte des échantillons et l'analyse fluorométrique de la chlorophylle a ainsi qu'à Christopher-John Mundy et Luc Bourgeois pour le calcul et l'interprétation du coefficient d'absorption de la lumière par le phytoplancton.
Cette étude a été financée par le programme de l'Année polaire internationale du Gouvernement du Canada, le Conseil de recherches en sciences naturelles et en génie du Canada (CRSNG) et le réseau des centres d'excellence (RCE) ArcticNet. Je remercie les membres du jury pour leur support, l'Institut des sciences de la mer de Rimouski et surtout, mes diœcteurs de recherche pmu les bomses d'études qu'ils m'ont attribuées dmant ma maîtrise ainsi que le Programme de formation scientifique dans le Nord du ministère des Affaires indiennes et du Nord pour son appui financier lors du travail en mer.
RÉSUMÉ
Les spectres d'absorption de la lumière par le phytoplancton (<ltp(Â,)) des mers arctiques on été mesurés dans les eaux du détroit et de la baie d'Hudson, de la baie de Baffin, de l'archipel canadien et du golfe d'Amundsen. Les algues, principalement dominées par le picophytoplancton « 5 /-Lm), n'était pas la composante principale des eaux
arctiques tandis que la matière organique colorée et dissoute (CDOM) représentait près de 70% du bilan total d'absorption de la lumière. À l'automne, les faibles valeurs d'absorption spécifique par le phytoplancton (<ltp * (443) = <ltp( 443 )/TChl a) ont été expliquées par les processus d'acclimatation observés dans les milieux limités en lumière et/ou en nutriments. Cette limitation et la présence importante de CDOM (absorbant fortement les ultraviolets) semblent favoriser la croissance du phytoplancton ayant des pigments accessoires qui absorbent la lumière à de plus grandes longueurs d'onde. Le ratio des caroténoïdes photoprotecteurs et photo synthétiques (PPC:PSC), inversement proportionnel à la salinité et la taille des cellules, décroit vers le Haut-Arctique canadien. Les valeurs de a.q, *(443) les plus élevées furent observées dans les eaux du golfe d'Amundsen de mai à juin 2008 (printemps/été) et dans le système de la baie d'Hudson de septembre à octobre 2005 (automne), régions spatio-temporelles relativement moins limitées en lumière et/ou en nutriments. Ces résultats permettront éventuellement d'améliorer les modèles bio-optiques de télédétection dans le but de suivre de façon plus efficace les changements imminents de l'océan Arctique.
ABSTRACT
Phytoplankton light absorption spectra (~O,,)) were measured in the Canadian Arctic (i.e. the Amundsen Gulf, Canadian Arctic Archipelago, northem Baffin Bay and Hudson Bay system) to improve algorithms used in remote-sensing models of primary production. The algae, mostly dominated by picophytoplankton
«
5 /.lm), was not the major light absorption factor in the four provinces; the colored dissolved organic matter (CDOM) contributing up to 70% of total light budget. During the fall, the low total chlorophyll a-specific acj> * (443) (~( 443 )/TChl a) coefficients of the Canadian High Arctic were associated to acclimation processes occurring in light- and/or nutrients-limited environments. Those limitations and high proportion of CDOM (absorbing strongly the ultraviolet) seem to allow the growth of phytoplankton with accessory pigments absorbing light at longer wavelengths. The ratio of photoprotective and photosynthetic carotenoids (PPC:PSC), inversely proportional to the salinity and the cell size, decreases throughout the Canadian High Arctic. The highest acj>*(443) values were observed in the Amundsen Gulf from May to July (i.e. spring/summer) as well as in the Hudson Bay system from September to October (i.e. faU) , spatio-temporal regions relatively less limited by light and/or nutrients availability. These results will ultimately allow the accurate monitoring of phytoplankton biomass and productivity evolution that is likely to take place as a result of the fast-changing Arctic environment.TABLE DES MATIÈRES
AVANT -PROPOS ... VII RÉSUMÉ ... IX ABSTRACT ... XI TABLE DES MA TIÈRES ... XIII LISTE DES TABLEAUX ... XV LISTE DES FIGURES ... XVII
1. INTRODUCTION GÉNÉRALE ... 19
1.1. LA PROBLÉMATIQUE •••••••••••••••••••••••••••••••••••••••.••••••••••••••••••••••••.••••••••••••••••••• 19 1.2. LES OBJECTIFS DE L'ÉTUDE •••••••••••••••••••••••••••••••••••••••••••••••••••••.••••••••••••••••••• 23 1.3. LES CONCEPTS FONDAMENTAUX ... 24
2. V ARIABILITY OF PHYTOPLANKTON LIGHT ABSORPTION IN CANADIAN ARCTIC SEAS ... 27
2.1 INTRODUCTION ... 28
2.2 MATERIALS AND METHODS •••••••••••••••••••••••••••••••••••••••••••••••••••••••••••••••••••••••• 30 2.2.1 Data Sampling ... 30
2.2.2. Pigment composition and taxonomy ... 31
2.2.3. Phytoplankton size structure ... 32
2.2.4. Particulate and aIgaI absorption measurements ... 33
2.2.5. Colored dissolved organic matter (CDOM) absorption measurements ... 34
2.3 RESUL TS AND DISCUSSION •••••••••••••••••••••••••••••••••••••••••••••••••••••••••••••.••••••••••••• 38 2.3.1. Absorption Budget ... 38 2.3.2. Regional variability ... 42 2.3.3. Vertical variability ... 50 2.3.4. Seasonality ... 56 2.4. CONCLUSION •••••••••••••••••••••••••••••••••••••••••••••••••••••••••••••••••••••••••••••••••••••••••••••••• 57 3. CONCLUSION ... 59 4. RÉFÉRENCES BIBLIOGRAPHIQUES ... 60
LISTE DES TABLEAUX
Table 1. Symbols and abbreviations ... 37 Table 2. Phytoplankton (aq,), non algal material (ana) and colored dissolved organic matter (acdom) absorption coefficients at 443 nm, their relative contributions to the total nonwater absorption (at-w) and chlorophyll a concentration measured by fluorometry (ChI aFluo) in surface waters (Z:S ZSO%) of the four oceanographic provinces. Average, SD (in parentheses) and range are shown; n = number of observations ... .41 Table 3. Constants for the power law regression aq,(443) = Aq,(443)[TChl a]Bq,(443) at 443 nm
for surface (Z :S ZSO%) and deeper waters (Z > ZSO%). Regressions including all depths are shown where r2 is the coefficient of determination, n is the number of observations. Range, mean and SD of TChl a used for the regression are presented for each province. No regression has been calculated for the Canadian Arctic Archipelago; the range of TChl a in surface waters was too short.. ... 55
LISTE DES
FIGURES
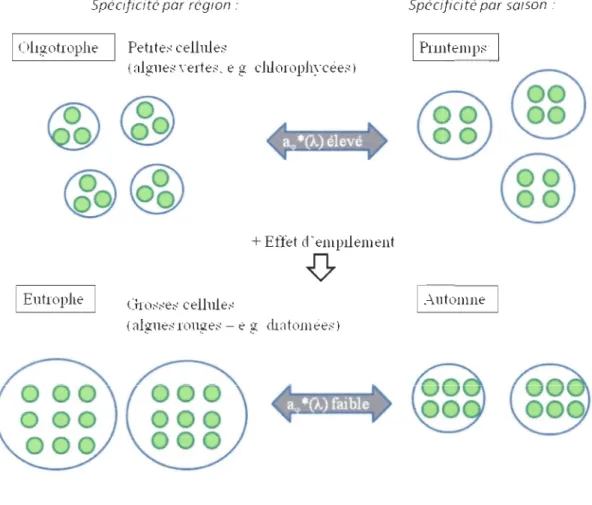
Figure a. Schéma explicatif de la variation du coefficient spécifique d'absorption de la lumière par le phytoplancton ~
*
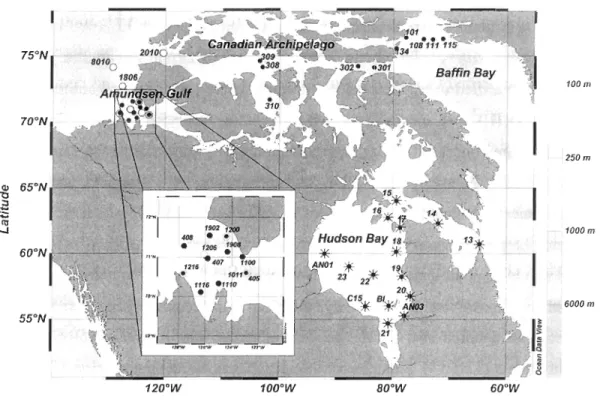
(À) et de l'effet d'empilement des pigments dans la cellule en fonction des variations de la taille des cellules et des variations saisonnières ... xxviii Figure 1. Location of sampling stations in the Canadian High Arctic and Hudson Bay system during:*"
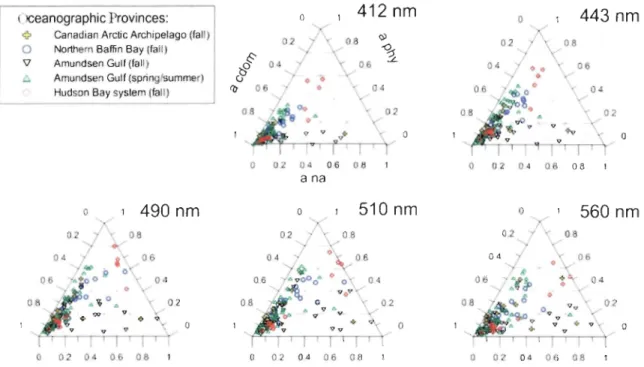
faU 2005, · faU 2007 and 0 spring/summer 2008. The CanadianHigh Arctic is divided in three provinces: Amundsen Gulf, Canadian Arctic Archipelago (stns 301, 302, 308, 309, 310, 2010) and northern Baffm Bay (stns 101, 108, 111, 115, 134) ... 31 Figure 2. Relative contributions of phytoplankton (~), non algal matter (ana) and colored
dissolved organic matter (acdom) to total non-water absorption at five Sea WiFS wavelengths in the four oceanographic provinces (aIl depths). Full grey lines
= acdo
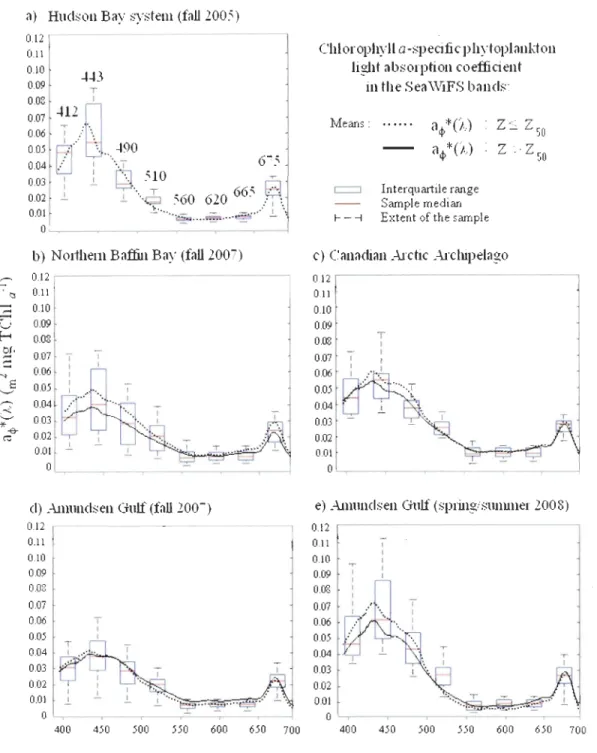
m, horizontal dashed lines = ~ and diagonal dashed lines = ana ... 39 Figure 3. Box plots of the total ChI a-specific light absorption by phytoplankton (~*
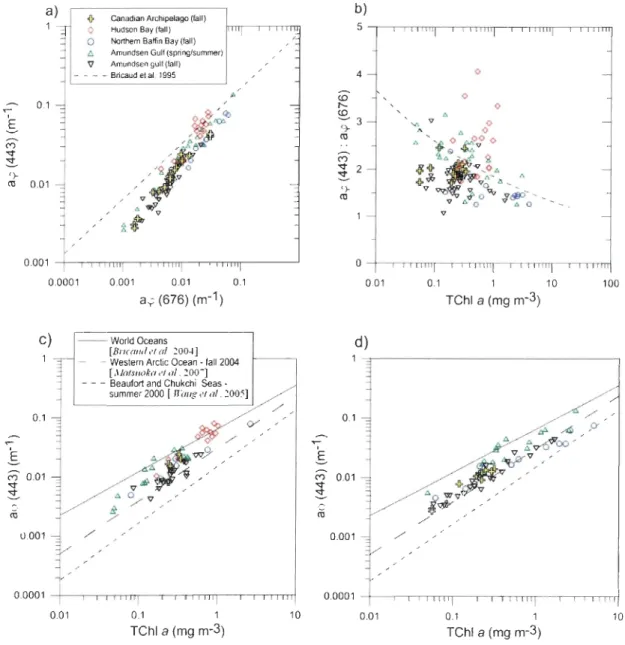
(À)) ofeach oceanographic province at eight Sea WiFS wavelengths. Descriptive statistics were calculated for aU depths, except in the Hudson Bay system where oilly surface waters had been sampled. Spectra averages, between 400 and 700 nm, are shown at the surface for Z :::; Z50 (i.e. > 50% of surface irradiance) and deeper waters for Z > Z50 (i.e. from 50% to 1 % of surface irradiance) ... .43 Figure 4. Variations of (a) the absorption coefficient of phytoplankton ~(443) as a function of the absorption coefficient of phytoplankton ~(676) and (b) the ratio of ~( 44 3) to ~(67 6) as a function of the total ChI a concentrations for aIl depths, shown
in log scale. Dashed lines of figures (a) and (b) represent the regression lines of Babin et al. [2003]. The (c) a,p(443) coefficient as a function of the total ChI a concentrations at the surface (i.e. > 50% of surface irradiance) and (d) deeper waters (i.e. from 50% to 1 % of surface irradiance) are shown. In (c) and (d), regression lines of Wang et al.
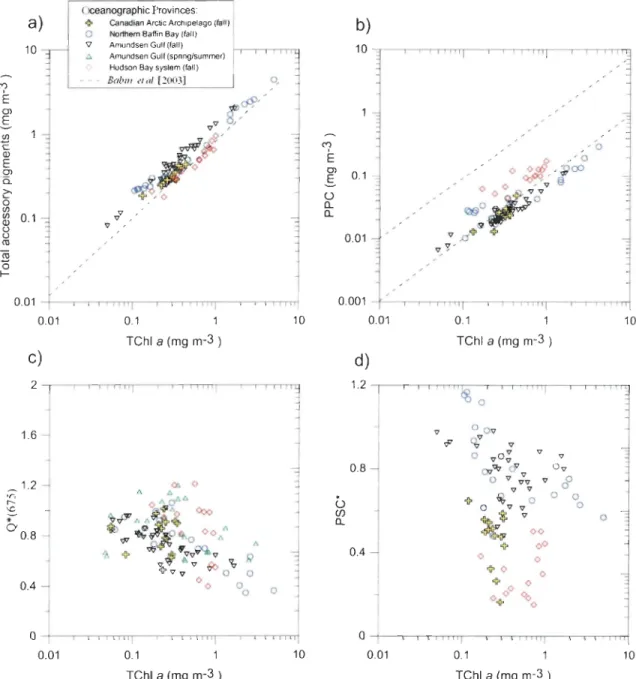
[2005] for the Beaufort and Chukchi seas, Matsuoka et al. [2007] for the western Arctic Ocean and Bricaud et al. [2004] for the World Oceans are drawn for comparison. Note that the absorption coefficient was measured at 440 nm for surface waters in Bricaud et al. [2004], and for aU depths in Matsuoka et al. [2007] and Wang et al. [2005] ... 46 Figure 5. Spatial variations of the (a) total Chi a-specific phytoplankton light absorption coefficient a<jl*(443), (b) blue-to-red ratio a,p(443):a,p(675), (c) relative proportion of picophytoplankton, (d) ratio of photoprotective carotenoids (PPC) and photosynthetic carotenoids (PSC), (e) ratio of Chi band TChl c and (f) salinity in surface waters (i.e. > 50% of surface irradiance) of the Canadian Arctic during faU ... 49 Figure 6. Relationships between total Chi a concentration and (a) total accessory pigments (AccP), the regression of our study corresponds to: AccP
= 0.813(TChi
a)0954 (r2=
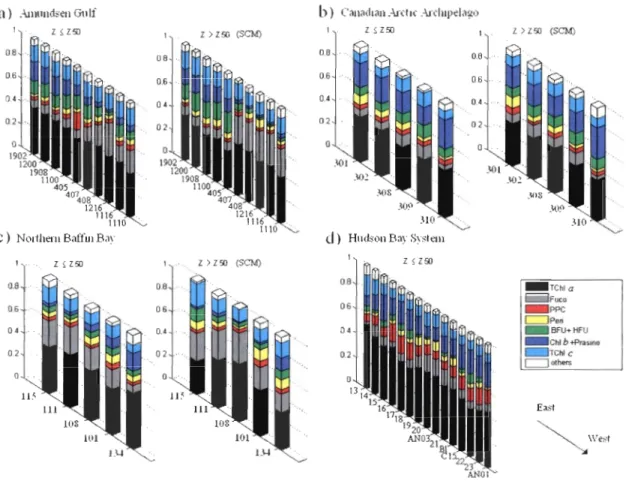
0.92), (b) photoprotective carotenoids (PPC), (c) Package effect index Q*(675) and (d) total ChI a-specific photosynthetic carotenoids (PSC* = PSC/TChl a) in the four oceanographic provinces. Dashed lines represent in (a) regression and (b) approximated range measured by Babin et al. [2003]. Grey boxes represent the Bricaud et al. [2004]'s observation in North Atlantic waters dominated by small ceUs (February to May) ... 52 Figure 7. Relative contribution of the main marker pigments to total pigment concentration(weight-to-weight) in the (a) northern Baffin Bay, (b) Canadian Arctic Archipelago, (c) Amundsen Gulf and (d) Hudson Bay system for surface (Z:S Z50%) and deeper waters (Z > Z50%) of the euphotic zone during faU. See Table 1 for pigment abbreviations ... 54
1.
INTRODUCTION GÉNÉRALE
1.1. LA PROBLÉMATIQUE
L'océan Arctique connaît actuellement une accélération du déclin du couvert de glace de mer (Barber & Hanesiak 2004, Barber et al. 2008, Comiso et al. 2008) offrant ainsi un tout nouvel environnement pour la croissance du phytoplancton (Arrigo et al. 2008). Cette région étant difficile d'accès, la télédétection semble être un moyen efficace pour d'observer dans l'avenir les effets de la fonte du couvert de glace sur l'écosystème marin. Des algorithmes empiriques et semi-analytiques relient à ce jour la couleur des eaux à la biomasse algale (O'Reilly et al. 1998, 2000, Antoine & Morel 1999). Cependant, ces algorithmes ont été développés utilisant principalement des données des mers tempérées et ont montré certaines difficultés à représenter la réalité des milieux polaires (Dierssen & Smith, 2000, Reynolds et al. 2001, Stramska & Stramski 2003, Wang & Cota 2003). Ceci est particulièrement vrai dans les eaux côtières arctiques et subarctiques du Canada qui contiennent des concentrations élevées de matière organique dissoute et colorée (CDOM) (Pegau 2002, Bélanger et al. 2006, Granskog et al. 2007, Matsuoka et al. 2007, 2009, 2011, RetamaI et al. 2007). Cette matière jaune-brun provoque une surestimation de la concentration de chlorophylle a (ChI a) utilisant les algorithmes opérationnels existants. Ainsi, des algorithmes régionaux et adaptés ont été proposés pour améliorer les calculs de la concentration de Chl a dans les eaux de surface des mers arctiques (Wang & Cota 2003, Cota et al. 2004).
Intrinsèquement, ces algorithmes reposent sur la connalssance des propriétés optiques inhérentes des eaux : l'absorption et la diffusion de la lumière par les particules en suspension et par la matière organique dissoute. En particulier, les spectres d'absorption de la lumière par le phytoplancton (a<pOc)) changent en fonction des différentes communautés
phytoplanctoniques (Hoepffner & Sathyendranath 1992, Babin et al. 1993, Lutz et al. 2003,
Sathyendranath et al. 2004, Devred et al. 2005, RetamaI et al. 2008). Ces espèces peuvent
également s'adapter aux différentes intensités lumineuses ambiantes en modifiant leur contenu cellulaire soit en fonction des pigments et/ou des centres réactionnels de la
photosynthèse (Falkowski & Raven 2007). Pour des intensités lumineuses faibles, ces
espèces peuvent augmenter la concentration de pigments par cellule et changer
l'organisation des photo systèmes (Falkowski & Owens 1980). Ainsi, l'efficacité de
l'absorption de la lumière décroît au fur et à mesure que la concentration de pigments par
cellule augmente. Ce phénomène, caractérisé par l'effet d'empilement des pigments
(Falkowski et al. 1985, Morel & Ahn 1990), croit généralement avec la taille et la
concentration des algues de sorte que le coefficient spécifique d' absorption ~
*
(443)(~(443)/Chl a, m2 mg Chi a-I) soit une fonction non linéaire de la concentration de ChI a (Morel & Bricaud 1981, Morel 1991).
De ce fait, la variabilité des spectres ~ *(À) entre 400 nm et 700 nm est en grande
partie expliquée par la taille et la composition pigmentaire du groupe phytoplanctonique
dominant (Ciotti et al. 2002, Bricaud et al. 2004, Roy et al. 2008). Cependant, de petites cellules adaptées à de faibles intensités lumineuses pourraient également être caractérisées par l'effet d'empilement des pigments dans la cellule (Morel 1991). Dans l'océan Arctique
et ses mers adjacentes, de très petites espèces endémiques de picoprasinophytes (Lovejoy et
al. 2007, Tremblay et al. 2009) et adaptées à de faibles intensités lumineuses pourraient donc être caractérisées par de faibles coefficients ~ *(À) (Matsuoka et al. 2007, 2009, 20 Il, Wang et al. 2005). Il semble alors être essentiel d'améliorer nos connaissances de la
variabilité saisonnière et régionale du coefficient ~
*
(À) utilisé dans les algorithmes de télédétection et les modèles bio-optiques de production primaire (Sathyendranath et al. 2001,2004, Devred et al. 2006, Pabi et al. 2008, Arrigo et al. 2011) en Arctique.21
Finalement, les propriétés physiques de la colonne d'eau et la disponibilité en nutriments influencent la répartition et la taille du phytoplancton en Arctique. Ceci cause en grande partie la variabilité des propriétés d'absorption de la lumière selon les régions. Le Haut-Arctique canadien est divisé en trois régions de propriétés physiques, chimiques et biologiques différentes: (1) la mer de Beaufort comprenant le plateau du Mackenzie et le golfe d'Amundsen, (2) l'archipel arctique canadien et (3) la baie de Baffin. Dans la partie nord de la baie de Baffm se trouve l'une des plus grande polynie de l'Arctique, la polynie des eaux du Nord (Ingram et al. 2002). Cette polynie récurrente se crée par la fOlmation d'embâcles de glaces au nord et un fort écoulement vers le sud (Melling et al. 2001, Ingram et al. 2002). Le courant groenlandais transporte par ailleurs une masse d'eau plus chaude et plus salée provenant du sud-est (masse d'eau de l'Atlantique) créant des conditions physiques et biologiques différentes dans l'axe ouest-est du nord de la baie de Baffin (Melling et al. 2001, Ingram et al. 2002). Lors de la prolifération printanière du phytoplancton, c'est le long de la côte du Groenland que l'on retrouve une majorité de diatomées comparativement aux eaux plus froides le long de la côte canadienne contenant davantage de flagellées (Vidussi et al. 2004). L'amplitude et la durée de la prolifération des algues dans cette région seraient relativement importantes et contrôlées par l'apport d'éléments nutritifs dans la zone euphotique induit par le vent (Tremblay et al. 2002).
À la [m de l'été, la taille des cellules entre 2 et 10 !lm tend à augmenter dans la baie
de Baffin relativement aux autres régions du Haut-Arctique canadien (Tremblay et al. 2009). D'après la même étude, le picophytoplancton
«
2 !lm) serait plus abondant dans lepassage du nord-ouest et composé d'eucaryote (i.e. prasinophyceae micromonas). Ce passage, situé dans l'archipel canadien, relie la baie de Baffin et la mer de Beaufort créant ainsi un réseau complexe des caractéristiques biogéographiques. Le couvert de glace dans cette région participe également au contrôle des processus biologiques et au piégeage du dioxyde de carbone; les algues de glace étant pratiquement broutées au fur et à mesure lorsqu'elles se détachent du couvert de glace peuvent par ailleurs être exportées rapidement vers le fond lors de la fonte printanière (Fortier et al. 2002).
Les variations saisonnières extrêmes du couvert de glace, de la température, de
lumière, de turbidité et des courants s'observent également dans le golfe d'Amundsen, au
sud-est de la mer de Beaufort, incluant la polynie du Cape Bathurst. Lors de la fonte du couvert de glace du plateau du Mackenzie, les eaux douces et turbides du fleuve Mackenzie
se propagent en partie vers le golfe d'Amundsen accentuant ainsi la stratification déjà
causée par l'eau douce des glaces fondues (Carmack et al. 2004). La production primaire de
la baie de Franklin (golfe d'Amundsen) ainsi que de l'océan Arctique en général, serait
également davantage influencée par la disponibilité en nutriments et des apports d'eau douce que par le changement d'intensité lumineuse en période d'eau libre (Tremblay et al. 2008).
Dans le Bas-Arctique canadien, le système de la baie d'Hudson se sépare de la
même façon en trois régions: (1) la baie d'Hudson, (2) le détroit d'Hudson et (3) le bassin
de Foxe. La baie d'Hudson, grandement influencée par les apports d'eau douce des rivières près des côtes, est partiellement couverte de glace durant l'hiver et est caractérisée par une très grande variabilité des propriétés optiques inhérentes ainsi que des paramètres
biologiques comparativement au détroit d'Hudson et au bassin de Foxe (Granskog et al.
2007, Lapoussière et al. 2009). Ainsi, cette vaste zone d'étude peut induire une variabilité
spatiale considérable du coefficient d'absorption de la lumière par le phytoplancton des mers arctiques.
23
1.2. LES OBJECTIFS DE L'ÉTUDE
Les objectifs de cette étude sont: (1) de répertorier la variabilité spatio-temporelle des spectres d'absorption de la lumière par le phytoplancton du Haut- et Bas-Arctique canadien entre les différentes périodes d'éclairement et (2) de comparer la variabilité du coefficient d'absorption ~
*
(À.) selon les paramètres biologiques (i.e. taille des cellules etpigments) et physiques (stratification des eaux, absorption particulaire (anaCÀ.)) et dissoute (acdom(À.)) de la matière) disponibles. L'hypothèse de travail est que les variations saisonnières extrêmes d'éclairement et des propriétés biogéochimiques, ainsi que la présence d'espèces endémiques et adaptées dans cette grande zone d'étude, influencerait de façon significative les propriétés d'absorption de la lumière par le phytoplancton en fonction des régions et des saisons.
Pour ce faire, les données de cette étude, collectées à bord du brise glace canadien NGCC Amundsen dans le cadre du programme canadien de recherche ArcticNet, ont été collectées dans la baie d'Hudson, le nord de la baie de Baffin, l'archipel arctique canadien et le golfe d'Amundsen permettant ainsi de comparer les diverses régions à l'automne
2007. De plus, le programme de recherche Circumpolar Flaw Lead (CFL) a permis d'échantillonner les eaux du golfe d'Amundsen au printemps et à l'été 2008 dans le cadre du programme canadien de l'année polaire internationale permettant d'observer les variabilités saisonnières de cette région. Plusieurs profondeurs de la zone euphotique ont été échantillonnées incluant les maximums de chlorophylle sous la surface afin de vérifier si différentes intensités lumineuses et disponibilités en nutriments modifieraient les propriétés d'absorption de communautés phytoplanctoniques distinctes. Par contre, seulement les eaux de surface ont été échantillonnées dans le système de la baie d'Hudson.
1.3. LES CONCEPTS FONDAMENTAUX
Les facteurs déterminants du coefficient a<p (À) sont la taille des cellules, leur forme et leur composition pigmentaire (Kirk 1984). Il est possible de diviser en deux grandes classes les groupes phytoplanctoniques d'un point de vue optique soit; le groupe des prasinophyceae et chlorophycea (pigments de ChI b + MgDVP + prasinoxanthin + néoxanthin
+
violaxanthin) et ensuite le groupe des bacillariophyta, dinophyta, prymnesiophycea et chrysophycea (pigments de TChl c+ fucoxanthin
+ diadinoxanthin)
(Jeffrey et al. 1997, Vidussi et al. 2004). Ces deux groupes représentent en fait les algues vertes (contenant la Chl b) et les algues brunes (contenant la Chl c). Ces deux catégoriessont également reliées respectivement aux petites cellules, caractérisées par les caroténoïdes photoprotectrices (PPC), et aux grandes cellules, caractérisées par les caroténoïdes photosynthétiques (PSC) (Vitz et al. 2006, Moreno et al. 2012).
La figure a illustre que les cellules de petites tailles, provenant des milieux oligotrophes, sont naturellement caractérisées par des coefficients aq,
*
(À) élevés. Dans les milieux eutrophes, les cellules de plus grandes tailles sont caractérisées par des coefficients aq,*
(À) faibles causés par l'effet d'empilement des pigments dans la cellule. D'un point de vue saisonnier, les espèces phytoplanctoniques peuvent s'adapter aux diminutions de l'éclairement et de la disponibilité en nutriments au cours de la saison en eaux libres. Pour ce faire, le nombre de pigment par cellules augmente de même que l'effet d'empilementdiminuant ainsi les coefficients aq, *(À). La figure a montre qu'une biomasse élevée au
printemps non limitée en lumière et en nutriments possède des coefficients aq, * (À) élevés. À l'automne, les facteurs limitant la croissance du phytoplancton entraîneraient également une diminution du coefficient aq> *(À). Les communautés phytoplanctoniques peuvent donc s'adapter aux milieux de faibles intensités lumineuses, si les apports en nutriments sont insuffisants (Dubinsky & Stambler 2009). Il a été observé que les proportions de
xanthophylles peuvent également être plus faibles si le cycle des xanthophylles, moyen rapide de photoacclimatation (Demers et al. 1991), est moins actif (Kashino et al. 2002).
25
Spécificité par région .' SpéCificité par saison .'
Ohf!:otIophe Petlteo' cellule:::: Pnntemp:::: (alglle:::: yerte::::, e g chlorophyceeo')
+ EtIet d'empuement
V
Gro::::"e:::: cell1l1e~ 1·-\lltoIllne: 1 ullglle::::rOllf!:e:::: - t'.f!: cuatomee::::)
Figure a. Schéma explicatif de la variation du coefficient spécifique d'absorption de la
lumière par le phytoplancton aq, *(À) et de l'effet d'empilement des pigments dans la cellule
2. VARIABILITY OF PHYTOPLANKTON LIGHT
ABSORPTION IN CANADIAN ARCTIC SEAS
2.1 INTRODUCTION
The Arctic Ocean is currently experiencing significant changes caused by the sea-ice coyer dec1ine [Barber and Hanesiak, 2004; Barber et al., 2008; Comiso et al., 2008] opening a whole new environment for phytoplankton growth [Arrigo et al., 2008].
Considering the difficulty to access the region, remote sensing is probably the best method
to monitor the effects of ice coyer decrease on the marine ecosystem. Empirical and semi-analytic algorithrns already exist to link remote sensing reflectance to phytoplankton biomass [0 'Reilly et al., 1998, 2000; Antoine and Morel, 1999]. These algorithrns have,
however, been developed mostly using non polar open ocean data and have been shown to be biased for polar waters [Dierssen and Smith, 2000; Reynolds et al., 2001; Stramska and
Stramski, 2003; Wang and Cota, 2003]. This is particularly true in the coastal waters of the
Canadian Arctic and Subarctic as those waters contain high concentrations of colored
dissolved organic matter (CDOM) [Pegau, 2002; Bélanger et al., 2006; Granskog et al.,
2007; Matsuoka et al., 2007, 2009, 2011; Retamai et al., 2007] leading to an overestimation
of the chlorophyll a (ChI a) concentrations using current operational algorithrns. Regionally
adapted algorithrns have been proposed for the Arctic to improve the retrieval of the Chi a
concentration [Wang and Cota, 2003; Cota et al., 2004].
Light reflectance from the sea is a function of the absorption and scattering of partic1es and dissolved matter. In particular, the phytoplankton light absorption spectra ('4(À)) changes with different phytoplankton cornrnunities [Hoepffner and Sathyendranath, 1992; Babin et al., 1993; Lutz et al., 2003; Sathyendranath et al., 2004; Devred et al., 2005;
RetamaI et al., 2008]. The deterrninant factors of the '4(À) variability are the pigments and the cell Slzes [Kirk, 1994]. Phytoplankton species can adapt to variable irradiance by
altering their cellular content in light-harvesting pigments and/or reaction centers
[Falkowski and Raven, 2007]. When exposed to low light, phytoplankton usually increases their pigment concentration and changes the organization of these pigments within their photosynthetic units [Falkowski and Owens, 1980]. The efficiency of light absorption
29
decreases as the pigment concentration per cell increases. This phenomenon, the package
effect [Falkowski et al., 1985; Morel and Ahn, 1990], generally increases with ceIl size and phytoplankton concentration making the Chi a-specific phytoplankton light absorption coefficient ~*(443) (~(443)/Chl a, m2 mg Chi a-I
) a nonlinear function of ChI a concentration [Morel and Bricaud, 1981; Morel, 1991].
Nowadays, most of the natural variability in the spectral shape of ~
*
(À) between 400 and 700 nm ean be explained by the dominant phytoplankton group and cell size[Ciotti et al., 2002; Bricaud et al., 2004; Rayet al., 2008]. However, small phytoplankton cells photoadapted to low light eould experienee an important package effect [Morel, 1991]. In the Aretie Ocean and adjacent seas, endemic picoprasinophytes adapted to low light [Lovejoy et al., 2007; Tremblay et al., 2009] and weak nutrients supply [Dubinsky and Stambler, 2009] eould consequently have weak ~
*
(À) values [Matsuoka et al., 2007, 2009,2011; Wang et al., 2005]. It thus appears essential to improve the knowledge of the
seasonal and regional variations of ~ *(À) for the development of ocean color remote sensing algorithms and phytoplankton light absorption models that will provide an accurate estimation of primary production in the Aretic [Sathyendranath et al., 2001, 2004; Devred et al., 2006; Pabi et al., 2008; Arrigo et al., 2011].
The objectives of this study are 1) to determine the main variability sources of ~
*
(À) and 2) characterize spatial and temporal variations of phytoplankton absorption spectra, inc1uding the light budget, in the different oceanographic provinces of the Canadian Aretic. A large datas et of absorption spectra has been gathered and analyzed regarding available physieal (i.e. water stratification, absorption by non al gal material (ana) and colored dissolved organic matter (8.cdom» and biological (i.e. ceIl sizes and algal pigments) parameters. Our hypotheses are that 1) spatial variability in phytoplankton light absorption spectra is explained by differences in phytoplankton ceIl size and water column stratification and 2) the low of ~*
(À) values is related to the decrease of solar elevation and incident irradianee.2.2 MA TERIALS AND METHODS
2.2.1 Data Sampling
Sampling was conducted in the Hudson Bay system from 22 September to 13 October 2005 and in northern Baffin Bay, Canadian Arctic Archipelago and in the Amundsen Gulf from 19 October to 15 November 2007, onboard the icebreaker CCGS
Amundsen as part of the Canadian research program ArcticNet (Figure 1). Those three
aforementioned oceanographic provinces are identified as the Canadian High Arctic.
Additional data were obtained in the Amundsen Gulf from 8 May to 6 July 2008 during the
International Polar Year-Circumpolar-Flaw Lead system study (IPY-CFL).
In the present study, spring/surnrner and faU are defmed as the time period between 8 May and 6 July and between 22 September and 15 November, respectively. At each station, the depth of the euphotic zone was determined with a Secchi disk and vertical profiles of temperature (OC), salinity (psu) and in vivo fluorescence were performed using a Sea-Bird 911 plus CTD probe equipped with a SeaPoint chlorophyll fluorometer. Water
samples were collected with 12 L Niskin-type bottles (OceanTest Equipment) at three
optical depths (50%, 10% and 1 % of surface irradiance), at depth of the subsurface chlorophyIl fluorescence maximum (SCM) and at 60 m. In addition, surface samples (l00% surface irradiance) were also collected using a c1ean bucket. This strategy was used for aIl cruises except for Hudson Bay system where samples were only taken at the surface.
The verticallight attenuation coefficient (k in m-1) was calculated using the formulation of
31 Baffin Bay 100m 250m 1000m 6000 m BOOW 600W Longitude
Figure 1. Location of sampling stations in the Canadian High Arctic and Hudson Bay
system during:
*
faU 2005, • faU 2007 and 0 spring/summer 2008. The Canadian HighArctic is divided in three provinces: Amundsen Gulf, Canadian Arctic Archipelago (stns
301,302,308,309,310,2010) and northem Baffin Bay (stns 101, 108, 111, 115, 134).
2.2.2. Pigment composition and taxonomy
Samples (1.5 to 2.0 L) for pigment composition were filtered onto 25 mm Whatman
GFIF glass-fiber filters (nominal porosity of 0.7 !lm), stored in cryovials and frozen in
liquid nitrogen until measurement by reverse-phase high-performance liquid
chromatography. Pigments were extracted from the filter in ice-cold 95% methanol using a
sonicator (Ultrasonic Processor XL 2010). The extracts were cleared from the filter by centrifugation and further filtered on a 0.22 !lm PTFE syringe filter. A 50 !lL extract was then injected in a reversed phase C8 Waters Symmetry column (150 x 4.6 mm, 3.5 !lm).
method used was developed by Zapata and Garrido [2000] (mobile phases A and BI, flow rate 1 ml min-l). Pigments were detected using a Thermo Separation FL 3000 fluorescence detector in series with a photodiode array detector (Thermo Separation UV -6000). Pigments were identified using their retention tirne, visible spectrum and comparison with
standards from DHI Water and Environment (H0rsholm, Denmark). This method allowed us to determine the concentrations of the most abundant pigments in each sample with a detection limit of 0.03 mg m-3 for Chl a. The distribution of major and taxonomically significant pigments in algal divisions/classes of Jeffrey et al. [1997] was used to describe phytoplankton communities. As already observed in the Canadian Arctic [Tremblay et al.,
2009], divinyl chlorophyll a and b (i.e. the two major pigments of Prochlorococcus) were not detected in our samples. In this study, total ChI a concentration measured by HPLC method (hereafter denoted as TChl a) was defined as the sum of Chl a, chlorophyllide a,
and pheophorbide a (Table 1). Samples for the identification and enumeration of eukaryotic cells were collected at the surface and at the bottom of the euphotic zone, preserved in
acidic Lugol's solution [Parsons et al., 1984] and then stored in the dark at 4°C until analysis. Cells > 2 !lm were identified to the lowest possible taxonomic rank and enumerated under an inverted microscope (Wild Heerbrugg) equipped with phase contrast optics [Lund et al., 1958].
2.2.3. Phytoplankton size structure
Samples were filtered onto 25 mm Whatman GF/F glass-fiber filters, 5 !lm
Nuclepore polycarbonate membranes and 20 !lm Nitex screens for the determination of the
Chl a biomass of pico-
«
5 !lm), nano- (5 - 20 !lm) and microphytoplankton (> 20 !lm).After 24 h extraction in 90% acetone at 4°C in the dark, ChI a concentrations were determined on a lü-AU Turner Designs fluorometer (acidification method [Parsons et al.,
1984]). In addition, fluorometric measurements of Chl a retained on the GFIF filters
(hereafter denoted as Chl aF1uO) were used to provide a global view of the spatial distribution of phytoplankton biomass. The relative biomass of each size class determined
33
above was compared with HPLC pigment-derived classes methods [Vidussi et al., 2001;
Vitz et al., 2006]. The relative biomass of small phytoplankton cells (0.2 - 20 /lm) was
underestimated by the pigment composition method since zeaxanthin (a tracer of
picophytoplankton) and alloxanthin (a tracer of nanophytoplankton) were not detected in
our samples. Hence, the phytoplankton size structure was determined fi'om the fluorometric
method.
2.2.4. Particulate and algal absorption measurements
At selected stations, samples (1.5 to 2.0 L) for the measurement of the spectral
absorption of particulate matter were filtered under low vacuum onto 25 mm Whatman
GFIF glass-fiber filters. Blank filters were made regularly by filtering distilled water onto
GF IF filters. Filters were stored in Petri dishes and kept frozen in liquid nitrogen until
laboratory analysis. The transmittance-reflectance (T-R) method was used to measure in
vivo light absorption by aquatic particles retained on the filter [Tassan and Ferrari, 2002].
This method is recommended in coastal regions (Case 2 waters) containing highly
scattering matter. The optical density (OD, dimensionless) of these filters, before (ODp(À))
and after (ODna(À)) methanol extraction [Kishino et al., 1985], was measured using a dual
beam Perkin-Elmer Lambda 2 spectrophotometer equipped with a 50 mm integrating
sphere (Labsphere RSA-PE-20). Aigai pigments from the filters were extracted using 95%
methanol [Kishino et al., 1985] since (1) no unextractable pigments were detected and (2)
no significant difference between pigment extraction solvents (i.e. methanol, acetone
[Bricaud and Stramski, 1990] and sodium hypochlorite [Tassan and Ferrari, 2002]) has
been reported in the literature. Scans were conducted at 1 nm intervals from 300 to 800 nm
at a speed of 240 nm min-1• Baseline and null corrections were performed by subtracting
the ODf of a fully hydrated blank filter and the averaged ODf values between 790 and
800 nm from ODp(À) and ODna(À) [Bab in and Stramski, 2002]. The ODp and ODna
coefficients were transformed into their equivalent OD value in suspension (ODsus(À)). The
retained on filters (ODs(Â,)) and particles in suspension (ODsus(Î,,)) for mixed cultures and
various filter types [Mitchell, 1990]. The particulate ap(À) and non algal anaCÀ) absorptions
were obtained by equations given by Tassan and Ferrari [2002] using ODsus(À), filtered
volume of seawater and the area of the filter. The phytoplankton light absorption coefficient
(<4(À) , m-I) was determined using the following equation: <4(À)
=
ap(À) - anaCÀ) (m-l). TheTChl a-specifie absorption coefficient of phytoplankton (<4 *(À), m2 mg TChl a-l) was
calculated as: <4 * (À)
=
<4(À)/TChl a, where TCh! a is the total chlorophyll a concentrationmeasured by HPLC (mg m-3; see Table 1). When TCh! a values were not available, they
were estimated from a linear regression between TChl a and ChI aFluo. For Ch! aFluo
concentrations ranging from 0.059 to 5.0 mg m-3, the regression equation is:
TCh! a = 0.825(Chl JIUO) (r2 = 0.90, n = 62) setting intercept equals to zero.
2.2.5. Colored dissolved organic matter (CDOM) absorption measurements
At selected stations, water samples were filtered using 0.2 /-lm Anotop® filters. The
filtrates were kept in HCI-cleaned bottles at -20°C in the dark. The OD of CDOM
(ODcdom(À)) was measured from 200 to 800 nm at 1 nm intervals using a Perkin-Elmer
Lambda 2 spectrophotometer in a 10 cm quartz cell. Scan speed was 240 nm min-I
. The
CDOM absorption coefficient (acdom(À)) was calculated as: acdom(À) = 2.303(ODcdom(À)
-ODcdom(600))/0.1 (m-l), where ODcdom(600) is the averaged OD value between 590 and
600 nm [Fargion and Mueller, 2000].
2.2.6. Data processing and statistical analyses
The relative absorption contributions of phytoplankton (acjl) , non algal (ana) and
colored dissolved organic matter (acdom) to the total nonwater absorption (at-w) were
caIculated at five Sea WiFS wavelengths (Figure 2). The at-w is defined as: at-w(À) = <4(À)
+
anaCÀ) + acdom(À) (m-I). The Brunt-Viiisiiiii frequency (N2 in S-2), a water stratification index,
35
the gravitational acceleration, p (kg m-3) is the seawater density [Fofonoff and Millard, 1983] and z (m) is the depth. The mixed layer depth (ZMLD) corresponds to the maximum value of N2. The depth interval for these calculations is 1 meter. Interquartile ranges,
extents and me di ans of a~*(À) samples were calculated at eight SeaWiFS wavelengths
(Figure 3). The outliers (i.e. values that are more than 1.5 times the interquartile range away from the interquartile range itself) that do not correspond to observed values of literature [Bricaud et al., 1995, 1998; Babin et al., 1996; Allali et al., 1997; Matsuoka et al., 2007;
Roy et al., 2008] were removed. The relationships between ~(À) and TChl a were calculated according to the following equation: ~(À) = A~(À) (TChl a)B$O") (m-1) [Bricaud et al., 1998], where A~ and B~ are regression's constants. TChl a and a~(443) regressions were base 10 log-transformed. The package effect was estimated (hereafter denoted as Q*(675» using the ratio between Chl a-specific phytoplankton light absorption coefficients (~*(675» and specific absorption coefficient of Chl a in solution (0.033 m2 mg Chl a-') at the wavelength 675 nm [Johnsen and Sakshaug, 2007; Roy et al., 2008]. This ratio assumed that ChI a is the main light absorbing pigment at 675 nm. The ratio Q*(675) (dimensionless) ranging from 1 (unpackaged pigments) to 0.10 (strong packaging), where values ab ove 1 indicate missing absorption terms [Bricaud et al., 2004, Roy et al., 2008]. The total concentration of pigments per cell also provided an estimation of package effect level.
Before performing parametric tests, the normality of distribution of the data was verified by the Lilliefors test. A one-way analysis of variance (ANOVA) and a multiple comparison of me ans using Tukey's HSD criterion were then conducted to find any significant differences (p < 0.05) between the four oceanographic provinces. Cluster analysis, the single method using the nearest neighbor by Euc1idean distance, and multiple linear regressions (y = a,x,
+
a2X2+
b) were used to determine the relationships betweenbiological and/or physical variables. If the norrnality of a distribution was not confirmed, a nonparametric Kruskal-Wallis test was perforrned instead of the ANOV A. The p value is
only mentioned for comparison test. Statistical analyses were conducted using MA TLAB software (version 7.1). Abbreviations are listed in Table 1. The following sections were determined by the data availability; vertical structures were only studied in the Canadian High Arctic and the seasonality variations only in the Amundsen Gulf.
37
Table 1. Symbols and abbreviations
Symbol Definition Unit
ChI aF1uo Chlorophyll a concentration measured by mgm-3 fluorometry
[ChI aF1UO]i Chlorophyll a concentration for parameter i mgm -3
(Chi J luo )Zeu Integrated ChI aFluo over the euphotic zone mgm-2
TChia Total chlorophyll a concentration measured by HPLC (i.e. mgm -3 chlorophyll a (ChI a) + pheophorbide
(Phide a) + chorophyllide (Chlide a))
Chlb Chlorophyll b concentration (HPLC) mgm -3
TChic Total chlorophyll c concentTation (HPLC) (i.e. chlorophyll mgm -3 Cl (Chi Cl) + chlorophyll C2 (ChI C2) +
chlorophyll C3 (Chi C3))
PSC Photosynthetic carotenoids (HPLC) (i.e. fucoxanthin mgm -3
(Fuco) + peridinin (Peri) + 19' -butanoyloxyfucoxanthin
(BFU) + 19' -hexanoyloxyfucoxanthin (HFU) +
~c-carotene )
PPC Photoprotective carotenoids (HPLC) (i.e. diadinoxanthin mgm -3
(DD) + diatoxanthin (DT) + alloxanthin (Allo) + zeaxanthin
(Zea) + ~~-carotene)
AccP Total accessory pigments (HPLC) (i.e. Chi b + TChl C mgm -3
+ PSC + PPC)
SCM Subsurface chlorophyll maximum mgm -3
À Wavelength nm
k Verticallight attenuation coefficient m -1
ap(À) Absorption coefficient of particles m -1 a<t> (À) Absorption coefficient of phytoplanlcton m -1
ana (À) Absorption coefficient of non algal material m -1 acdom (À) Absorption coefficient of colored dissolved organic matter m -1
at-w(À) Total nonwater absorption (~(À) + ana(À) + acdom(À)) m -1
a<t> *(1..) ChI a-specific coefficient absorption of phytoplankton m2 mg TChl a-I
(~(À)/ TChl a)
Q*(675) Package effect factor (~*(675)/ 0.033 m2 mg Chi a-1)
B~, Aq,(443) Constants in the regression between aq,(443) and TChl a
Brunt -Viiisiilii freg uency -2
N s
ZMLD Mixed layer depth m
Z ::::Z50% Depth over or egual to 50% of surface irradiance m
(surface samples)
2.3 RESUL TS AND DISCUSSION 2.3.1. Absorption Budget
The light absorption budget can be used to characterize the water color. This budget is composed of the relative absorption of aq,(À), ana(À) and acdom(À) (i.e. divided by the total nonwater absorption at-w(À)). Table 2 shows that near the phytoplankton absorption maximum, at 443 nrn, the eDOM is generally the major light absorbing compound in surface waters of aU regions, with ~(443) only contributing to 11% of total nonwater
absorption in the Amundsen Gulf, 21 % in the Canadian Arctic Archipelago and 28% in northern Baffin Bay. During the fall, the absorption by non algal (ana(443)) matter was
relatively weak except in the Amundsen Gulf (21 %). In return, the contribution of phytoplankton to light absorption was higher (21 %) than non algal matter (7%) during spring/surnrner in this region. In the Canadian High Arctic, the important contribution of
CDOl\.1 (the J'uTiuudsen Gulf == 70~/û, Cilil1adian .Lt.lsctic i\.rcrJpelago == 72~1o and ncrthern
Baffin Bay = 60%) reflects the global influence of freshwater pathways from Arctic rivers through the area [Macdonald et al., 2005].
In the northern Baffin Bay, surface currents bring saltier Atlantic waters along the Greenland coast while there is a sustained southerly flow of fresher water along Ellesmere Island on the western side [Melling et al., 2001] characterized by higher CDOM concentrations. Near the Amundsen Gulf, the principal source of CDOM is the Mackenzie River outflow located 200 km to the west (418 km3 il) [Carmack et al., 2004; Macdonald et al., 2005; Lammers et al., 2001]. The highest CDOM proportion in percentage was observed in the Hudson Bay system (80%), a large estuarine-like inland sea that receives 760 km3 of freshwater per year from its tributaries [Déry et al., 2011]. The aq,(443)
coefficients only contributing to 13% of absorption budget in the Hudson Bay (except for station ANOl) and up to 65% in the Hudson Strait (Table 2).
39
Oceanographie Provinces: a 1 412
nm
a 443nm
<? Canadian Arctic Archipelago (fall) \SI
0 Northern Baffin Bay (fall)
§ ~
V Amundsen Gulf (fa Il )
:L-b. Amundsen Gulf (spring/summer) ~
Hudson Bay system (fall) lb
a a a 02 04 06 08 a 02 04 06 08 a na 0 510
nm
0 560nm
o a o 02 04 06 08 o 02 04 06 08 a 02 04 06 08Figure 2. Relative contributions of phytoplankton (~), non algal matter (ana) and colored dissolved organic matter (acdom) to total non-water absorption at five SeaWiFS wavelengths in the four oceanographie provinces (ail depths). Full grey lines
=
acdom, horizontal dashedlines = ~ and diagonal dashed lines = ana.
This spatial variability reflects the pattern of freshwater inflows located mostly in the
southern and eastern portions of the Bay while the Hudson Strait region is more influenced
by inputs coming from Atlantic and Arctic [Granskog et al., 2011]. Even though the surface waters eDOM absorption (0.013 - 0.29 m-I) are in the range of European coastal
waters (0.004 - 0.7 m-I
) [Babin et al., 2003], the contributions in percentage are higher.
Those high proportions of eDOM are also observed at other wavelengths (412, 443, 490,
510 and 560 nm), used in the development of ocean color remote sensing algorithms, and aJso at ail depths (Figure 2).
Province Year a~(443) a~(443)/ ana( 443) ana( 443)/ acdom(443) acdom( 443 )/ n ChI /Iuo
Season at•w(443) at.wC443) at•w(443) Range
(m·l) (%) (m·l) (%) (m·l) (%) (mg m·j
)
Amundsen Gulf 2007 0.011 (0.005) Il 0.021 (0.021) 21 0.068 (0.040) 68 10 0.1-0.7
(this study) Fall
Amundsen Gulf 2008 0.019 (0.015) 21 0.006 (0.003) 7 0.063 (0.031) 72 20 0.06-0.5 (this study) Spring &
summer
Canadian Arctic 2007 0.019 (0.008) 21 0.013 (0.04) 14 0.058 (0.015) 65 6 0.3-0.4
Archipelago (this study) Fall
Northern Baffin Bay 2007 0.031 (0.028) 28 0.013 (0.010) 12 0.067 (0.017) 60 10 0.1-3.0
(this study) Fall
Hudson Strait - 2005 0.055 (0.013) 65 0.014 ((0.015) 17-7 0.015 (0.005) 18 2 0.3-0.8
Hudson Bay* Fall 0.045 (0.020) 13 0.026 (0.003) 0.29 (0.21) 80 13 0.2-1.0
(this study)
Chukchi Sea, Western 2002
Arctic Ocean Spring: 0.017 22 0.011 14 0.049 64 90 0.05-10
[Mastuoka et al., 2011 ] Summer: 0.022 29 0.012 16 0.041 55 110
(ail depths) Fall: 0.016 18 0.006 9 0.066 73 179
Coastal waters around 1997-1998
Europe Spring, 0.005-1.0 36 0.001-1.0 22 0.007-0.7 41 330 0.002-30
[Bab in et al., 2003] summer & (surface waters) fall
41
2.3.2. Regional variability
Spatial variability was assessed using only the data taken at the surface during the faU
period in order to include the Hudson Bay. Figure 3 shows the mean specific phytoplankton
absorption coefficient spectra for each province with descriptive statistics at eight Sea WiFS
wavelengths. The two absorption maxima of ChI a around 440 and 675 nm are easy to
identify in the acjl * (À) spectra. Absorption maxima of ChI b at 465 nm and TChl c at 461 nm
[Hoepffner and Sathyendranath, 1991; Bricaud et al., 2004] combined with photoprotective
carotenoids (PPC) absorption maximum at 460 nm and the photosynthetic carotenoids
(PSC) absorption maximum at 490 nm [Bricaud et al., 2004] also contribute to the
observed spectral shapes. The aq. *(443) average was lower (p < 0.05) in the Canadian High
Arctic than in the Hudson Bay system. In the Hudson Bay system the observed values are
similar to the aq.*(443) coefficients measured in 1) the Black Sea [Dmitriev et al., 2009], 2)
the North Atlantic waters dominated by pico- and nanophytoplankton [Bricaud et al., 2004]
and 3) the Labrador Sea [Cota et al., 2003].
The spectra measured are relatively flattened in the Canadian High Arctic. Thus, the
blue-to-red ratio averages aq.(443):aq.(675) are also generaUy low (Figure 4a) [Bricaud et al., 1995; Babin et al., 2003], especially in the Amundsen Gulf (l.8, SD = 0.3) and northem Baffin Bay (1.5, SD = 0.3) (Figure 4b). Those ratios are similar to those observed in the
Atlantic sector of the Southem Ocean (1.6 - 2.2) [Bracher and Ti/zer, 2001]. The highest
averaged aq.(443):aq.(675) ratios have been observed in the Canadian Arctic Archipelago
(2.0, SD = 0.3) and Hudson Bay system (2.5, SD = 0.7) (Figure 5b), but that last province had a really high spatial variability (Figure 4b). Consequently, the aq.(443) and aq.(675) coefficients are weIl correlated together in the Canadian High Arctic (r2 = 0.93) but not in the Hudson Bay system (r2 = 0.17).
a) Hudson Bay' system (fa1l2005) 0.12 0.11 0.10 0.09 0.08 0.07 0.06 0.05 0.04 0.03 0.02 0.01 -112 -1-.13 T 1 -190 .... ...
,
.... 510 .!.-... T 560 1:, .... 6ï5.!.-Chlorophyll a-specificphytoplankton light absorption coefficient
in the SeaWiFS bands:
Means:
1---1
(1<1>*0.,)
(1<1>*(/.')
Interquartile range Sample median
Extent of the sample
Z~ Zso
Z :> Zso
O~ __ -. ____ ,-__ -. ____ ,-__ .-__ ~
b) NOlthem Baffin Bay (fa1l200ï) 0.12 0.11 0.10 0.09 0.08 0.07 ï 0.06 : 0.05 1 1
d) Almllldsen Gulf (fall 200ï)
0.12 0.11 0.10 0.09 0.08 007 0.06 T 1 0.05 1 0.04 ï 1 0.03 0.02 1 0.01 1. 1.. ". 0 400 450 500 550 600 ï
-
1 650 700c) Canadian Arctie Archipelago 0.12 0.11 0.10 0.09 0.08 om 0.06 0.05 0.03 -0.02 0.01 OL,----,---.---~----r---~--~
e) i\.JnUlHlsen Gulf (spring/summer 2008)
0.12 0.11 ï 0.10 1 1 ~ 1 0.09 1 1 1 0.08 1 1 0.ü7 1 1 0.06 0.05 0.04 ~ 0.03 1 0.02 0.01 T 0 400 450 500 550 600 650 700 Wa\'elength (nm)
Figure 3. Box plots of the total Chi a-specific light absorption by phytoplankton (~*(A)) of
each oceanographic province at eight Sea WiFS wavelengths. Descriptive statistics were calculated for aIl depths, except in the Hudson Bay system where only surface waters had been sampled_ Spectra averages, between 400 and 700 nm, are shown at the surface for Z
::s
Zso (i.e. 2: 50% of surface irradi an ce ) and deeper waters for Z > Zso (i_e. from 50% to 1 % of
43
The spectral flattening could be caused by the package effect, c10sely associated with
the light availability and the ceIl size [Bricaud and Stramski, 1990; Babin et al., 2003]. The
averaged Q*(675) values, decreasing as the package effect level increases, were lower in
the Amundsen Gulf (0.70) and northern Baffin Bay (0.73) than in the Canadian Arctic
Archipelago (0.82) and Hudson Bay system (0.77). More precisely, the total concentration
of pigments (i.e. the sum of aIl different pigment concentrations) per ceIl was higher (p < <
0.05) in the Canadian High Arctic (0.32 - 3.8 pg cell-1
) than in the Hudson Bay system
(0.21 - 1.44 pg cell-1). This indicates that the cells are potentially shade-adapted in the
Canadian High Arctic during fall producing more pigments per cell, creating the package
effect and reducing the '4*(443) coefficients. The proportions of accessory pigments are
also a little high in this region (Figure 6a). This could explains why the values of '4 *(443)
are directly proportional (r2 = 0.73) to Q*(675) in the Canadian High Arctic but are not (r2
= 0.11) in the Hudson Bay system.
For the Hudson Bay system, the best linear regression fit for a<j>*( 443) used not only
the index of the package effect Q*(675) but also the concentrations of accessory pigments
(AccP* = AccP/TChl a) as independent variables (r2 = 0.74). The smaIl cell size
experiencing a weal( package effect level, the high proportions of small cells
«
5 /lm) inthe Canadian Arctic Archipelago (82%) and in the Hudson Bay system (67%), compared to
the Amundsen Gulf (60%) and northern Baffin Bay (49%), could also explain the relatively high Q*(675) values observed in those regions (Figure 5c). The presence oflarger cells and
higher package effect in the Baffin Bay and the western Arctic Ocean is probably related to higher nutrient levels availability [Hill and Cota, 2005, Tremblay et al., 2006; Klein et al.,
2002; Lovejoy et al., 2002].
Assuming that the package effect is not totally overwhelming the pigment effect, the
pigment composition could also explain some differences between phytoplankton specific
absorption coefficients. The TChl a-specific concentrations of PSC* (PSC*=PSC/TChl a)
in the Amundsen Gulf (0.70), Canadian Arctic Archipelago (0.45) and northern Baffin Bay
(0.73) (Figure 6d) correspond to the highest values measured in the North Atlantic waters
picophytoplankton [Bricaud et al., 2004]. Those PSC* proportions are also higher than
what was measured in the Hudson Bay system (0.37). Inversely, the TChl a-specifie
concentrations of PPC* (PPC* = PPC/TChl a) were clearly smaller (p « 0.05) in the Amundsen Gulf (0.09), northern Baffin Bay (0.10) and Canadian Arctic Archipelago (0.10)
than in the Hudson Bay system (0.22) (Figure 5d). The PPC* values in the Hudson Bay
system were in the range of observations made in coastal waters of temperate regions
(Figure 6b) [Babin et al., 2003], while those of the Canadian High Arctic were similar to
values measured in arctic marine phytoplankton adapted to low incident light [Matsuoka et al., 2011]. Those results highlight the fact that the high ~*(443) observed in the Hudson
Bay system are related to higher proportions of PPC (absorbing at shorter wavelengths than
~
..-:s
M '<t ~ <)-ro a ) {}Canadlan Archipelago (fall) - 0 Hudson Say (fall)
'1
0 Northem Saffin Say (fall) / -/
II Amundsen Gulf (springlsummer) / / "l Amundsen gulf (fall) / - - - - Sricaud el al 1995 / / / /
..
-= / -= ~~q,,~
/~ 0 -= / / V -= / / V 0.1 0.01 / " "!t'v / /'t.
.f'
/ / / / 0.001 , "'1 "'1 ' '1 0.0001 0.001 0.01 0.1 c) 0.1 0.001 0.01 a~ (676) (m- 1) - -World Oceans [Bnca/ld .. / al. 200-1] - - Western Arctic Ocean - fall 2004[Ma/s/loko e/ 01.200-1 - - - Beaufort and Chukchi
Seas-summer 2000 [ Trollg et al. 200'1 ' - - - " y ./ / . / 0.1 1 10 Tehl a (mg m-3) 0.1
..-:s
CV) 0.01 ~ {} ro 0.001 45 b) 5""nTmw-."rrmr-rn~~"TIT= 4 0.01 0.1 1 10 100 Tehl a (mg m-3) d) 0.01 0.1 1 10 Tehl a (mg m-3)Figure 4. Variations of (a) the absorption coefficient of phytoplankton ~(443) as a
function of the absorption coefficient of phytoplankton ~(676) and (b) the ratio of ~(443)
to ~(676) as a function of the total ChI a concentrations for aU depths, shown in log scale.
Dashed lines of figures (a) and (b) represent the regression lines of Babin et al. [2003]. The
(c) ~(443) coefficient as a function of the total ChI a concentrations at the surface (i.e. ~
50% of surface irradiance) and (d) deeper waters (i.e. from 50% to 1 % of surface
irradiance) are shown. In (c) and (d), regression lines of Wang et al. [2005] for the Beaufort
and Chukchi seas, Matsuoka et al. [2007] for the western Arctic Ocean and Bricaud et al.
[2004] for the World Oceans are drawn for comparison. Note that the absorption coefficient
was measured at 440 nm for surface waters in Bricaud et al. [2004], and for aU depths in
Moreover, the main pigment contributions to PPC in the Canadian High Arctic were,
on average, the diadinoxanthin (DD/TChl a
=
DD*=
0.05, SD=
0.02) with no or very lowconcentrations of alloxanthin (Allo) and zeaxanthin (Zea). In the Hudson Bay system, the
averages of DD* (0.08, SD
=
0.02), Allo* (Allo/TChI a=
0.06, SD=
0.03) and Zea*(Zea/TChl a
=
0.05, SD=
0.05) were relatively higher. This suggests once again that theCanadian High Arctic's phytoplankton community could be acclimated to low light
conditions (i.e. epoxidization of DT into DD under low ligh irradiance) [Derners et al.,
1991; Kashino and Kudoh, 2003; Lavaud et al., 2004; Goss and Jackob, 2010]. The
xanthophylls cycle (i.e. response to sudden change in irradiance) could be more active in
the Hudson Bay system, containing more xanthophylls pigments [Kashino et al., 2002] and
a more adequate nutrients supply [Dubinsky and Stambler, 2009; Moreno et al., 2012].
A cluster analysis of TChl a-specific light absorption by phytoplankton, cell size and
Q*(675) values divides the Canadian High Arctic dataset in two major groups characterized
by: 1) a relatively high proportion of picophytoplankton, low package effect and high
<4 *(443) and 2) a relatively low proportion of picophytoplankton, high package effect and
low <4*(443) (Figure Sa, Sc). Using the most abundant and quantifiable pigments
determined by HPLC, we also divided the phytoplankton community into two groups. The
first group includes prasinophyceae and chlorophycea (ChI b + Prasino) and the second
group includes bacillariophyta, dinophyta, pryrnnesiophycea and chrysophycea (TChI c +
Fuco + Diadino) [Jeffrey et al., 1997; Vidussi et al., 2004]. These two groups basically
represent green (i.e. containing ChI b) and red algae (i.e. containing Chi c) and are
correlated with the salinity (Figure St).
The second cluster analysis showed that the group 1 is dominated by algae containing
a high proportion of ChI b* (ChI b/TChI a) + Prasino* (prasino/TChl a) while group 2 is
dominated by algae containing high proportion of Fuco* (Fuco/TChl a) + TChl c* (TChl
c/TChI a) (Figure 7). The first group includes stations in northeastem Amundsen Gulf (stns.
405, 1100, 1200, 1902 and 1908), Canadian Arctic Archipelago (stns. 301, 302, 308, 309
and 310) and northwestem Baffin Bay (stns. 101 and 134). The second group includes
47
1216) as well as those in the northeastern Baffin Bay (stns. 108, 111 and 115). The
observed spatial differences of optical properties in the Amundsen Gulf could be related to the general anticyclonic circulation pattern in the area with water entering the gulf along
Banks Island and exiting at the Cape Bathurst [Lanos, 2009]. The significantly highest
Fuco* average (0.50, SD = 0.1) was correlated with the presence of diatoms (microscopy counts) in northern Baffin Bay (r2
=
0.76). These results agree with previous works which showed that diatoms dominated the community along the Greenland coast while watersalong the Canadian coast mostly contained flagellates [Vidussi et al., 2004]. In summary,
our results show that there exists spatial variability of the phytoplankton optical properties
between the different oceanographie provinces and that the provinces cannot be considered
4 0.1 0.6 3 0.075 0.4 0.05 2 0.2 0.025 o o 120·W 100·W 80·W 120·W 100·W 80·W 120·W 100·W 80·W d) PPC:PSC e) ChJ
b
:TChlc f) Salinity (psu) 1.5 3 34 1.25 2.5 32 2 0.75 1.5 30 0.5 28 0.25 0.5 26 o o 120·W 100·W 80·W 120·W 100·W 80·W 120·W 100·W 80·WFigure 5. Spatial variations of the (a) total ChI a-specific phytoplankton light absorption coefficient '4*(443), (b) blue-to-red ratio
'4(443):alj>(675), (c) relative proportion of picophytoplankton, (d) ratio of photoprotective carotenoids (PPC) and photosynthetic
carotenoids (PSC), (e) ratio of ChI b and TChl c and (f) salinity in surface waters (i.e. ::: 50% of surface irradiance) of the Canadian Arctic

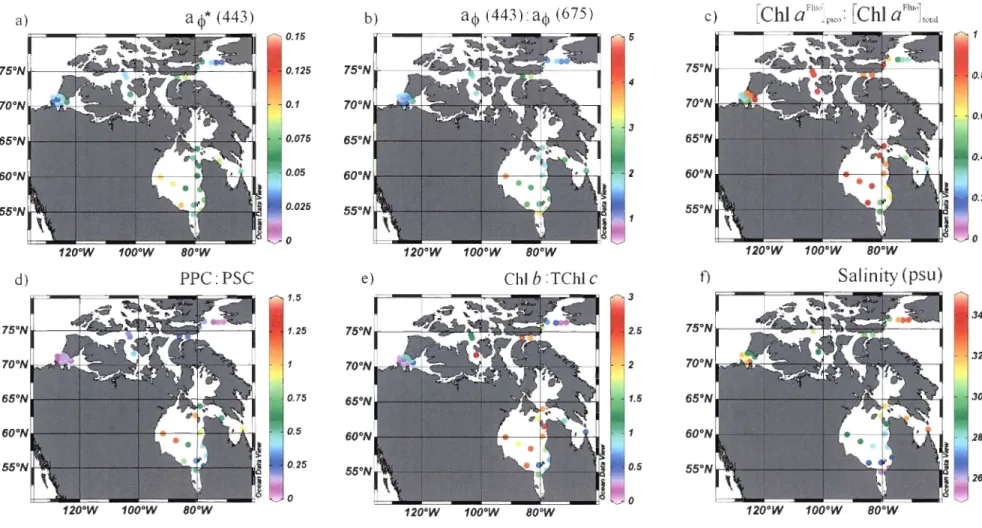
![Table 3. Constants for the power law regression acjl(443) = Acjl(443)[TChJ a]Bcjl(443) at 443 nm for surface (Z :S ZSO% ) and deeper waters (Z > ZSO% )](https://thumb-eu.123doks.com/thumbv2/123doknet/7509098.225866/53.915.110.784.289.990/table-constants-power-regression-acjl-surface-deeper-waters.webp)
