1
Effect of Quenching Rate on Precipitation Kinetics in AA2219 DC Cast Alloy
E.M. Elgallad*, Z. Zhang, X.-G. Chen
Department of Applied Science, University of Quebec at Chicoutimi, Saguenay (QC), Canada G7H 2B1
Abstract
Slow quenching of direct chill (DC) cast aluminum ingot plates used in large mold applications is often used to decrease quench-induced residual stresses, which can deteriorate the machining performance of these plates. Slow quenching may negatively affect the mechanical properties of the cast plates when using highly quench-sensitive aluminum alloys because of its negative effect on the precipitation hardening behavior of such alloys. The effect of the quenching rate on precipitation kinetics in AA2219 DC cast alloy was systematically studied under water and air quenching conditions using differential scanning calorimetry (DSC) technique. Transmission electron microscopy (TEM) was also used to characterize the precipitate microstructure. The results showed that the precipitation kinetics of the θ' phase in the air-quenched condition was mostly slower than that in the water-quenched one. Air quenching continuously increased the precipitation kinetics of the θ phase compared to water quenching. These results revealed the contributions of the inadequate precipitation of the strengthening
θ' phase and the increased precipitation of the equilibrium θ phase to the deterioration of the
mechanical properties of air-quenched AA2219 DC cast plates. The preexisting GP zones and quenched-in dislocations affected the kinetics of the θ' phase, whereas the preceding precipitation of the θ' phase affected the kinetics of the θ phase by controlling its precipitation mechanism.
Keywords: AA2219 alloy; quenching rate; precipitation kinetics; DSC analysis
*
Corresponding author Tel.: +1 418 545 5011 # 2558; Fax: +1 418 545 5012. E-mail address: eelgalla@uqac.ca (E.M. Elgallad)
2
1. Introduction
Direct chill (DC) cast ingot plates of aluminum alloys are used for manufacturing large molds, such as pressure injection molds in the plastics industry and prototype molds in the automotive industry [1,2]. The machining of such molds requires the use of cast plates with high dimensional stability and excellent machinability. These requirements necessitate minimizing the residual stresses that can be induced during the commercial production of DC cast ingot plates. Therefore, air quenching of DC cast ingot plates is usually considered to be the favorable quenching method for avoiding the severe residual stress inherently associated with water quenching and the subsequent deterioration of the machining behavior and dimensional stability of the cast plates. However, air quenching may cause significant deterioration in the mechanical properties of the plates, especially when using alloys with high quench sensitivity, such as 2xxx and 7xxx alloys [3,4]. This deterioration is attributed to the loss of supersaturation and the precipitation of coarse particles during slow cooling, which negatively affect the precipitation sequence during the subsequent aging treatment [3,5].
Studying the associated precipitation kinetics can make it possible to understand the characteristics of the precipitation process. The differential scanning calorimetry (DSC) technique was used to study the precipitation kinetics of aluminum alloys to develop a better understanding of the effects of certain metallurgical parameters on the precipitation characteristics and mechanical properties of these alloys [6-10]. The precipitation kinetics of GP zones and S'-Al2CuMg precipitates were compared under different solutionizing conditions to study the effects of solution temperature on the aging behavior and tensile properties of SiCp/Al–Cu–Mg composites [6]. Yassar et al. [7] used DSC analysis to investigate the effects of cold deformation on the kinetics of βʹʹ-Mg2Si precipitates in an AA6022 alloy and on the evolution of its precipitation reactions. Additional calorimetric studies
[8-3
10] were conducted to investigate the effects of the addition of alloying elements on the precipitation characteristics and mechanical properties of aluminum alloys.
In a previous study [11], the effects of slow quenching on the precipitation of both GP zones and θ'' precipitates in an AA2219 DC cast alloy were explained by qualitative analysis of DSC scans combined with transmission electron microscopy (TEM) observations. Compared to water quenching, slow air quenching almost entirely suppressed the precipitation of GP zones and consequently θ'' precipitates. This result would undoubtedly affect the subsequent precipitation of both the metastable θ' phase and the equilibrium θ phase, but these effects were not clear from the previous study. Therefore, the present work was undertaken to study the precipitation kinetics of the AA2219 DC cast alloy with respect to θ' and θ precipitates under water and air quenching conditions, aiming at understanding the effects of the quenching rate on the entire precipitation sequence of this alloy. The precipitation kinetics was systematically studied by investigating the evolution of the fundamental kinetic parameters which describe the progress of solid-state phase transformations, including the transformed mole fraction, the activation energy and the growth exponent.
2. Material and Methods
The material studied was supplied in the form of a 50-mm-thick transverse cross-sectional ingot slice cut from a large industrial AA2219 DC cast ingot. The ingot had a cross-section of 1400 x 300 mm2 and a length of 4.5 m. In compliance with the traditional processing of mold plates [11-13], the ingot was not subjected to any preliminary deformation processes (such as hot or cold rolling). The chemical composition of the alloy is listed in Table 1. Test samples were machined from the ingot slice for DSC analysis and microstructural observations. Solution treatment was conducted in a forced-air
4
electric furnace at 540 ºC for 8 h, followed by quenching in room-temperature water or still air. The average cooling rates were 120 ºC/s and 0.2 ºC/s for water and air quenching, respectively.
A non-isothermal DSC analysis was performed with a Perkin-Elmer DSC8000 computerized differential scanning calorimeter. The mass of the DSC sample was approximately 20 mg, and a protective atmosphere of pure argon was used. The scans were performed between room temperature and 600 ºC at various heating rates of 10, 20, 30, 40 and 50 ºC/min. Three samples for each heat treatment condition were used for each heating rate and the results obtained were found to be almost identical. The corrected DSC curve of each sample was obtained by subtracting two DSC scans. The first scan was conducted with the sample, whereas the second one was conducted without the sample under the same testing conditions of the sample scan. The purpose of this procedure is to obtain baseline-corrected theromgram data. The DSC curve of each quenching-heating rate condition was subsequently obtained by averaging the three corrected curves of the three respective samples.
The peak parameters, including the onset, peak and ending temperatures as well as the total peak area, were determined using PyrisTM Software platform developed by PerkinElmer instruments for thermal analysis. The program firstly identifies the left- and right-hand limits which completely encompass the peak transition. After setting these limits, the program finds the appropriate baseline that can close the peak area. Two types of baselines can be used: standard and sigmoidal baselines. The standard is a straight, limit to limit base line. The sigmoidal baseline is used when the level of the DSC curve before the peak is different than that after the peak. The onset/ending temperature is calculated by finding the intersection of the baseline and the extrapolated tangent at the inflection point of the leading/trailing edge of the peak. Given the baseline and the onset and ending temperatures, the program can calculate the total peak area.
The samples used for the TEM observations were 3-mm-diameter discs punched out from the cut slices. The discs were mechanically polished to a thickness of approximately 50 µm and then
5
electropolished to perforation with a twinjet electropolisher in a solution of 1/3 nitric acid and 2/3 methanol at -40 ºC and a potential difference of 12 V. A transmission electron microscope (JEOL JEM-2100), operated at 200 kV, was used to observe the precipitates in the heat-treated samples using two-beam conditions.
3. Results and Discussion 3.1. DSC thermograms
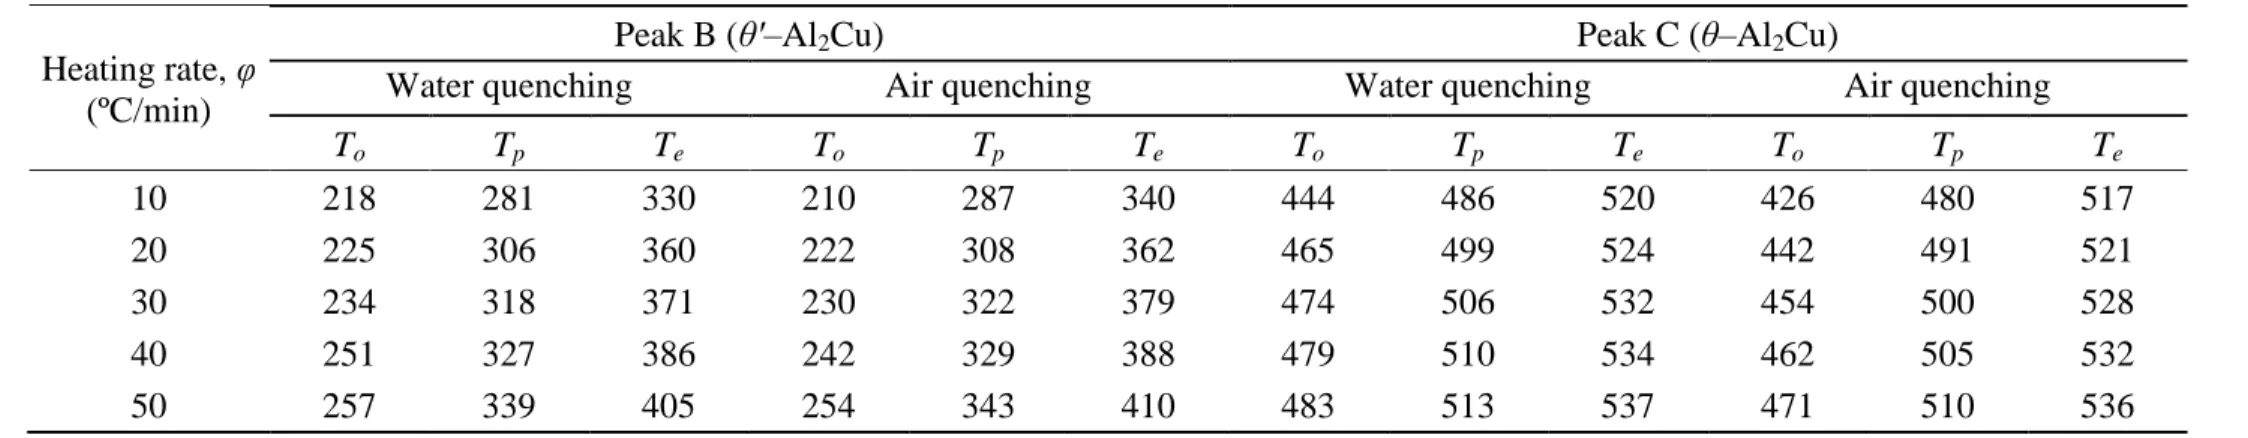
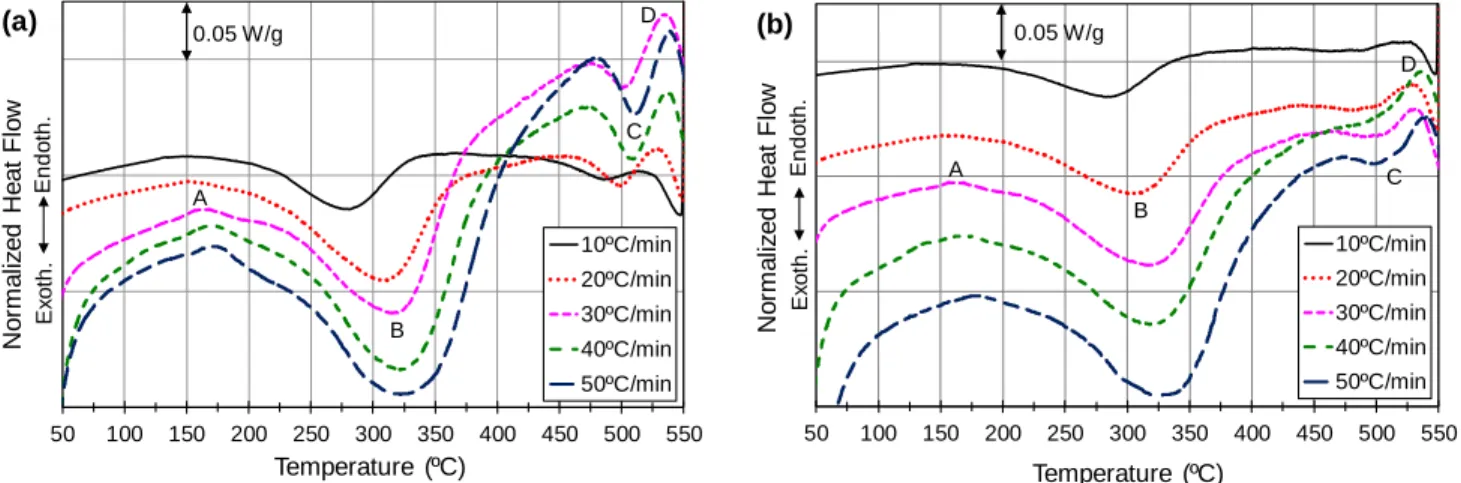
Non-isothermal DSC analysis of as-quenched samples typically simulates the aging process and can therefore be used to investigate the precipitation kinetics of strengthening phases. Temperature and time, which are the main parameters that affect the precipitation process, are studied in DSC analysis by adjusting the scan temperature and the heating rate, respectively. Figs. 1a and b show the average DSC heating curves of the as-quenched AA2219 DC cast alloy obtained at heating rates of 10, 20, 30, 40 and 50 ºC/min under water and air quenching conditions. The curves exhibit two endothermic peaks, A and D, and two exothermic peaks, B and C. The endothermic peak A is related to the dissolution of GP zones and exothermic peaks B and C are attributed to the precipitation of θ' and θ phases, respectively, whereas the endothermic peak D represents the melting of these phases [11,14,15]. The average values of the onset, peak and ending temperatures of the peaks corresponding to the precipitation of the θ' and θ phases investigated in this study, peaks B and C, are listed in Table 2. The peak temperature of the precipitation reaction corresponds to the point of maximum enthalpy associated with the highest rate of phase transformation. Table 2 shows that, for a given heating rate, air quenching increased the peak temperature of peak B but decreased that of peak C compared to water quenching. This result implies that air quenching slowed down the kinetics of the θ' phase but accelerated the kinetics of the θ phase compared to water quenching. However, this conclusion may be
6
premature because the kinetics is being evaluated based only on the phase transformation that occurred at the peak point. To reach a more complete assessment, the precipitation kinetics of the θ' and θ phases were investigated over their entire transformations, as discussed in the following sections.
3.2. Evolution of the non-isothermal transformation
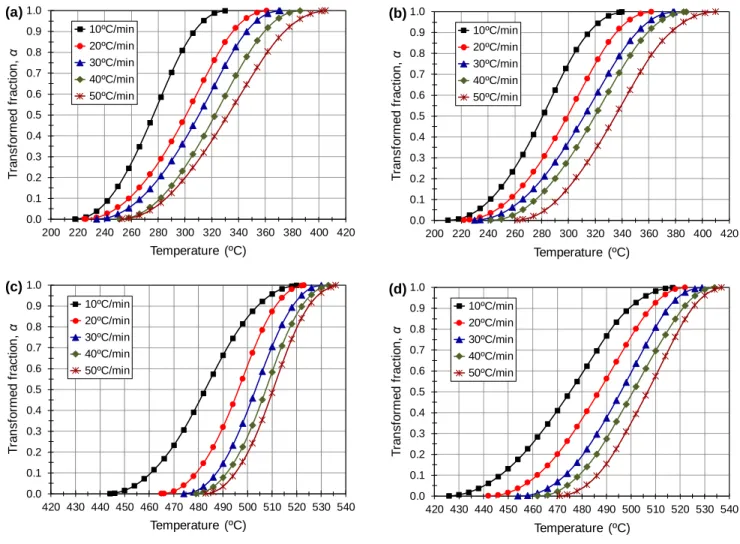
Based on the DSC data of the exothermic peaks B and C, the transformed fractions of θ' and θ phases as a function of scan temperature for different heating rates are plotted in Fig. 2. The transformed fraction, α, measures the extent of a specific precipitation reaction at a given scan temperature and is given by [16]
𝛼 = 𝐴𝑝
𝐴𝑡 (1)
where Ap is the partial area of the relevant peak between the onset temperature and the temperature at which the transformed fraction is being calculated and At is the total area of the peak between the onset and ending temperatures. The α-T curves obtained are sigmoidal in shape (S-shaped), showing that for a fixed heating rate, the transformed fraction increases as the temperature increases. However, for a given temperature, the transformed fraction decreases as the heating rate increases. These features are explained by the effects of temperature and time on the diffusion of solute atoms. Increasing the temperature increases the diffusion and consequently the transformed fraction. On the contrary, increasing the heating rate gives insufficient time for solute atoms to diffuse, thereby decreasing the transformed fraction.
3.3. Activation energy
Precipitation kinetics under non-isothermal conditions could be analyzed based on a generalized rate equation of the form [16,17]:
7 𝑑𝛼
𝑑𝑡 = 𝑘. 𝑓(𝛼) (2)
where 𝑑𝛼
𝑑𝑡 is the instantaneous rate of change of the transformed fraction under non-isothermal
conditions, α, with time, t; 𝑓(𝛼) is the function of the transformed fraction and k is the reaction rate constant, which is given by the Arrhenius equation as follows:
𝑘 = 𝑘0𝑒−𝐸 𝑅𝑇⁄ (3)
In the above equation, E is the activation energy, which could be defined as the energy barrier opposing the reaction; R is the universal gas constant (8.314 J/mol.K); T is the Kelvin temperature; and 𝑘0 is the frequency factor, which measures the probability of precipitation of a molecule with activation energy
E.
Several methods were developed on the basis of Eq. (2) for determining the activation energy under non-isothermal conditions [18-20]. Given its accuracy and simplicity [10,21], the Kissinger method [20] was traditionally used to calculate the activation energy at the highest rate of phase transformation [6,9,21]. The general form of the Kissinger equation is:
𝑑 (ln𝑇𝜙 𝑝2) 𝑑 (𝑇1 𝑝) = −𝐸 𝑅 (4)
where 𝜙 is the heating rate (𝑑𝑇 𝑑𝑡⁄ ) and 𝑇𝑝 is the temperature of the maximum transformation rate,
i.e., peak temperature; the other parameters, E and R, are as defined previously for Eq. (3). The
classical Kissinger method was later modified on the basis of Kissinger-Akahira-Sunose (KAS) isoconversional analysis [22] to allow the calculation of the activation energy at any degree of phase transformation. This analysis was firstly validated by Mittemeijer et al. [23], provided that the temperature of the maximum transformation rate is replaced with the temperature corresponding to the given transformed fraction. Owing to its reliability and applicability in describing the evolution of the
8
activation energy during the course of phase transformation [10,24-27], the KAS method was adopted in this study. The KAS equation is expressed as follows:
ln (𝜙𝑖
𝑇𝛼,𝑖2 ) = − 𝐸
𝑅𝑇𝛼,𝑖+ 𝐶 (5)
where 𝑇𝛼,𝑖 is the temperature at which the fraction α is precipitated at the ith heating rate 𝜙𝑖 and C is a constant independent of time or temperature. For a given transformed fraction α, the respective values of 𝑇𝛼,𝑖 can be identified from the α-T curves shown in Fig. 2 and the plot of ln(𝜙𝑖⁄𝑇𝛼,𝑖2 ) vs 1 𝑇⁄ 𝛼,𝑖 can then be obtained. Based on Eq. (5), this plot yields a straight line of slope −𝐸 𝑅⁄ , from which the activation energy, E, can be determined for the given α. By following this procedure for several values of the transformed fractions, the variation of the activation energy with the transformed fraction can be plotted.
3.3.1. θ' phase
Fig. 3 shows the variation of the activation energy of θ' formation with the transformed fraction under water- and air-quenching conditions. As Fig. 3 shows, the activation energy of the θ' phase ranged from 68.40 to 76.66 kJ/mol in the air-quenched condition and from 66.15 to 77.05 kJ/mol in the water-quenched condition. Different values were reported for the activation energy of θ' formation in Al-Cu alloys, depending on the alloying additives and the heat treatment practice [10,28]. Chen et al. [10] found that the activation energy of θ' formation varied between 109 and 117 kJ/mol for Al-Cu-Mn alloy and decreased to between 65 and 90 kJ/mol for Al-Cu-Mn-Sm alloy. For a binary Al-4%Cu alloy, Starink et al. [28] reported that the average values for the activation energy were 106 and 72 kJ/mol in water-quenched and slow-cooled conditions, respectively. As seen in Fig. 3, at the beginning of precipitation, specifically at α = 0.1, the activation energy of the θ' phase in the air-quenched condition
9
was noticeably lower than that in the water-quenched condition (60.53 kJ/mol vs. 67.59 kJ/mol, respectively). However, as precipitation progressed, the activation energy of the θ' phase increased in the air-quenched condition but decreased in the water-quenched one. Accordingly, the air-quenched samples displayed higher activation energy values compared to the water-quenched samples, when the transformed fraction α exceeded 0.31.
As reported in the previous study [11], water quenching promoted the precipitation of GP zones which subsequently developed into θ'' precipitates before the precipitation of the θ' phase. As a result, the precipitation of the θ' phase would be temporarily delayed in the water-quenched condition, while in the air-quenched condition, the precipitation of GP zones and θ'' precipitates was hindered, allowing
the θ' phase to precipitate freely from the available supersaturated solid solution. This explains why air
quenching resulted in lower activation energy values for θ' formation at the beginning of the precipitation compared to water quenching. The decrease in the activation energy of the θ' phase as precipitation progressed in the water-quenched condition and its contrasting increase in the air-quenched condition can be explained by the effect of dislocations on the precipitation of the θ' phase. The θ' phase prefers to nucleate heterogeneously on dislocations [29,30]. Because the dislocation density could be reduced upon decreasing the quenching rate [31,32], it is likely that the water-quenched samples contained a higher density of dislocations than the air-water-quenched samples, and consequently, the kinetics of the θ' phase was accelerated for the former but retarded for the latter.
Fig. 4 shows the TEM bright-field image of an AA2219 alloy sample water-quenched and aged at 190 ºC for 8 h along with the corresponding selected area diffraction pattern (SADP) obtained near the [001]α zone axis. The TEM image (Fig. 4a) shows the coexistence of θ'' and θ' precipitates on the {100}α planes. The θ'' precipitates that evolved from GP zones were dispersed within dislocation-free areas in the matrix. The θ' precipitates (some arrowed) were evidently precipitated heterogeneously on dislocations, which confirms the significant effect of dislocations on the precipitation kinetics of the θ'
10
phase. The corresponding SADP (Fig. 4b) confirms the presence of these precipitates, showing streaks through the {200}α positions with pronounced intensity maxima at {100}α, which are the main features of the θ'' structure, and faint θ' spots at the {110}α positions.
3.3.2. θ phase
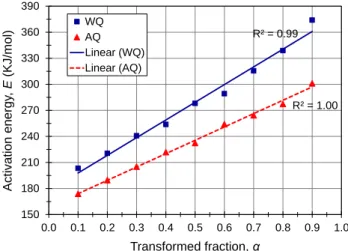
Fig. 5 shows the relationship of the activation energy of θ formation to the transformed fraction under water- and air-quenching conditions. The activation energy of the θ phase increased linearly as the transformed fraction increased in both water- and air-quenched conditions, ranging from 200 to 360 kJ/mol in the water-quenched condition and from 174 to 300 kJ/mol in the air-quenched condition. Wierszyłłowski et al. [33] reported that the activation energy of θ formation at the highest rate of precipitation in an Al-4.7% Cu alloy was approximately 304 kJ/mol. Evidently, air quenching enhanced the kinetics of the θ phase, decreasing its activation energy over the entire range of the transformed fractions by 13-17% compared to water quenching. This can be explained in terms of the precipitation mechanisms of the θ phase and how the preceding precipitation of the θ' phase in both the water- and air-quenched conditions could affect such mechanisms.
It was reported that the equilibrium θ phase can be nucleated directly from the solid solution independently of the θ' phase and can also be formed through the transformation of θ' [30,34,35]. In the air-quenched condition, the inadequate precipitation of the θ' phase resulted in the presence of some non-decomposed solid solution that could be transformed directly into the equilibrium θ phase. In addition, the well-grown θ' precipitates, which formed during the slow air quenching [11] and grew during the subsequent aging or DSC run, could also be transformed into the θ phase. However, in the water-quenched condition, a relatively large amount of solid solution was consumed in the formation of
11
Therefore, air quenching decreased the activation energy of the equilibrium θ phase compared to water quenching.
Figs. 6a-c show TEM bright-field images of an AA2219 alloy sample air-quenched and aged at 190 ºC for 8 h. The first image (Fig. 6a) displays the typical coexistence of both precipitation mechanisms of the equilibrium θ phase, namely, direct precipitation in the α-Al matrix and nucleation at the interfaces of large θ' precipitates with the α-Al matrix. The other images (Figs. 6b-c) also show the direct precipitation of the θ phase away from θ' precipitates but at grain boundaries. Such a grain-boundary precipitation was most commonly observed for the equilibrium θ-Al2Cu phase [36]. The corresponding SADP recorded near the [001]α zone axis (Fig. 6d) shows characteristic reflections from
θ precipitates at the {110}α positions.
In summary, these results demonstrate that air quenching can decrease the precipitation of the strengthening metastable θ' phase but can promote the precipitation of the coarse equilibrium θ phase. These effects undoubtedly contribute to the deterioration of the mechanical properties of the air-quenched AA2219 DC cast alloy, which was reported to occur also due to the formation of quench-induced coarse precipitates and the lack of the effective θ'' strengthening precipitates [11].
3.4. Growth exponent
The growth exponent, n (also referred to as Avrami exponent), is used in the analysis of the kinetics of solid state phase transformations to describe the transformation mechanism and growth morphology [37,38]. It can be calculated for non-isothermal transformations using the following equation [39,40]:
𝑛 =𝑑(ln(−ln(1 − 𝛼𝑇)))
12
where 𝛼𝑇 is the fraction precipitated at a given temperature T for the heating rate 𝜑. For any fixed temperature T, the values of 𝛼𝑇 at different heating rates can be determined from the α-T curves shown in Fig. 2 and then used to calculate the plot of ln(−ln(1 − 𝛼𝑇)) vs ln 𝜑. According to Eq. (6), the resulting plot yields a straight line with slope n, which is the growth exponent for temperature T. Repeating this procedure for several temperatures makes it possible to represent the variation of the growth exponent with temperature.
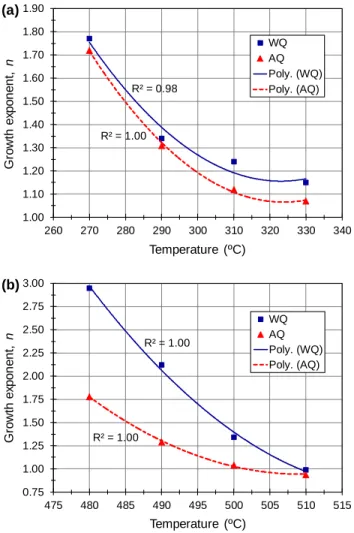
Fig. 7 shows the evolution of the growth exponent as a function of temperature for the θ' and θ phases under water- and air-quenching conditions. The growth exponent displayed an obvious dependency on temperature, ranging from 1.07 to 1.77 for the θ' phase and from 0.94 to 2.95 for the θ phase. These values reveal that the transformation of both phases took place in the water- and air-quenched conditions by diffusion-controlled growth with different stages [41]. For the θ' phase (Fig. 7a), the n-values in the water-quenched condition were 1.77, 1.34, 1.24 and 1.15, corresponding to growth evolution from the growth of particles with small dimensions with decreasing nucleation rate to the growth of particles with appreciable initial volume. These values are very close to those attained at the same temperatures in the air-quenched condition (1.72, 1.31, 1.12 and 1.07), which implies that the growth of the θ' phase was not affected by the quenching process.
For the θ phase (Fig. 7b), the n-values in the water-quenched condition were 2.95, 2.12, 1.34 and 0.99, corresponding to the growth of particles with small dimensions with increasing nucleation rate, growth of particles with small dimensions with decreasing nucleation rate, growth of particles with appreciable initial volume and growth and thickening of large particles, respectively. In the air-quenched condition, the n-values at the same temperatures are remarkably lower, 1.78, 1.29, 1.04 and 0.94. The first two values correspond to the growth of particles with small dimensions with decreasing nucleation rate and growth of particles of appreciable initial volume, respectively, whereas the other two values are both close to 1, indicating the growth and thickening of large particles. It seems that the
13
θ phase passed through the same growth stages in both water- and air-quenched conditions but did so
more rapidly in the air-quenched condition, reflecting its higher growth kinetics in this condition, particularly during the first growth stages.
4. Conclusions
The effect of quenching rate on precipitation kinetics in AA2219 DC cast alloy was studied under water- and air-quenching conditions using the DSC technique. Based on the results, the following conclusions can be drawn:
1- When compared with water quenching, air quenching resulted in lower values for the activation energy of θ' formation in the early stages of the transformation but higher values when the transformed fraction increased beyond ~ 0.3.
2- The variation in the precipitation kinetics of the θ' phase between water- and air-quenching conditions can be attributed to the role of the preexisting GP zones and quenched-in dislocations in the precipitation of θ'.
3- Air quenching decreased the activation energy of θ formation over the full range of the transformed fractions by 13-17% compared to water quenching.
4- The preceding precipitation of the θ' phase could affect the kinetics of the θ phase by controlling its precipitation mechanism.
5- The precipitation kinetics characteristics of the θ' and θ phases revealed that air quenching can deteriorate the mechanical properties of the AA2219 DC cast alloy not only due to the formation of quench-induced coarse precipitates and the lack of θ'' precipitates but also due to the inadequate precipitation of the θ' phase and the increased precipitation of the θ phase.
14
Acknowledgments
The authors would like to acknowledge the financial support from PCP Canada and the Natural Sciences and Engineering Research Council of Canada (NSERC). The authors would also like to thank PCP Canada for providing the DC cast ingot materials and for technical support.
References
[1] GLEICH Aluminium Datasheets, http://gleich.de. [2] PCP Canada Datasheets, http://www.pcp-canada.com.
[3] M. Tiryakioğlu, R.T. Shuey, Quench sensitivity of 2219-T87 aluminum alloy plate, Mater. Sci. Eng. A 527 (2010) 5033-5037.
[4] Y.-L. Deng, L. Wan, Y.-Y. Zhang, X.-M. Zhang, Influence of Mg content on quench sensitivity of Al–Zn–Mg–Cu aluminum alloys, J. Alloys Compd. 509 (2011) 4636–4642.
[5] M.J. Starink, B. Milkereit, Y. Zhang, P.A. Rometsch, Predicting the quench sensitivity of Al–Zn– Mg–Cu alloys: A model for linear cooling and strengthening, Mater. Des. 88 (2015) 958–971. [6] P. Jin, B.L. Xiao, Q.Z. Wang, Z.Y. Ma, Y. Liu, S. Li, Effect of solution temperature on aging
behavior and properties of SiCp/Al–Cu–Mg composites, Mater. Sci. Eng. A 528 (2011) 1504– 1511.
[7] R.S. Yassar, D.P. Field, H. Weiland, The effect of cold deformation on the kinetics of the βʹʹ precipitates in an Al-Mg-Si alloy, Metall. Mater. Trans. A 36 (2005) 2059–2065.
[8] D. Yao, Z. Bai, F. Qiu, Y. Li, Q. Jiang, Effects of La on the age hardening behavior and precipitation kinetics in the cast Al–Cu alloy, J. Alloys Compd. 540 (2012) 154–158.
[9] A. Gaber, M.A. Gaffar, M.S. Mostafa, E.F. Abo Zeid, Precipitation kinetics of Al-1.12 Mg2Si-0.35 Si and Al-1.07 Mg2Si-0.33 Cu alloys, J. Alloys Compd. 429 (2007) 167–175.
15
[10] Z.-W. Chen, M.-J. Tang, K. Zhao, Effect of rare earth samarium addition on the kinetics of precipitation in Al-Cu-Mn casting alloy, Int. J. Miner. Metall. Mater. 21 (2014) 155–161.
[11] E.M. Elgallad, Z. Zhang, X.-G. Chen, Effect of two-step aging on the mechanical properties of AA2219 DC cast alloy, Mater. Sci. Eng. A 625 (2015) 213–220.
[12] E.M. Elgallad, P. Shen, Z. Zhang, X.-G. Chen, Effects of heat treatment on the microstructure and mechanical properties of AA2618 DC cast alloy, Mater. Des. 61 (2014) 133–140.
[13] A. Hekmat-Ardakan, E.M. Elgallad, F. Ajersch, X.-G. Chen, Microstructural evolution and mechanical properties of as-cast and T6-treated AA2195 DC cast alloy, Mater. Sci. Eng. A 558 (2012) 76–81.
[14] J. M. Papazian, A Calorimetric study of precipitation in aluminum alloy 2219, Metall. Trans. A 12 (1981) 269-280.
[15] H. Wang, Y. Yi, S. Huang, Influence of pre-deformation and subsequent ageing on the hardening behavior and microstructure of 2219 aluminum alloy forgings, J. Alloys Compd. 685 (2016) 941-948.
[16] K.S. Ghosh, N. Gao, Determination of kinetic parameters from calorimetric study of solid state reactions in 7150 Al-Zn-Mg alloy, Trans. Nonferrous Met. Soc. China 21 (2011) 1199–1209. [17] J. Farjas, P. Roura, Isoconversional analysis of solid-state transformations: A critical review. Part
III. Isothermal and non-isothermal predictions, J. Therm. Anal. Calorim. 109 (2012) 183-191. [18] P.G. Boswell, On the calculation of activation energies using a modified kissinger method, J.
Therm. Anal. 18 (1980) 353–358.
[19] T. Ozawa, Kinetics of non-isothermal crystallization, Polymer 12 (1971) 150-158.
[20] H.E. Kissinger, Reaction kinetics in differential thermal analysis, Anal. Chem. 29 (1957) 1702-1706.
16
[21] N. Afify, A. Gaber, A.M. Abousehly, Y.M. Abou Deif, Precipitation kinetics in supersaturated Al-2.0 at% Cu-1.0 at% Mg alloy, Mater. Trans. JIM 51 (2010) 317–320.
[22] S. Vyazovkin, Isoconversional Kinetics of Thermally Stimulated Processes, Springer, Heidelberg, 2015.
[23] E.J. Mittemeijer, Review: Analysis of the kinetics of phase transformations, J. Mater. Sci. 27 (1992) 3977–3987.
[24] V. Leroya, D. Cancellieri, E. Leonib, J.-L. Rossib, Kinetic study of forest fuels by TGA: Model-free kinetic approach for the prediction of phenomena, Thermochim. Acta 497 (2010) 1-6.
[25] M.I. Daoudi, A. Triki, A. Redjaimia, DSC study of the kinetic parameters of the metastable phases formation during non-isothermal annealing of an Al–Si–Mg alloy, J. Therm. Anal. Calorim. 104 (2011) 627-633.
[26] E. Kantarelis, W. Yang, W. Blasiak, C. Forsgren, A. Zabaniotou, Thermochemical treatment of E-waste from small household appliances using highly pre-heated nitrogen-thermogravimetric investigation and pyrolysis kinetics, Appl. Energy 88 (2011) 922–929.
[27] H. Nemour, M.I. Daoudi, A. Triki, The effect of heavy cold plastic deformation on the non-isothermal kinetics and the precipitation sequence of metastable phases in an Al–Mg–Si alloy, J. Therm. Anal. Calorim. 123 (2016) 19-26.
[28] M.J. Starink, P. van Mourik, Cooling and heating rate dependence of precipitation in an Al-Cu alloy, Mater. Sci. Eng. A 156 (1992) 183–194.
[29] D. Bakavos, P.B. Prangnell, B. Bes, F. Eberl, The effect of silver on microstructural evolution in two 2xxx series Al-alloys with a high Cu:Mg ratio during ageing to a T8 temper, Mater. Sci. Eng. A 491 (2008) 214-223.
[30] H. Sehitoglu, T. Foglesong, H.J. Maier, Precipitate effects on the mechanical behavior of aluminum copper alloys: Part I. Experiments, Metall. Mater. Trans. A 36 (2005) 749-761.
17
[31] I.N.A. Oguocha, M. Radjabi, S. Yannacopoulos, The effect of cooling rate on the quench sensitivity of 2618 Al/Al2O3 MMC, J. Mater. Sci. 35 (2000) 5629-5634.
[32] N. Chobaut, Measurements and modelling of residual stresses during quenching of thick heat treatable aluminium components in relation to their precipitation state, PhD Thesis, École Polytechnique Fédérale de Lausanne, Switzerland, No 6559 (2015).
[33] I. Wierszyłłowski, S. Wieczorek, A. Stankowiak, J. Samolczyk, Kinetics of transformation during supersaturation and ageing of the Al-4.7 %Cu alloy, Obróbka Plastyczna Metali 16 (2005) 31-37. [34] A.M. Russell, K.L. Lee, Structure-Property Relations in Nonferrous Metals, Wiley, Hoboken, NJ,
2005.
[35] M. Murayama, Z. Horita, K. Hono, Microstructure of two-phase Al–1.7 at% Cu alloy deformed by equal-channel angular pressing, Acta Mater. 49 (2001) 21-29.
[36] R. Lumley, Self healing in aluminium alloys, in: S. van der Zwaag (Ed.), Self Healing Materials, Springer, Dordrecht, 2007, pp. 219-254.
[37] I. Sinha, R.K. Mandal, Avrami exponent under transient and heterogeneous nucleation transformation conditions, J. Non-Cryst. Solids 357 (2011) 919-925.
[38] J. Wang, H.C. Kou, X.F. Gu, J.S. Li, L.Q. Xing, R. Hu, L. Zhou, On discussion of the applicability of local Avrami exponent: Errors and solutions, Mater. Lett. 63 (2009) 1153-1155. [39] J. Farjas, P. Roura, Modification of the Kolmogorov–Johnson–Mehl–Avrami rate equation for
non-isothermal experiments and its analytical solution, Acta Mater. 54 (2006) 5573-5579.
[40] F. Liu, F. Sommer, E.J. Mittemeijer, Analysis of the kinetics of phase transformations; roles of nucleation index and temperature dependent site saturation, and recipes for the extraction of kinetic parameters, J. Mater. Sci. 42 (2007) 573-587.
[41] J.W. Christian, The theory of transformation in metals and alloys, Part I, 2002, Pergamon, Oxford.
18
Fig. 1. DSC heating curves of the as-quenched AA2219 DC cast alloy at different heating rates in the
(a) water- and (b) air-quenched conditions.
50 100 150 200 250 300 350 400 450 500 550 No rm a liz e d He a t F lo w Temperature ( C) 10ºC/min 20ºC/min 30ºC/min 40ºC/min 50ºC/min º A B C D 0.05 W/g E n d o th . E x o th . (a) 50 100 150 200 250 300 350 400 450 500 550 No rm a liz e d He a t F lo w Temperature ( C) 10ºC/min 20ºC/min 30ºC/min 40ºC/min 50ºC/min º A B C D 0.05 W/g E n d o th . E x o th . (b)
19
Fig. 2. Variation of the transformed fraction with temperature at different heating rates for (a, b) θ'
phase in the water- and quenched conditions, respectively and (c, d) θ phase in the water- and air-quenched conditions, respectively.
0.0 0.1 0.2 0.3 0.4 0.5 0.6 0.7 0.8 0.9 1.0 200 220 240 260 280 300 320 340 360 380 400 420 T ra n sf o rm e d f ra ct io n , α Temperature (ºC) 10ºC/min 20ºC/min 30ºC/min 40ºC/min 50ºC/min (a) 0.0 0.1 0.2 0.3 0.4 0.5 0.6 0.7 0.8 0.9 1.0 200 220 240 260 280 300 320 340 360 380 400 420 T ra n sf o rm e d f ra ct io n , α Temperature (ºC) 10ºC/min 20ºC/min 30ºC/min 40ºC/min 50ºC/min (b) 0.0 0.1 0.2 0.3 0.4 0.5 0.6 0.7 0.8 0.9 1.0 420 430 440 450 460 470 480 490 500 510 520 530 540 T ra n sf o rm e d f ra ct io n , α Temperature (ºC) 10ºC/min 20ºC/min 30ºC/min 40ºC/min 50ºC/min (c) 0.0 0.1 0.2 0.3 0.4 0.5 0.6 0.7 0.8 0.9 1.0 420 430 440 450 460 470 480 490 500 510 520 530 540 T ra n sf o rm e d f ra ct io n , α Temperature (ºC) 10ºC/min 20ºC/min 30ºC/min 40ºC/min 50ºC/min (d)
20
Fig. 3. Evolution of the activation energy of θ' formation as a function of the transformed fraction in
the water- and air-quenched conditions. The activation energy values were calculated from the slopes of the straight lines fitting the plots of ln(𝜙𝑖⁄𝑇𝛼,𝑖2 ) vs 1 𝑇⁄ 𝛼,𝑖 according to the KAS equation (Eq. 5). The R-squared values of these lines ranged from 0.92 to 0.99.
Fig. 4. (a) TEM bright-field image and (b) corresponding SADP obtained near the [001]α zone axis
from an AA2219 sample water-quenched and aged at 190 ºC for 8 h. The arrows in (a) refer to θ' precipitates nucleated on dislocations.
65 67 69 71 73 75 77 79 0.0 0.1 0.2 0.3 0.4 0.5 0.6 0.7 0.8 0.9 1.0 Activa tion ene rgy , E (KJ/m ol) Transformed fraction, α WQ AQ Poly. (WQ) Poly. (AQ) R2 = 0.99 R2 = 0.97
21
Fig. 5. Evolution of the activation energy of θ formation as a function of the transformed fraction in the
water- and air-quenched conditions. The activation energy values were calculated from the slopes of the straight lines fitting the plots of ln(𝜙𝑖⁄𝑇𝛼,𝑖2 ) vs 1 𝑇⁄ 𝛼,𝑖 according to the KAS equation (Eq. 5). The R-squared values of these lines ranged from 0.93 to 0.98.
R² = 0.99 R² = 1.00 150 180 210 240 270 300 330 360 390 0.0 0.1 0.2 0.3 0.4 0.5 0.6 0.7 0.8 0.9 1.0 Activa tion ene rgy , E (KJ/m ol) Transformed fraction, α WQ AQ Linear (WQ) Linear (AQ)
22
Fig. 6. (a) TEM image showing the precipitation of θ phase within the α-Al and at θ'/α-Al interfaces,
(b,c) TEM images showing the precipitation of θ phase at grain boundaries (GB) and (d) corresponding SADP obtained near the [001]α zone axis from an AA2219 sample air-quenched and aged at 190 ºC for 8 h.
23
Fig. 7. Growth exponent of (a) θ' and (b) θ phases as a function of temperature in the water- and
air-quenched conditions. The growth exponent values are the slopes of the straight lines fitting the plots of ln(−ln(1 − 𝛼𝑇)) vs ln 𝜑 according to Eq. 6. The R-squared values of these lines varied between 0.93 and 0.99 for θ' phase and between 0.95 and 0.98 for θ phase.
R² = 0.98 R² = 1.00 1.00 1.10 1.20 1.30 1.40 1.50 1.60 1.70 1.80 1.90 260 270 280 290 300 310 320 330 340 G ro wth e xp o n e n t, n Temperature (ºC) WQ AQ Poly. (WQ) Poly. (AQ) (a) R² = 1.00 R² = 1.00 0.75 1.00 1.25 1.50 1.75 2.00 2.25 2.50 2.75 3.00 475 480 485 490 495 500 505 510 515 G ro wth e xp o n e n t, n Temperature (ºC) WQ AQ Poly. (WQ) Poly. (AQ) (b)
24
Table 1 Chemical composition (wt%) of the AA2219 DC cast alloy.
Cu Fe Mn Si Ti Zr V Zn Al
6.02 0.11 0.27 0.03 0.043 0.10 0.11 0.042 Bal.
Table 2 Average values of the onset, peak and ending temperatures of peaks B and C at different heating rates under water- and
air-quenching conditions (see Figs. 1a and b). The standard deviations of these values ranged approximately from ± 1 ºC to ± 2 ºC. Heating rate, φ
(ºC/min)
Peak B (θ'–Al2Cu) Peak C (θ–Al2Cu)
Water quenching Air quenching Water quenching Air quenching
To Tp Te To Tp Te To Tp Te To Tp Te 10 218 281 330 210 287 340 444 486 520 426 480 517 20 225 306 360 222 308 362 465 499 524 442 491 521 30 234 318 371 230 322 379 474 506 532 454 500 528 40 251 327 386 242 329 388 479 510 534 462 505 532 50 257 339 405 254 343 410 483 513 537 471 510 536
![Fig. 4. (a) TEM bright-field image and (b) corresponding SADP obtained near the [001]α zone axis from an AA2219 sample water-quenched and aged at 190 ºC for 8 h](https://thumb-eu.123doks.com/thumbv2/123doknet/7570626.230624/20.918.112.810.635.977/bright-field-image-corresponding-sadp-obtained-sample-quenched.webp)
![Fig. 6. (a) TEM image showing the precipitation of θ phase within the α-Al and at θ'/α-Al interfaces, (b,c) TEM images showing the precipitation of θ phase at grain boundaries (GB) and (d) corresponding SADP obtained near the [001]α zone axis from an AA](https://thumb-eu.123doks.com/thumbv2/123doknet/7570626.230624/22.918.111.807.196.896/showing-precipitation-interfaces-showing-precipitation-boundaries-corresponding-obtained.webp)