HAL Id: in2p3-00857340
http://hal.in2p3.fr/in2p3-00857340
Submitted on 11 Sep 2013
HAL is a multi-disciplinary open access
L’archive ouverte pluridisciplinaire HAL, est
In gas laser ionization and spectroscopy experiments at
the Superconducting Separator Spectrometer (S3):
Conceptual studies and preliminary design
R. Ferrer, B. Bastin, D. Boilley, P. Creemers, P. Delahaye, E. Liénard, X.
Fléchard, S. Franchoo, L. Ghys, M. Huyse, et al.
To cite this version:
R. Ferrer, B. Bastin, D. Boilley, P. Creemers, P. Delahaye, et al..
In gas laser ionization and
spectroscopy experiments at the Superconducting Separator Spectrometer (S3): Conceptual
stud-ies and preliminary design. 16th International Conference on Electromagnetic Isotope Separators
and Technique related to their Applications (EMIS2012), Dec 2012, Matsue, Japan. pp.570-581,
�10.1016/j.nimb.2013.07.028�. �in2p3-00857340�
1 2 3 4 5 6 7 8 9 10 11 12 13 14 15 16 17 18 19 20 21 22 23 24 25 26 27 28 29 30 31 32 33 34 35 36 37 38 39 40 41 42 43 44 45 46 47 48 49 50 51 52 53 54 55
In Gas Laser Ionization and Spectroscopy experiments at the
Superconducting Separator Spectrometer (S
3): Conceptual studies
and preliminary design
R. Ferrera,⇤, B. Bastinb, D. Boilleyb, P. Creemersa, P. Delahayeb, E. Li´enardc, X. Fl´echardc, S. Franchood, L. Ghysa,e, M. Huysea, Yu. Kudryavtseva, N. Lecesneb, H. Lub, F. Luttonb, E. Mogilevskiya, D. Pauwelsa, J. Piotb, D. Radulova, L. Rensa, H. Savajolsb, J. C. Thomasb, E.
Traykovb, C. Van Beverena, P. Van den Bergha, P. Van Duppena
aKU Leuven, Instituut voor Kern- en Stralingsfysica, Celestijnenlaan 200D, B-3001 Leuven, Belgium b
GANIL, CEA/DSM-CNRS/IN2P3, B.P. 55027, 14076 Caen, France
cLPC Caen, ENSICAEN, Universit´e de Caen, CNRS/IN2P3, Caen, France d
Institut de Physique Nucl´eaire (IPN) d’Orsay, 91406 Orsay Cedex, France
e
SCK·CEN, Belgian Nuclear Research Center, Boeretang 200, 2400 Mol, Belgium
Abstract
The results of preparatory experiments and the preliminary designs of a new In-Gas Laser Ioniza-tion and Spectroscopy setup, to be coupled to the Super Separator Spectrometer S3of SPIRAL2-GANIL, are reported. Special attention is given to the development and tests to carry out a full implementation of the in-gas jet laser spectroscopy technique. Application of this novel tech-nique to radioactive species will allow high-sensitivity and enhanced-resolution laser spectroscopy studies of ground- and excited-state properties of exotic nuclei.
Keywords: Resonance ionization, laser ion source, gas cell, gas jet PACS: 29.25.Ni, 29.25.Rm, 41.85.Ar
1. Introduction
Ever since the early days when step-wise resonance laser ionization was proposed as a selective and efficient ionization tool [1] for the production of isobaric-pure Radioactive Ion Beams (RIBs) [2, 3] its usage has continued growing. It is such, that several on-line facilities worldwide use currently a Resonance Ionization Laser Ion Source (RILIS) [4], or plan to do so, as a powerful production mechanism of high-purity RIBs. In some cases, as e.g. RILIS-ISOLDE, this type of ion source is already used in more than half of the annually programmed beam times of the ISOLDE facility (a total of 3000 h in 2012 [5]).
∗Corresponding author
Email address: Rafael.Ferrer@fys.kuleuven.be, Tel.:+32 16327271, Fax:+32 16327985 (R. Ferrer) *Manuscript
1 2 3 4 5 6 7 8 9 10 11 12 13 14 15 16 17 18 19 20 21 22 23 24 25 26 27 28 29 30 31 32 33 34 35 36 37 38 39 40 41 42 43 44 45 46 47 48 49 50 51 52 53 54 55
Currently there exist two types of RILIS, one operating in a hot cavity [6] and the other in a gas cell [7]. While in the former radioisotopes diffuse out of a high temperature target (T∼2000◦C), usually bombarded previously by high-energy protons, and are subsequently laser ionized in the ionizer cavity attached to it, in the latter the reaction products are thermalized and neutralized in a cell filled with a high pressure (p= 200-500 mbar) helium or argon buffer gas, where they are subsequently laser ionized. Owing to the thick targets used in the hot cavity approach, isotopic productions that are orders of magnitude higher than in the gas cell can be obtained. On the other hand, for the production of refractory elements or for some short-living isotopes, the gas cell approach is better suited.
Owing to its high selectivity, RILIS is not only constrained to the production of element-pure RIBs but also for producing pure isomeric RIBs [8, 9, 10] in those cases where the species of interest exhibit a suitable hyperfine structure splitting. This enhanced selectivity also confers RILIS the possibility of being used as a spectroscopy tool to perform in-source laser spectroscopy studies of rare species with a very high sensitivity, of a few [11, 12] or less than one ion per second [13], although with only moderate resolution. As a matter of fact, both types of RILIS approaches suffer from either an inherent Doppler broadening or pressure broadening and shift of the resonance due to the high temperature of the hot cavity or the high pressure of the gas cell, respectively. This results in practice in a final spectral resolution not better than ∼4 GHz, which in many cases is insufficient to fully resolve the atomic hyperf ine structure (HFS), although charge radii deduced from isotope shifts in heavy-mass nuclei can be determined with a reasonable accuracy [11, 14].
In order to overcome the limited resolution and efficiency factors of in-source laser spec-troscopy, a novel spectroscopic technique for rare isotopes has recently been presented [15] in which laser ionization, and therefore spectroscopy, is performed in the gas jet streaming out of the gas cell. The environmental conditions in the supersonic gas jet are such that after a careful choice of the ionization region a reduction of the spectral resolution down to a few hundred MHz can be achieved, as also demonstrated in [15] in a series of off-line experiments on the stable copper isotopes.
In this paper, we report on the results of a number of experiments and studies carried out at the Leuven Isotope Separator Online (LISOL) facility that have served to investigate the require-ments to perform in-gas jet laser spectroscopy studies [15] on rare isotopes at the future RIB facility SPIRAL2 (France) [16]. Results from a series of conceptual studies that have been used to prove the feasibility and to define the preliminary design of a novel In-Gas Laser Ionization and
2 3 4 5 6 7 8 9 10 11 12 13 14 15 16 17 18 19 20 21 22 23 24 25 26 27 28 29 30 31 32 33 34 35 36 37 38 39 40 41 42 43 44 45 46 47 48 49 50 51 52 53 54 55
Spectroscopy (IGLIS) setup to be coupled online to the Super Separator Spectrometer (S3) are presented. At S3, experiments will be performed with the high-current stable beams of LINAC (∼ 1-5 mA), the superconducting linear accelerator currently being built in the framework of SPIRAL2. Commissioning and test of the complete IGLIS setup will be accomplished off-line in a new laser laboratory at KU leuven prior to on-line operation. With the IGLIS setup at S3, the production of selected pure ground- and isomeric states of very exotic RIBs will be possible. High-sensitivity and enhanced-resolution laser spectroscopy studies of ground- and excited-state properties of the N=Z nuclei up to the doubly-magic 100Sn and those of the very-heavy and superheavy (transfermium) elements will become accessible, overcoming thus the present exper-imental constraints of low-production rates and low-spectral resolution that currently prevent the study of these exotic nuclei.
2. IGLIS@LISOL: Limitations of the gas cell approach
At the LISOL facility [7, 17], located at the Cyclotron Research Center (CRC), Louvain-la-Neuve [18], purified RIBs are produced using a gas cell-based laser ion source. Figure 1 shows a schematic layout of the facility. Two-step two-color ionization schemes are employed at LISOL to step-wise ionize the species of interest. The LISOL laser system consists therefore of two dye lasers each of them pumped by a XeCl excimer laser of 15 ns pulse length at a maximum repetition rate of 200 Hz [7]. The first step laser is typically frequency doubled in a second harmonic generation unit (SHG) to reach the required UV radiation. The laser frequency can be measured using a lambdameter calibrated by a single-mode frequency-stabilized He-Ne laser. Additionally, when stable beams are available, an atomic beam of the element under investigation can be used in the reference cell to tune both lasers in resonance and to monitor laser-frequency and laser-power systematic effects. In the dual-chamber gas cell [19] a primary ion beam, accelerated by the CYCLONE110 cyclotron, impinges on a thin target. The recoiling reaction products are thermalized and neutralized within the stopping chamber and then transported by the gas flow towards the ionization chamber, where they interact with the laser beams (transported over an optical path of 15 m) and are resonantly ionized to a 1+ charge state. The photo-ions are typically extracted through a 1 mm diameter exit hole and transported by a radio-frequency sextupole ion guide (SPIG) [20]. While neutralized reaction products are pumped away, the RIB is accelerated to an energy of 40 keV and mass separated according to its mass-to-charge ratio A/Q using a dipole magnet. The resulting isobaric RIB is subsequently implanted, according to its characteristic decay radiation, either on the tape of a moving-tape station (β-γ emitters) or
1 2 3 4 5 6 7 8 9 10 11 12 13 14 15 16 17 18 19 20 21 22 23 24 25 26 27 28 29 30 31 32 33 34 35 36 37 38 39 40 41 42 43 44 45 46 47 48 49 50 51 52 53 54 55 excimer 1 excimer 2 dye reference cell He-Ne
-meter gas cell
CYCLONE 110 cyclotron beam SPIG target accel. optics dipole magnet tape station / windmill / SEM collector plates SHG Ionization chamber Laser Hut dye ~ 15 m measuring station:
Figure 1: Schematic view of the LISOL facility including the optical layout.
in the carbon foils of a windmill setup (rotating wheel for α emitters) placed at the measuring station. In addition, the ions can also be counted in a Secondary Electron Multiplier (SEM).
The enhanced sensitivity and selectivity of this apparatus, as well as the high contaminant suppression, have allowed in-gas cell laser spectroscopy experiments on the neutron deficient
57−59Cu [12, 14] and97−101Ag [13] isotopes with count rates as low as 6 ions/s in the case of57Cu
(T1/2 = 200 ms) or ∼1 ion/s for97Ag (T1/2= 25.3 s), both semi-magic nuclei. The averaged spectral resolution in those experiments was found to be 4 and 10 GHz and the overall efficiency 0.3% and 3% for the experiments on copper and silver, respectively. The overall efficiency is defined as the ratio between the measured production rate and the fraction of recoiling isotopes from the target.
2.1. Experiments on the tin isotopes
Following up the good results obtained previously in this region for the silver isotopes [13], a new experimental campaign was dedicated at LISOL to study the production of purified RIBs of tin isotopes in the vicinity of A=100. Besides the RIB production, these experiments aimed at studying the feasibility of laser spectroscopy on the tin isotopes in view of the future experimental activities with IGLIS@S3.
The tin isotopes were produced by fusion evaporation reactions of16O at an energy of 100 MeV on a92Mo target (3.3 mg/cm2) at an angle of 20◦ with respect to a normal plane to the beam propagation. Two different ionization schemes were tested in these experiments. The scheme shown in Fig. 2a) was obtained at LISOL by scanning the continuum using an atomic beam of tin generated in the reference cell (RC), while that in Fig. 2b) was taken from the
2 3 4 5 6 7 8 9 10 11 12 13 14 15 16 17 18 19 20 21 22 23 24 25 26 27 28 29 30 31 32 33 34 35 36 37 38 39 40 41 42 43 44 45 46 47 48 49 50 51 52 53 54 55 !"#$%& %$ $'!($)& *$ +,-./-001$ 12$('345)%$-1 22$3'346$-1 7&8$'6()(4"6$+19%$ )6('54*'$+19%$$ :7;$ $ *$+19%$$ !'<$)= %$ $'!($)& *$ +,-./-001$ 12$((34"5'$-1 22$"(>4%$-1 33'*>4">$+19%$$ :7;$ *$+19%$$ ,-$ .-$ !"?$(& %@($ "*3)*4)$+19%$$ !5?$(&%@($ "%()>4'$+19%$$
Figure 2: Resonance ionization schemes for tin tested in these experiments. a) Obtained by scanning the contin-uum in an atomic beam produced in the reference cell. b) Taken from reference [21].
literature [21].
Both transitions in the schemes a) and b) were saturated with the available average energy per pulse of 0.2 mJ and 1.8 mJ entering the gas cell for the first and second step, respectively. Owing to the low-melting point of tin no filament could readily be installed in the gas cell, filled with argon at a pressure of 300 mbar. Consequently, the monitoring of the first step laser frequency in the experiments was carried out according to the signal from the reference cell.
In a total of three on-line runs both atomic schemes were tested for the production of106Sn, which was found to be at best 380(50) at/pµC with a total efficiency of 0.17(2)%, for the atomic scheme a). The total efficiency was obtained by considering the fraction of recoiling isotopes from the target assuming a cross section of 3.67 mb [22] for the 2n-evaporation channel.
To study possible systematic effects that could explain the low RIB production efficiency, which could be due to a strong pressure and/or isotope shift between the stable tin in the reference cell and the radioactive tin isotopes produced in the gas cell, or to the overlap of the lasers with the atomic beam within the ionization chamber, clearly an atomic vapor of stable tin was needed in the gas cell. A filament made out of bronze (89% copper and 11% tin) was used for a systematic off-line study using the atomic scheme b). The most relevant results obtained from these off-line studies are shown in Fig. 3. Frequency scans of the first- (bottom) and second-(top) step transitions using the stable isotope 120Sn were measured for different pressures of the buffer gas. The pressure broadening and -shift were quantified by fitting the resulting line profiles. For the first step, a pressure shift coefficient γsh= 4.0(0.3) MHz/mbar was obtained, very similar to that measured in former experiments on the silver isotopes [13]. The deduced pressure-broadening coefficient of γbr= 32(4) MHz/mbar shows the difficulties to study the HFS using this transition.
1 2 3 4 5 6 7 8 9 10 11 12 13 14 15 16 17 18 19 20 21 22 23 24 25 26 27 28 29 30 31 32 33 34 35 36 37 38 39 40 41 42 43 44 45 46 47 48 49 50 51 52 53 54 55
!"#$ !%#& !%#$ !$#& $#$ $#& %#$ $#$ $#" $#' $#( $#) %#$ * + ,,-. /0 1 . 0234 056 ,7 #0 + #8 96:-.+;7-,<0!0=>"&?#$&0@;!%05@;!%8
! "$$" "$$= "$$' "$$& "$$( "$$? "$$) "$$> $#$ $#" $#' $#( $#) %#$ 0A05;76,80B0 0%$$0 0%&$ 0"$$ 0=$$ 0'$$ 0&$$ 0,-C#0@-DD * + ,,-. /0 1 . 0234 056 ,7 #0 + #8 0 0 96:-.+;7-,<0!0&>"="#(>0@;!%05@;!%8
"Figure 3: Frequency dependence on the pressure for the first (bottom) and second (top) step transition in120Sn
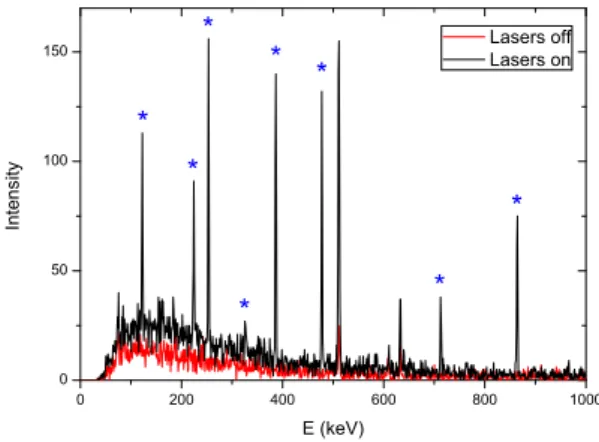
2 3 4 5 6 7 8 9 10 11 12 13 14 15 16 17 18 19 20 21 22 23 24 25 26 27 28 29 30 31 32 33 34 35 36 37 38 39 40 41 42 43 44 45 46 47 48 49 50 51 52 53 54 55 0 200 400 600 800 1000 0 50 100 150 * * * * * * * In te n s it y E (keV) Lasers off Lasers on *
Figure 4: Typical γ spectra obtained at the tape station when the mass separator was set to select a mass-to-charge ratio A/Q= 106 with lasers on resonance for the ionization of tin (dark) and with lasers off (light). The asterisks indicate characteristic γ peaks from the β decay of106Sn.
be surprisingly large when compared with our previous experience with other ionization steps. As may be seen in the top graph of Fig. 3 while fixing the wavelength of the second step to that of the reference cell (open circles) in the on-line runs, the laser settings were most likely far from the optimum resonance value. This strong dependence of the second step transition on the pressure can be understood given the observed Rydberg nature of the autoionizing state [21] that makes these transitions very sensitive to collisions with the buffer gas.
Scheme a) showed a similar dependence of the second step transition on the pressure when it was used in on-line conditions to ionize106Sn. After correcting for the shift, the production efficiency obtained in the former experiments could be increased by roughly a factor of three, up to a value of 0.40(2)%. A typical γ spectrum obtained with the tape station setup for lasers on and off when the mass separator was set to select mass-to-charge ratio A/Q= 106 is shown in Fig. 4. The asterisked peaks indicate characteristic γ transitions from the β decay of106Sn. For these experiments, the focal-plane measuring station comprised of three plastic scintillator detectors for β-decay counting and two single crystal co-axial HPGe detectors for γ-ray detection, all arranged in close geometry around the deposition point.
The spectral linewidth obtained by scanning the first step transition in scheme a) was found to be affected by a pressure broadening similar to that previously measured using scheme b). Thus, the results of these experiments pointed to the in-gas-jet laser spectroscopy technique as the only choice to study the tin isotopes using these ionization schemes.
1 2 3 4 5 6 7 8 9 10 11 12 13 14 15 16 17 18 19 20 21 22 23 24 25 26 27 28 29 30 31 32 33 34 35 36 37 38 39 40 41 42 43 44 45 46 47 48 49 50 51 52 53 54 55 2.2. Production of212,213Ac beams
As a first approach to IGLIS experiments in the very-heavy region of the chart of nuclides a still ongoing experimental campaign is being dedicated to the production and laser spectroscopy experiments of RIBs of actinium. Information from optical spectroscopy experiments is very scarce in this region [4], the radium isotopes (Z= 88) being the last isotopic chain for which moments and mean-square charge radii are known from on-line experiments [23]. The reduced amount of experimental data in the upper part of the chart of nuclides is due to the lack of stable isotopes and to the low production cross sections. As not many optical transitions were available in the literature for Ac [24] a search for an efficient ionization scheme prior to our experiments had to be performed. This work was done at the Johannes Gutenberg University (Mainz, Germany) [25]. There, a series of off-line experiments were carried out using the long lived227Ac isotope (T1/2= 22 y) that was evaporated by ohmic heating from a sample of atoms within the graphite furnace of an atomic beam unit. Scanning of the second step transition was performed with an all-solid-state Ti:sa laser system and several autoionizing states as well as a more precise value of the ionization potential were obtained [26]. One of such ionization schemes (see inset in Fig. 5) was used at LISOL to ionize the212,213Ac isotopes, which were produced in fusion-evaporation reactions of a20Ne beam (0.3 pµA) at an energy of 145 MeV on a197Au target (1.9 mg/cm2) with a measured total cross-section of 2.3 mb for the sum of the two isotopes [27].
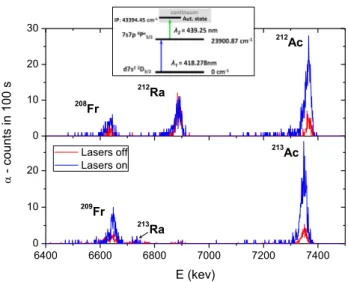
Figure 5 shows typical α-spectra registered with the silicon detector at the windmill setup when the mass separator was set to select ion beams of mass-to-charge ratio A/Q= 212 (top) and 213 (bottom) for lasers off and lasers on. In the windmill setup the photo-ions are implanted on thin carbon foils located in a rotating wheel. The α particles emitted by the decay of the radioactive isotopes escape the foil and are collected by a Passivated Implanted Planar Silicon (PIPS) detector.
The total efficiency of212Ac and213Ac was found to be about 1% for lasers on and 0.2 % for lasers off, respectively. The ion selectivity in these experiments was not optimum as DC electric fields on the collector plates (see Fig. 1) were not employed to collect non-neutralized species [19]. In the spectra one may also see the radium isotopes as the main parasitic beam reaching the detector for the mass-to-charge ratio A/Q=112, while the francium isotopes are produced in the α-decay of the actinium isotopes.
The production of both actinium isotopes was measured as a function of the primary beam energy, which was varied using a set of degrader foils placed in a rotating wheel in front of the gas
2 3 4 5 6 7 8 9 10 11 12 13 14 15 16 17 18 19 20 21 22 23 24 25 26 27 28 29 30 31 32 33 34 35 36 37 38 39 40 41 42 43 44 45 46 47 48 49 50 51 52 53 54 55 ! "! #! $! %&!! %%!! %'!! (!!! (#!! (&!! ! "! #! ) *) + , -. /0 )1 . )" ! ! )0 )230450),66 )230450),. !"! #$ !"! %& !'( )* !"+ %& !"+ #$ !', )* ) 7)894:;
Figure 5: Alpha spectra obtained when the mass separator was set to select ions with A/Q= 212 (top) and 213 (bottom). Characteristic lines for212Ac (E= 7380 keV) and213Ac (E= 7364 keV) may be seen for lasers on (blue)
and lasers off (red). The main contaminant species along with the daughter decay products are also observed. The ionization scheme used in the production of the Ac beams is shown on top.
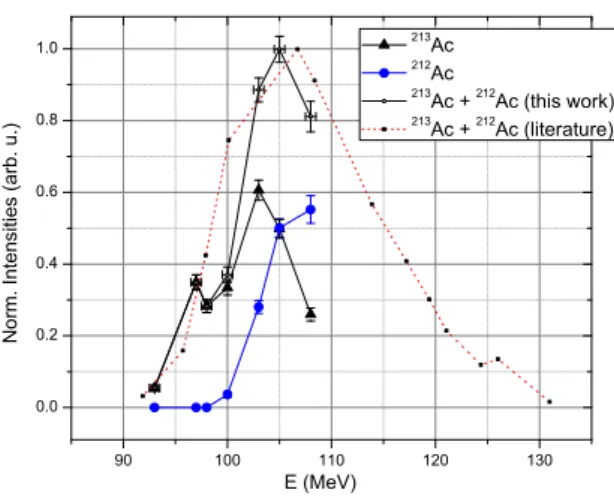
cell. The resulting excitation functions for212Ac and213Ac are shown in Fig. 6 along with the sum of both in order to see the agreement with previous experimental results from the literature [27], where only the excitation function for the sum of the two isotopes could be determined.
Preliminary in-gas cell broadband laser spectroscopy was also performed on212Ac revealing a full-width at half maximum (FWHM) for the linewidth of the excitation step of about 30 GHz which masked any indication of the HFS. Future experiments to perform systematic studies and characterize the frequency dependence on the pressure are planned in order to further reduce the resonance linewidth as well as to determine the isotope shift.
Apart from the need for higher resolution, limited efficiency and selectivity values due to residual effects of the passage of the primary beam in the gas cell can also be improved. These experiments also show the importance of reducing isobaric contamination resulting from surviving or re-ionization of unwanted ions. In these heavy-ion fusion evaporation reactions, the reaction channel of interest is often a fraction of the total fusion evaporation cross section. In the case of100Sn, for instance, ions with essentially the same mass will be produced at 106 to 107 times higher rate. As will be shown below, the IGLIS setup coupled to S3provides the tools to obtain the necessary suppression factors.
1 2 3 4 5 6 7 8 9 10 11 12 13 14 15 16 17 18 19 20 21 22 23 24 25 26 27 28 29 30 31 32 33 34 35 36 37 38 39 40 41 42 43 44 45 46 47 48 49 50 51 52 53 54 55 90 100 110 120 130 0.0 0.2 0.4 0.6 0.8 1.0 E (MeV) N o rm . In te n s it ie s ( a rb . u .) 213 Ac 212 Ac 213 Ac + 212 Ac (this work) 213 Ac + 212 Ac (literature)
Figure 6: Normalized production intensities of212Ac and213Ac as a function of the energy of the primary beam
at the exit of the target. The summed function of the two isotopes is also shown for comparison with previous experimental results (see text).
3. IGLIS@LISOL: On the way to an enhanced Resolution, Efficiency, and Selectivity As presented earlier in previous works at LISOL [15, 28], the main experimental conditions that prevent higher spectral-resolution studies with a gas cell-based laser ion source could be overcome by performing the process of photo-ionization in the cold jet expanding out of the gas cell. Full implementation of in-gas jet laser spectroscopy for its use in spectroscopy studies on rare isotopes is however challenging and has not been yet accomplished. Here we report on the results of a number of tests that served to overcome the limiting factors and to set the requirements that need to be fulfilled in order to obtain maximum benefits of in-gas jet laser spectroscopy on radionuclides.
3.1. Spatial overlap
To perform laser spectroscopy in the gas jet with maximum efficiency and enhanced spectral resolution, the interaction volume defined by the overlap of the laser beams with the atomic gas jet has to be optimized and carefully selected. To accomplish such requirements a non-linear segmented radiofrequency quadrupole (RFQ) ion guide system consisting of two RFQ structures will be employed. In the first RFQ, operated at high background pressure (∼ 0.01-0.1 mbar), the curved-shaped electrode distribution will allow sending the laser beams in counter-propagating direction to the atomic beam from a close distance, avoiding thus the cut of the laser beams by any limiting aperture. The second RFQ structure, with a smaller transverse cross section (inscribed
2 3 4 5 6 7 8 9 10 11 12 13 14 15 16 17 18 19 20 21 22 23 24 25 26 27 28 29 30 31 32 33 34 35 36 37 38 39 40 41 42 43 44 45 46 47 48 49 50 51 52 53 54 55 L1&L2 (mode 1) ! 0 Jet mode
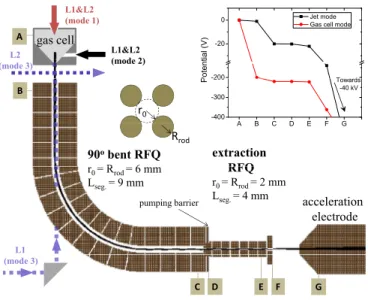
Gas cell mode gas cell ! L1&L2 (mode 2) L2 (mode 3) -200 -20 T d P o te n ti a l (V) !" " A B C D E F G -400 -300 200 Towards -40 kV P 90obent RFQ R 6 extraction RFQ #!$% A B C D E F G r0 = Rrod= 6 mm Lseg. = 9 mm RFQ r0 = Rrod= 2 mm Lseg. = 4 mm acceleration pumping barrier electrode L1 (mode 3) # $ % & '
Figure 7: Schematic layout of the prototype RFQ ion-gude system tested at LISOL. Ion trajectories through the system obtained with the SIMIONrsoftware and the dimension of the RF electrodes are shown. The inset
shows the evolution of the axial DC potential with reference to the different points indicated in the figure. Two alternative optical paths for laser ionization and spectroscopy are indicated (see text for details).
radius), will act as a differential pumping unit to provide a convenient pressure suppression factor and maximize the transport efficiency of the RIB.
A prototype of such a RFQ ion-guide system has been commissioned and tested at LISOL (see Fig. 7). It consists of a 90◦-bent RFQ (radius of curvature 60 mm) coupled to an extraction RFQ structure acting as a pumping barrier. The prototype ion guide system replaced the SPIG structure in the LISOL setup modifying the area highlighted with a dotted-line square in Fig. 1. The ion guide system was tested in offline conditions using the stable isotopes 63,65Cu pro-duced in the gas cell by resistive heating of a copper filament. Measurements of the beam transport efficiency through the ion guides were performed at two different background pressures of 0.1 and 10−3mbar in the region occupied by the bent RFQ. A pressure suppression factor of 10−3was measured between the 90◦-bent and the extraction RFQ regions. Several measurements of the ion transport were performed in which the copper atoms were first laser ionized using the mode 1 propagating optical path (with L1 and L2 indicating the first and second step lasers, respectively). The photoions were then collected in the rods of the bent RFQ and the ion current subsequently registered by a picoammeter. When a stable and reproducible current readout was achieved, the ion beam was transported by the ion guide system operated at a fixed (optimum)
1 2 3 4 5 6 7 8 9 10 11 12 13 14 15 16 17 18 19 20 21 22 23 24 25 26 27 28 29 30 31 32 33 34 35 36 37 38 39 40 41 42 43 44 45 46 47 48 49 50 51 52 53 54 55 0.2 1 10 1 10 100 t (ms) C o u n ts o n S E M ( a rb . u ) 0 V -1 V -2 V -5 V -10 V -20 V -40 V -50 V -60 V 0 10 20 30 40 50 0 20 40 60 80 T ra n sm is si o n ( % ) VRF - extRFQ (Vpp) Simulation Experiment a) b)
Figure 8: a) Simulated and experimental total transmission through the RFQ ion guides as a function of the RF amplitude applied to the extraction RFQ while operating the bent RFQ with an optimum value of the RF-amplitude of 300 Vpp. b) Accumulated time profiles of a single laser shot registered on the SEM detector for
different values of the DC potential applied between the first and last bent-RFQ segments.
RF-amplitude in the bent RFQ while varying the RF-amplitude in the extraction RFQ. The resulting ion current was again measured immediately after the ions exited the ion guides. The results obtained in these measurements are shown in Fig. 8a. The total transport efficiency was found to be of about 80%. In the figure one also may see the good agreement with the results obtained from simulations of the ion trajectories for a background pressure of 10−3 mbar performed with the SIMIONr 8.0 software package [29]. In these simulations the initial conditions of the ion beam were chosen as to reproduce as well as possible the main features of the atomic beam at the exit of the gas cell. This resulted in a circular source of ions of 1 mm in diameter and mass 63 amu propagating in a filled-cone direction distribution of half angle 30◦ and thermal kinetic energy. A viscous damping model was used in these studies to simulate the ion-neutral collision processes due to the pressure.
The different trend observed in Fig. 8a for RF-amplitudes above 35 Vpp is due to the fact that the mass composition of the photoion beam in the experiment consisted of the two stable copper isotopes plus the corresponding sidebands formed with water molecules of different mass, while in the simulation the ion beam had a well-defined region of RF-amplitude values for which that single-mass could be transported through the ion guides.
Electrode segmentation can be used to apply a DC gradient and speed up the transit of the ion beam through the RFQ structure. Time profiles of the arrival of mass selected A/Q= 63 ions to the SEM detector for different DC potentials across the bent-RFQ electrodes are shown in Fig. 8b). Lasers were sent both in counterpropagating direction to the atomic beam (modified
2 3 4 5 6 7 8 9 10 11 12 13 14 15 16 17 18 19 20 21 22 23 24 25 26 27 28 29 30 31 32 33 34 35 36 37 38 39 40 41 42 43 44 45 46 47 48 49 50 51 52 53 54 55
mode 3 optical path). As one may see the transit time through the high pressure region of the bent RFQ (p= 10−1 mbar in this test) could be shortened by a factor of 10 applying an optimum potential of 40 V (above this the transmission gradually worsens) across the bent-RFQ segments. This feature might be found useful when operating the ion guides at higher pressures. In fact, a flexible range of background pressure conditions may be required depending on the nozzle design to achieve a suitable Mach number that provides the optimum conditions to reach a given spectral resolution [15]. Typical potentials applied to the ion guide electrodes are shown in the inset graph of Fig. 7 for the two ionization modes, gas cell mode (transverse optical path shown as mode 2) and jet mode (crossed-beam optical path indicated as mode 3).
In addition to the ion guide system, implementation of a nozzle at the gas cell exit is paramount for the proper shaping and conditioning of the gas jet. The ionization region will be defined by the crossing of the two laser beams (mode 3 in Fig. 7) at that point in the atomic gas jet between the gas cell and ion guide, where conditions are more beneficial for laser spectroscopy (low pressure and uniform velocity distribution). At the same time, a DC voltage will be applied to the collector plates within the gas cell to avoid the exit of any non-neutralized ion assuring thus an optimum selectivity.
3.2. Temporal overlap and the reduction of the laser bandwidth
The benefits of optimizing the temporal overlap of the laser beams with the atomic jet by using a high repetition pulse-rate laser system were evaluated in previous experiments performed at LISOL [30]. In those experiments the 200 Hz LISOL laser system was compared in off- and on-line conditions with a 10 kHz all-solid-state Ti:sa laser system. In the next section the main features of the laser system that will be used at S3 to perform spectroscopy studies in the gas jet are described. In the following, the results of a series of tests devoted to reduce the linewidth of the laser employed for atomic excitation and at the same time probing the atomic HFS are presented.
Implementation of a thicker etalon
Analysis of the narrow-band laser radiation generated by the LISOL first step laser (Lambda Physik Scanmate 2) using a Fabry-P´erot interferometer revealed three to four longitudinal oscil-lation modes in the dye laser resonator, where a 5 mm etalon (air-gap spaced) was placed as an additional dispersive element. This mode distribution resulted in a linewidth for the fundamen-tal light of FWHM ∼ 1.2 GHz. In order to select only one of such modes and thus reduce the
1 2 3 4 5 6 7 8 9 10 11 12 13 14 15 16 17 18 19 20 21 22 23 24 25 26 27 28 29 30 31 32 33 34 35 36 37 38 39 40 41 42 43 44 45 46 47 48 49 50 51 52 53 54 55
laser bandwidth, a thicker etalon of ∼14 mm (air-gap spaced) was chosen to replace the original one. The generated light was frequency doubled in the SHG unit and sent to the reference cell, where an atomic beam of stable copper isotopes was produced by ohmic heating of the crucible. The ionization scheme used here was that employed in previous experiments (see e.g. [30]). The first step transition was scanned and the HFS could be resolved with a FWHM of 450 MHz. Further improvement of the value could be obtained by optimizing both the laser power and the divergence of the atomic beam. The fact that mode competition could not be completely eliminated and that no reliable method was found to control the appearance of a second mode made this approach unsuitable for longer experiments with radioactive atoms.
Amplification of a continuous wave single mode diode laser radiation
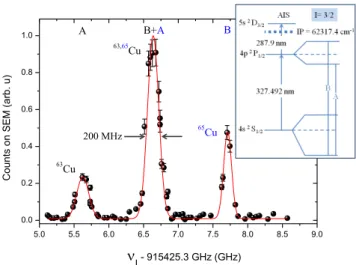
A second way investigated to reduce the laser bandwidth consisted in the amplification of the continuous wave (CW) single mode diode laser radiation in a pulsed dye amplifier. The CW diode-laser beam of wavelength 654.98 nm and power of up to 150 mW used as seed source, was focused in the first dye-cell of a two-stage dye amplifier. A dye solution of DCM in dimethyl sulfoxide (DMSO) in the dye cells was pumped by the 308 nm light of the XeCl excimer laser. Efficient reduction of amplified spontaneous emission allowed us to obtain a pulsed beam of single mode radiation at the seeded wavelength and with a maximum average energy per pulse of 300 µJ at the exit of the pulsed dye amplifier. Subsequent frequency doubling in a KDP crystal resulted in a laser beam with a proper wavelength to probe the HFS of the stable copper isotopes in the reference cell, in the same fashion as in the previous test with the thicker etalon. This time though, a different ionization scheme was employed in order to match the emission frequency of the diode laser with that used to excite and probe the HFS of the copper isotopes. The frequency scan including two of the hyperfine transitions which define the splitting of the excited level is shown in Fig. 9. These resonances were used to measure the resulting laser bandwidth that was found to be slightly better than 200 MHz. Notice that the minimal bandwidth is determined by the pulse duration (Fourier-limited) of the pump laser that in this case was found to be of 5 ns, which resulted in a FWHM ∼90 MHz. This means that the measured linewidth was affected by a residual Doppler broadening of about 170 MHz due to the angular divergence of the atomic beam in the interaction volume with the laser beams.
This represents a reduction of a factor of seven of the typical narrow-band pulse linewidth of the LISOL frequency-doubled laser radiation employed for spectroscopy studies. This approach to reduce the laser bandwidth will be used in the future in-gas jet laser spectroscopy experiments
2 3 4 5 6 7 8 9 10 11 12 13 14 15 16 17 18 19 20 21 22 23 24 25 26 27 28 29 30 31 32 33 34 35 36 37 38 39 40 41 42 43 44 45 46 47 48 49 50 51 52 53 54 55 !"# !"! $"# $"! %"# %"! &"# &"! '"# #"# #"( #") #"$ #"& *"# B+A B + + , -. / 01+ -/ +234+ 56 78 "+ . 9 :;+'*!)(!"<+=>?+5=>?9 63,65 Cu 63 Cu 65 Cu A !200 MHz
Figure 9: Hyperfine splitting of the2P
1/2excited state for a natural abundance admixture of copper isotopes
produced in the reference cell. The obtained linewidths were used to measure the reduction of the laser bandwidth by seeding of a CW diode laser into a pulse dye amplifier. The inset shows the ionization scheme employed in these tests and the expected HFS of the electronic levels.
at S3.
4. IGLIS@KU Leuven
Heretofore the main requirements to realize in-gas jet laser spectroscopy experiments on rare isotopes with an enhanced resolution have been laid down and, for some particular cases, preparatory experiments have served to decide about the best strategies to accomplish this task. In this context, there are still three main subjects that need to be investigated in order to optimize the efficiency and resolution of this technique, namely the tools and conditions for a gas jet formation suited for high-resolution spectroscopy studies, the optimum gas cell geometry to provide the maximum extraction efficiency with the shortest evacuation time, and the test of a new high-repetition pulse rate laser system.
A new IGLIS laser laboratory is currently being commissioned at KU Leuven to carry out a detailed study of these topics under off-line conditions and hence characterize the technique of laser spectroscopy in supersonic gas jets. Once optimum operation is achieved at our home laboratory, the IGLIS setup will be relocated to the S3facility, where it will be put into operation for the efficient and selective production of a wide variety of RIBs as well as for laser spectroscopy studies on the N=Z nuclei and those in the heavy and superheavy regions.
1 2 3 4 5 6 7 8 9 10 11 12 13 14 15 16 17 18 19 20 21 22 23 24 25 26 27 28 29 30 31 32 33 34 35 36 37 38 39 40 41 42 43 44 45 46 47 48 49 50 51 52 53 54 55
4.1. Commissioning and test of the laser system for S3
Commission and test of a new laser system is the first task that will be carried out at the IGLIS laboratory. The laser system will be used in a latter stage for the investigation of in-gas jet laser spectroscopy on stable, and eventually, long-lived isotopes.
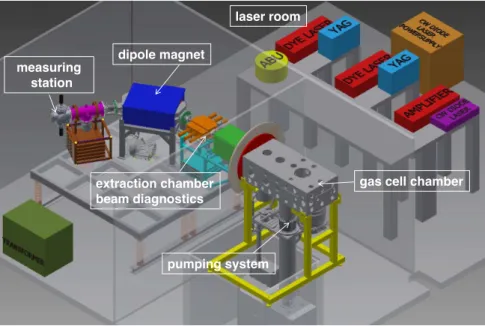
The laser system consists of two INNOSLAB Nd:YAG lasers (Edgewave GmbH) with a max-imum power of 90 W for the green (532 nm) and 36 W for the blue (355 nm) light. They will be used as pump lasers at a maximum repetition rate of 15 kHz for two CREDO pulsed dye lasers (Sirah Lasertechnik GmbH) as well as for a pulsed dye amplifier. The latter, will be used in combination with a CW single mode diode laser Ta-pro (Toptica Photonics AG). A wide tuning-range of the laser system covering the wavelength interval 215-900 nm will allow the application of two-step atomic schemes to accomplish the ionization process. Depending on the laser spectroscopy mode–in-gas cell or in-gas jet–these lasers can be arranged in different ways. The main difference lies in the choice of lasers utilized in the step used to probe the HFS when performing spectroscopy studies. A dye laser operating in narrow-band mode will suffice to produce an output light with ideal linewidth (∼ 1.5 GHz) for spectroscopy studies in the gas cell. In the case of in-gas jet spectroscopy, a narrow-band light is crucial for obtaining the highest resolution. Here, the light resulting from the amplification of the CW single-mode diode laser radiation in the pulsed dye amplifier (see above) will be employed for the transition to be studied. A fraction of the laser beams will be sent to an Atomic Beam Unit (ABU), where an atomic vapor of the element of interest will be produced, to monitor the laser linewidth and frequency under minimized resonance broadening and shift conditions. In Fig. 10 the layout of the IGLIS laboratory is illustrated. The space is divided in two separated rooms, one for the gas cell coupled to a mass separator and the other for the lasers. The distribution of lasers on the optical tables may be seen in the laser room, which will be kept under clean conditions (ISO8 < 3520000 part/m3) and temperature stabilized within ± 0.5◦C.
4.2. Study of the gas jet formation
The importance of extracting the atomic beam in a well-collimated gas jet was pointed out earlier. By employing a specially designed nozzle at the gas-cell exit the spatial overlap with the laser beams will be maximized. In addition to increasing the ionization efficiency, a proper use of a de Laval or spike nozzle (see [15]) will generate the optimum jet conditions of pressure and temperature to enable an enhancement of the spectral resolution. In supersonic jets the pressure and temperature can vary widely in space and time. When a supersonic jet of gas propagates in a
2 3 4 5 6 7 8 9 10 11 12 13 14 15 16 17 18 19 20 21 22 23 24 25 26 27 28 29 30 31 32 33 34 35 36 37 38 39 40 41 42 43 44 45 46 47 48 49 50 51 52 53 54 55
gas cell chamber
pumping system extraction chamber beam diagnostics dipole magnet measuring station laser room
Figure 10: Schematic layout showing the different components of the new laboratory that is being commissioned at KU Leuven for the study and optimization of the In-Gas Laser Ionization and Spectroscopy (IGLIS) technique to be used in on-line conditions at S3.
steady state through a background medium at rest its behaviour is governed by the ratio between the exit pressure of the jet and the pressure of the background medium. As the pressure ratio is increased above unity shock-waves occur, owing to the compressive effect of the background medium [31], that render higher-resolution spectroscopy studies difficult. Thus, one of the main goals at the IGLIS laboratory is to investigate the occurrence and position of shock-waves in the gas jet for different nozzle designs in order to obtain experimental parameters that will allow the best spectroscopic conditions.
There exist several techniques to perform non-intrusive measurements of the flow-field param-eters in gas jets [32]. At the IGLIS laboratory two well-known techniques that allow temporally-and spatially-resolved measurements of the gas jet by direct visualization will be considered. On the one hand, a laser-based diagnostic technique such as the Planar Laser Induced Fluorescence (PLIF) imaging [33] is regarded as the best choice for this purpose. In this technique a properly-tuned laser beam formed into a thin sheet is sent at normal incidence to the gas jet, where it excites fluorescence from a given transition of a tracer element transported by the buffer gas. Fluorescence from the tracer is subsequently collected by a lens and focused on to a camera’s
1 2 3 4 5 6 7 8 9 10 11 12 13 14 15 16 17 18 19 20 21 22 23 24 25 26 27 28 29 30 31 32 33 34 35 36 37 38 39 40 41 42 43 44 45 46 47 48 49 50 51 52 53 54 55
sensitive surface. Analysis of the fluorescence signal can be used to determine several jet pa-rameters such as concentration, temperature, velocity, and pressure that will be compared with results of detailed flow-dynamic calculations. Note that stable copper isotopes could be chosen as tracer element such that parallel laser ionization spectroscopy studies can be performed to investigate the reduction of the spectral resolution.
On the other hand, Electron Beam Fluorescence (EBF) [34] is considered as a second option to study the gas jet conditions. This diagnosis technique closely resembles that of PLIF with the only difference that the laser beam is replaced by a high-energy electron beam. The main advantage of using EBF is that broadband excitation of the buffer gas induced by the electron beam can be used to obtain fluorescence images of higher intensity than those obtained from the tracer element in the PLIF technique.
4.3. Optimization of the gas cell
The ultimate goal here is to finalize the design of the gas cell to be used at the S3 focal plane. Although the type of nuclear reactions that will be used at S3 is similar to that used at LISOL, the situation at S3 will be quite different as the entrance window of the gas cell will be considerably larger and thinner in order to match the beam characteristics of S3. A major advantage of the S3approach will be the superior primary beam reduction and the reasonable mass-to-charge state selection reducing the number of ions entering the gas cell to the isotopes of interest and its neighboring isobars. This is in contrast with the LISOL approach, where the primary beam as well as the reactions products enter the gas cell.
The design of the S3 gas cell will be tested and optimized at the IGLIS laboratory. Com-putational flow-dynamic simulations using the COMSOL Multiphysicsrsoftware package were carried out to investigate the trajectory and the transit time of the atoms through the gas cell for a number of different gas cell geometries. Experimental results on the time profiles corresponding to the ion signal of a single laser shot were reproduced fairly well by the simulations. A first and enlightening result obtained from these parametric studies is the need of implementing a more careful buffer gas inlet mechanism to provide a more homogeneous flow within the gas cell. In fact, formation of gas flow vortices can be associated with a high level of atom sedimentation into the gas-cell walls reducing the transmission efficiency. Furthermore, smooth curving in the tran-sition from the stopping into the ionization chamber can dramatically influence the transmission efficiency of atoms through the cell. Figure 11 illustrates a preliminary design of an optimized gas cell geometry to be tested in the IGLIS laboratory. Further calculations will be performed
2 3 4 5 6 7 8 9 10 11 12 13 14 15 16 17 18 19 20 21 22 23 24 25 26 27 28 29 30 31 32 33 34 35 36 37 38 39 40 41 42 43 44 45 46 47 48 49 50 51 52 53 54 55 entrance window exit orifice buffer-gas inlet
Figure 11: Preliminary design of the new gas cell for S3. Dimensions are given in mm.
and compared with experimental results.
5. RIB production and laser spectroscopy experiments at S3
The apparatus implementing the developments that proved an optimum performance during the study and test period will be commissioned at S3 to carry out in-gas laser ionization and spectroscopy experiments on rare isotopes. The IGLIS gas cell will be placed at the S3 focal plane where the reaction products separated in flight will be stopped and neutralized. The species of interest will be selectively re-ionized, either in the gas cell–for exploratory or low-resolution laser spectroscopy experiments–or in the gas jet, and subsequently transported by a RFQ ion guide system towards a switch yard. From this point, the RIBs will be sent to a number of experimental setups in the S3cave, such as a decay station or an MR-ToF setup, or later on, in a more advanced operation phase of the facility, to the DESIR cave to perform experiments with low-energy beams [35]. Thus, IGLIS at S3 will provide the means for the production of pure RIB’s at low energies for decay studies as well as for performing laser-spectroscopy studies to investigate nuclear hyperfine interactions, giving access to changes in the charge radii, magnetic dipole moments, electric quadrupole moments, and nuclear spins of exotic nuclei.
The overall efficiency of the IGLIS setup coupled to S3can be estimated by the performance of the system on a number of different processes (see Tab. 1) that are briefly discussed in the
1 2 3 4 5 6 7 8 9 10 11 12 13 14 15 16 17 18 19 20 21 22 23 24 25 26 27 28 29 30 31 32 33 34 35 36 37 38 39 40 41 42 43 44 45 46 47 48 49 50 51 52 53 54 55
Table 1: Expected efficiencies of the IGLIS setup coupled to S3 on different processes. Lower- and upper-limit
values are given.
Process Efficiency (%)
Transmission through S3 40 - 50
Thermalization, diffusion, and transport towards the exit hole 50 - 90
Neutralization 50 - 100
Laser ionization (temporal and spatial overlap)a 50 - 60
Transport efficiency 80 - 90
Overall performance 4 - 24
a
For the in-gas-jet ionization mode.
next paragraphs. Transmission through S3
Trajectory calculations of the nuclei through S3were performed using the Tracewin software package considering a special optical mode that focuses all the different charge states of the selected reaction channel onto a small area. This convergent mode thus allows one to focus the secondary beam on the gas cell entrance window. The final value for the transmission through S3 will depend on the specific nuclear reaction. A calculated lower-limit value of 40% will be considered for our estimations, although as an upper limit, a more general 50% transmission is expected.
Thermalization, diffusion, and transport towards the gas cell exit
Preliminary flow-dynamic calculations showed that stopping of the reaction products close to the center of the cell and a homogeneous injection of the buffer gas can result in high extraction efficiencies reaching a value of 90% for a high buffer gas pressure (500 mbar) and 1 mm diameter exit hole. A conservative value of 50% for the extraction efficiency will be considered.
Neutralization
The high primary beam rejection and mass selection provided by S3can reduce in some cases the required formation of e−-ion pairs necessary for an efficient neutralization of the reaction products in the stopping gas-cell chamber. For those cases of a low-current secondary beam, the creation of extra charges using a strong radioactive source to induce a desired plasma density
2 3 4 5 6 7 8 9 10 11 12 13 14 15 16 17 18 19 20 21 22 23 24 25 26 27 28 29 30 31 32 33 34 35 36 37 38 39 40 41 42 43 44 45 46 47 48 49 50 51 52 53 54 55
in the stopping chamber will be implemented. The optimum recombination time would then be controlled by simply changing the distance between the source and the gas cell. Off-line tests of this approach will be performed at Leuven. Accordingly, a lower-limit value of 50% for the neutralization efficiency will be taken.
Laser ionization (temporal and spatial overlap)
As discussed earlier, the use of a high-power and high pulse-repetition rate laser system along with the combined use of the non-linear RFQ structure and the de Laval nozzle will provide optimum temporal and spatial overlap of the laser beams with the atomic gas jet. The ultimate laser ionization efficiency, however, will depend on the ionization scheme (resonant or non-resonant ionization step) and the ionization mode (gas cell or gas jet) employed. Altogether this results in a conservative final estimated value of 50% for the laser ionization efficiency in-gas-jet mode. Note that for in-gas-cell mode this value can reach 100% in case autoionization states are employed in the ionization scheme.
Transport efficiency
For the transport of photoions through the RFQ ion guide system of the IGLIS setup at S3one can expect a similar performance to that obtained with the prototype ion guide system tested at LISOL (see Fig. 8). Based on the previous results one can estimate a total transport efficiency of 80%.
Taking into account the estimated values for the different processes, the expected overall efficiency of the IGLIS setup at S3 will range from 4 to 24% (see Tab. 1).
5.1. Phase I experiments at S3
For phase I of the RIB facility a total of four IGLIS experiments are planned for the first-day operation at S3. An overview presenting the physics behind these experiments and their feasibility is given in the following.
IGLIS studies of94Ag
For many years the study of the most neutron-deficient silver isotopes has been a fertile region for nuclear structure observations, as the investigated nuclei present a wide variety of phenomena, as e.g., low- and high-spin isomerism [36] and beta-delayed proton emission [37]. The case of94Ag is the most notorious as it is considered a candidate for two-proton emission [38].
1 2 3 4 5 6 7 8 9 10 11 12 13 14 15 16 17 18 19 20 21 22 23 24 25 26 27 28 29 30 31 32 33 34 35 36 37 38 39 40 41 42 43 44 45 46 47 48 49 50 51 52 53 54 55
In a similar way to the measurements at LISOL on97−101Ag isotopes [13] in-gas cell laser spectroscopy will be performed to study the HFS in 96−94Ag. In a second phase, in-gas jet laser spectroscopy will be applied to increase the selectivity and the spectral resolution. These measurements will be combined with decay spectroscopy studies on isomerically-enriched beams of94Ag produced by in-gas laser ionization.
IGLIS studies of101−107Sn
The region close to 100Sn is especially important to our understanding of nuclear structure owing to the proximity of the N=50 and Z=50 magic numbers, the N=Z line, and the proton drip-line. While data on the energy systematics in these isotopes has been obtained, information on the single-particle characteristics of the levels involved or the degree of collectivity through the measurement of ground-sate moments is presently still unavailable below108Sn [39].
IGLIS experiments will be performed on the101−107Sn isotopes to study their HFS. According to the results obtained at LISOL the observed strong frequency dependence on the buffer gas pressure makes optical spectroscopy in the gas jet compulsory for accomplishing this purpose and completing the isotopic chain down to101Sn.
IGLIS studies of the very heavy elements (Z∼ 89-102)
The information obtained in the very-heavy element region can be used as important tests to validate nuclear structure theories, essential in the search for an understanding of the superheavy elements and those at the limit of nuclear existence. Many studies have been performed on these nuclei, however, information on the location of single particle levels, and the spins and moments of nuclear states involved is in many cases tentative. The last long chain of isotopes for which detailed information on nuclear spins, moments, and charge radii has been determined are the radium isotopes (Z=88) [23].
To first approach the very-heavy element region we propose studying the actinium isotopes (Z=89). Using the experience gained at LISOL with the production of RIBs of212,213Ac and the results of preliminary broadband spectroscopy on the lighter212Ac, in-gas jet laser spectroscopy might be required to investigate these isotopes and possibly extend these measurements up to the shell closure nucleus215Ac.
IGLIS studies of80Zr
Among the N=Z nuclei, the80Zr nucleus is of particular interest as it appears to be one of the most deformed nucleus in this mass region, and even known in nature, with an estimated
2 3 4 5 6 7 8 9 10 11 12 13 14 15 16 17 18 19 20 21 22 23 24 25 26 27 28 29 30 31 32 33 34 35 36 37 38 39 40 41 42 43 44 45 46 47 48 49 50 51 52 53 54 55
quadrupole deformation of β 0.4 [40, 41]. Observations of such large deformations in the ground states of Z(or N)= 40 nuclei involve the spherical shell closures natural breaking at Z=N=40, as particularly the 1g9/2orbital plays a crucial role in triggering deformation. Besides, the interplay with the pf shell orbitals may also introduce long-lived isomeric states. Additional experimental data on nuclei around80Zr, such as spins and magnetic moments, could help to further elucidate the role of specific single-particle orbitals in the structure of nuclei along the N=Z line, and also that of the effective interactions used in this region of the chart of nuclides.
Currently, the refractory nature of zirconium isotopes prevents their efficient production with conventional high-temperature target ion source systems at isotope separator facilities. In contrast, with the IGLIS setup at S3laser spectroscopy of the very neutron-deficient zirconium isotopes should become accessible for the first time.
5.2. Expected performance on key reactions
In this section the performance of the laser ion source will be evaluated using three represen-tative reactions selected according to the experimental regions of interest for the IGLIS studies. Secondary RIBs of isobars containing the species of interest after in-flight separation by S3will enter the gas cell through a thin window and will be stopped and neutralized by collision with the buffer gas.
As for the gas cell entrance window some technical aspects must be clarified. For experiments in which IGLIS is coupled to S3, the separator will be operated in the so-called convergent mode that will allow one to focus the secondary beam on the gas cell entrance window with an approximate area of 3×5 cm2. Owing to the dimensions of the entrance window, the use of a honeycomb grid attached to it is found necessary to withstand the high pressure difference between the gas cell and the beam line. Such grids are used in Recoil Target Chambers coupled to gas-filled separators like GARIS [42] and TASCA [43], and also to the vacuum separator SHIP at GSI [44]. For low-energy recoils (<0.04 MeV/u) very thin entrance windows will be required in order to allow the nuclei passing through it and being stopped as close as possible to the center of the gas cell stopping chamber. For those low-energy cases, an ultra-thin Mylar window of 0.7-1 µm thickness supported by the honeycomb structure (0.3 mm wide spokes and a hole pitch of 2.9 mm), with a geometrical transmission of 80%, plus an additional extra-mesh attached to the grid with a transparency of 90% (square holes 0.09 mm2and 20 µm wide spokes) will be used. A similar approach has been applied successfully at the TASCA recoil separator [45].
1 2 3 4 5 6 7 8 9 10 11 12 13 14 15 16 17 18 19 20 21 22 23 24 25 26 27 28 29 30 31 32 33 34 35 36 37 38 39 40 41 42 43 44 45 46 47 48 49 50 51 52 53 54 55
in the window material, range in the buffer gas, plasma density, among others, are given below for each considered reaction. Energy loss and stopping in the different materials were obtained with the Stopping and Range of Ions in Matter (SRIM) software package [46]. A summary of the results obtained for the different reactions is listed in Tab. 2. Primary beam currents of 1 pµA are in general considered although currents ≥10 pµA are expected under optimum operational conditions of the facility.
Production of94Ag
The reaction selected for the production of 94Ag is 58Ni(40Ca,pxn)98−xAg. The reaction products, in the 3n-evaporation channel, will be separated by S3 (∆m/m∼ 450) and sent to the gas cell. An estimated beam current of40Ca through the LINAC of 1 pµA and the cross sections obtained from experimental measurements [37, 47] and the GSI Hivap code of 70 nb and 580 nb for the Jπ = 21+ and 7+isomeric states, respectively, result in an estimated rate of 45 94Ag nuclei per second at the focal plane. Note that lower-limits for the transmission efficiency through S3 and for the overall efficiency are considered throughout these discussions (see Tab. 1).
The94Ag nuclei will be transported along with an isobaric cocktail beam of ∼2·106particles per second (pps) entering the gas cell at an energy of 0.75 MeV/u. Using a window thickness of 10 µm of Mylar (Biaxially-oriented polyethylene terephthalate) and an Ar buffer-gas pressure of 500 mbar the evaporation residues will cover a distance through the gas of about 14 mm, with a radial straggling of less than 3 mm, before complete thermalization. The gas cell pressure can be chosen such as to optimize the stopping of the nuclei of interest in the center of the cell. In such a way, one can reduce diffusion losses without a significant repercussion in the final spectral resolution, as observed in previous gas-cell experiments at LISOL.
The travel distance of the beam through the gas will generate a plasma within the stopping volume that will reach a steady density of 2·108pairs/cm3and will provide a minimum time for recombination of about 5 ms [17]. For this reaction, the relative high secondary beam current entering the cell guarantees an efficient neutralization of the species. Assuming a gas cell volume of about 100 cm3 and an exit hole diameter of 1 mm the evacuation time can be estimated to be of about 700 ms. In these conditions the neutralization process will be performed with an efficiency close to 100% as the recombination time is much shorter than the expected evacuation time. A dedicated gas cell tailored for the stopping of this element could be used to reduce the evacuation time and thus minimize decay losses of the isomeric states (94Ag (I= 7+, t1/2= 420
2 3 4 5 6 7 8 9 10 11 12 13 14 15 16 17 18 19 20 21 22 23 24 25 26 27 28 29 30 31 32 33 34 35 36 37 38 39 40 41 42 43 44 45 46 47 48 49 50 51 52 53 54 55
ms) and94Ag (I= 21+, t1/2= 300 ms)) while keeping the same extraction efficiency.
Assuming a lower-limit overall efficiency of the IGLIS setup (see Tab. 1) and considering the transmission through the single-window grid of 80%, a rate of ∼2 pps (neglecting decay losses) are expected at the detector station. This count rate of 94Ag, along with the efficient contaminant suppression obtained by the application of DC-electric field in the collector plates, will allow optical spectroscopy as well as decay studies on this isotope.
Production of215Ac
After the knowledge gained at LISOL on the lighter Ac isotopes, the fusion of22Ne beam on a target of197Au is chosen as the reaction to produce the semi-magic nucleus215Ac. With an estimated primary-beam current of 1 pµA (being expected to reach values of ≥10 pµA under optimum operational conditions) impinging on a 0.6 mg/cm2target the current of the secondary beam at the focal plane will be 1·104 pps with an energy of 9.3 MeV. Out of this isobaric beam and according to a calculated cross section of 3 mb, a rate of 7·103nuclei per second will correspond to215Ac.
The low energy of the secondary beam makes it difficult to stop the beam in the center of the gas cell and hence extract it efficiently as most of the energy is lost in the entrance window. An ultra-thin Mylar window of 0.8 µm thickness (with double-grid support) in combination with a pressure in the gas cell of 300 mbar will stop the ions after traveling a distance of 9 mm in the gas. From this position, the ions will be transported by the gas flow towards the exit hole without extra losses due to the diffusion of atoms to the walls.
Assuming a lower-limit total efficiency of 4% and taking into consideration the transmission through the grids array, a total number of 220215Ac nuclei per second will reach the measuring station.
Production of254No
The isotope 254No will be produced in the fusion reaction of 1 pµA of48Ca impinging on a 208Pb target. After mass selection by S3 (∆m/m∼ 300) an isobaric beam of ∼50 pps, out of which 11 will be of 254No, will enter through the gas-cell entrance window with an average energy of 35 MeV.
Since atomic transitions are unknown for most of the elements in this region a pressure-broadening effect might be beneficial in the first experiments to find suitable excitation schemes. A Mylar window of 3 µm thickness and a pressure of argon buffer gas of 500 mbar will stop
1 2 3 4 5 6 7 8 9 10 11 12 13 14 15 16 17 18 19 20 21 22 23 24 25 26 27 28 29 30 31 32 33 34 35 36 37 38 39 40 41 42 43 44 45 46 47 48 49 50 51 52 53 54 55
Table 2: Summary of the main results obtained for the three reaction products (first column) taken as model to study the performance of the IGLIS@S3
setup. In the second and third columns the rate at the Focal Plane (FP) for the species of interest and the total current, including contaminants, are respectively given. The range in the argon buffer gas of the reaction products, the steady-state plasma density, and the time needed for neutralization are listed in the forth, fifth and sixth columns, respectively. In the last column the expected rate for the species of interest is given taking into account a current of the primary beam of 1 pµA and a lower limit overall efficiency of the system (see Tab. 1).
Reaction Rate@FP Itot.@FP Range ρplasmaa τrec. Rate@Detec.
(pps) (pps) (mm) (cm−3) (ms) (pps) 58Ni(40Ca, p3n)94 Ag 45 2·106 14 2·108 5 1.5 197Au(22Ne, 4n)215 Ac 7·103 1·104 9 1.3·107 70 220 208Pb(48Ca, 2n)254 No 11 50 16 1.2·106 700 0.3 a
Assuming a recombination coefficient in argon of 10−6cm3
s−1.
the ions at an optimum distance of about 16 mm from the window. With this distance traveled through the gas the value for the plasma density in equilibrium amounts to 1.2·106pairs/cm3, which results in a long recombination time constant of 700 ms. For this case, the creation of extra charges, as mentioned above, will be necessary to increase the otherwise low-neutralization efficiency. Notice that for this case, and many isotopes in the super-heavy mass region, decay losses are insignificant (254No(t1/2) = 51 s). Taking into account the overall efficiency of 4% and a transmission through the window grid of 80%, a count rate of about 20254No nuclei per minute will reach the decay station. By increasing the primary beam current up to the operational value expected of 10 pµA under optimum conditions of the facility, a count rate of ∼4 nuclei of254No per second could be reached that would allow laser spectroscopy studies on this superheavy nucleus.
5.3. Options for RIB purification
Owing to the strong suppression by S3 of the primary beam and the partial separation of isobaric contaminants, the total amount of ions entering the gas cell will be limited, enabling the use of electrical fields in the gas cell. This will increase the selectivity and will suppress the isobaric contamination to levels that allow proper identification and counting of the isotope of interest. However, despite the large primary beam rejection and mass resolving power provided by S3(∆m/m= 300-450 for the reactions considered in this article), for some nuclear reactions a significant contamination level will still be present at the measuring station. These species,
2 3 4 5 6 7 8 9 10 11 12 13 14 15 16 17 18 19 20 21 22 23 24 25 26 27 28 29 30 31 32 33 34 35 36 37 38 39 40 41 42 43 44 45 46 47 48 49 50 51 52 53 54 55
transported along with the photoions, will consist mainly of isobaric parasitic beams. Applica-tion of DC electric field prior to laser ionizaApplica-tion can suppress significantly these contaminants. However, as observed in experiments at LISOL, neutral species transparent to the DC electric fields can also be extracted along with the laser ions and get deposited on the rods of the ion guide [19]. Provided that these species undergo β decay, the resulting isobaric daughter-product can get confined in the RF pseudo-potential and be transported up to the detectors. For the production of tin at LISOL isobaric indium contamination resulted in 6% of the total resonance production. These parasitic beams that are transported to the detector along with the isotope of interest, reduce the signal-to-noise ratio, worsen the spectral resolution, and even can hamper the identification of laser-produced ions. For these reasons a beam-purification system must be included after laser ionization as part of the IGLIS setup at S3.
Quadrupole mass filter
An option to perform non-isobaric mass separation after laser ionization would be to use a Quadrupole Mass Filter (QMF) [48, 49] coupled to the RFQ ion guides. As for the latter, the QMF consists of four parallel rods spaced equidistantly but with the constraint that the ratio (r/r0) of the rod radius to that of the inscribed circle must be 1.148 [49] or between 1.125 and 1.127 [50] to assure the best approximation to the quadrupole field. Opposite pairs of rods are also electrically connected but unlike the RFQ, in the QMF direct current (DC) and alternating current (AC) electric fields are superimposed to achieve mass selection according to the ion’s mass to charge ratio. Implementation of the QMF after the differential pumping provided by the extraction RFQ would preserve the device under good vacuum conditions (< 10−5mbar) for optimum operation. Resolving powers m/δm= 50-150 were obtained using a QMF coupled to a RFQ ion guide system with a transmission efficiency of ≥50% [51], although with a significant increase of the transverse emittance as the mass-to-charge selectivity of the mass filter was raised [52].
Multi-reflector time-of-flight mass separator
A device like a Multi-Reflector Time-of-Flight (MR-ToF) mass separator [53, 54, 55] would be perfectly suited to get rid of isobaric contamination. In this device ion bunches are cyclically reflected between two electrostatic mirrors until the travel distance is such that the different mass components present in the bunch are spatially separated, owing to their different velocities, and can be discriminated by their time of flight. The ability to perform high-contaminant