HAL Id: hal-01331246
https://hal.archives-ouvertes.fr/hal-01331246
Submitted on 13 Jun 2016
HAL is a multi-disciplinary open access
archive for the deposit and dissemination of
sci-entific research documents, whether they are
pub-lished or not. The documents may come from
teaching and research institutions in France or
abroad, or from public or private research centers.
L’archive ouverte pluridisciplinaire HAL, est
destinée au dépôt et à la diffusion de documents
scientifiques de niveau recherche, publiés ou non,
émanant des établissements d’enseignement et de
recherche français ou étrangers, des laboratoires
publics ou privés.
Genetic diversity in Tetrachaetum elegans, a mitosporic
aquatic fungus.
Beryl Laitung, Eric Chauvet, Nicolas Feau, Katia Fève, Lounès Chikhi,
Monique Gardes
To cite this version:
Beryl Laitung, Eric Chauvet, Nicolas Feau, Katia Fève, Lounès Chikhi, et al.. Genetic diversity in
Tetrachaetum elegans, a mitosporic aquatic fungus.. Molecular Ecology, Wiley, 2004, vol. 13 (n° 6),
pp. 1679-1692. �10.1111/j.1365-294X.2004.02135.x�. �hal-01331246�
To link to this article : DOI : 10.1111/j.1365-294X.2004.02135.x
URL :
http://www.ncbi.nlm.nih.gov/pubmed/15140110
O
pen
A
rchive
T
OULOUSE
A
rchive
O
uverte (
OATAO
)
OATAO is an open access repository that collects the work of Toulouse researchers and
makes it freely available over the web where possible.
This is an author-deposited version published in :
http://oatao.univ-toulouse.fr/
Eprints ID : 9649
To cite this version :
Laitung, Beryl and Chauvet, Eric and Feau,
Nicolas and Fève, Katia and Chikhi, Lounès and Gardes, Monique
Genetic diversity in Tetrachaetum elegans, a mitosporic aquatic
fungus. (2004) Molecular Ecology, vol. 13 (n° 6). pp. 1679-1692.
ISSN 0962-1083
Any correspondence concerning this service should be sent to the repository
administrator:
staff-oatao@listes-diff.inp-toulouse.fr
Blackwell Publishing, Ltd.
Genetic diversity in
Tetrachaetum elegans
, a mitosporic
aquatic fungus
BERYL LAITUNG,*¶ ERIC CHAUVET,* NICOLAS FEAU,† KATIA FÈVE,‡ LOUNÈS CHIKHI§ and MONIQUE GARDES§
*UMR 5172 Laboratoire Dynamique de la Biodiversité, Centre National de la Recherche Scientifique, 29 rue Jeanne Marvig,
31055 Toulouse cedex 4, France, †Centre de Recherche en Biologie Forestière, Université Laval, Sainte-Foy (QC), Canada G1K 7P4,
‡Laboratoire de Génétique Cellulaire, Institut National de la Recherche Agronomique, BP 27, 31326 Castanet-Tolosan cedex,
France, §UMR 5174 Evolution et Diversité Biologique, Université Toulouse III — Paul Sabatier, 118 route de Narbonne, 31062
Toulouse cedex 4, France Abstract
Tetrachaetum elegans Ingold is a saprobic aquatic hyphomycete for which no sexual stage has yet been described. It occurs most commonly during the initial decay of tree leaves in temperate freshwater habitats and typically sporulates under water. Dispersal of the aquatic fungus takes place primarily in the water column and has a large passive component. Dif-ferences in substrate composition (e.g. quality of leaf litter) may also play a role in the dis-tribution of different species or genotypes. The population genetic structure of T. elegans
was studied using amplified fragment length polymorphism (AFLP) multilocus fingerprints. The populations were isolated from the leaf litter of three different tree genera, sampled in nine streams distributed throughout a mixed deciduous forest. Molecular markers were developed for 97 monosporic isolates using four selective primer pairs. A total of 247 fragments were scored, of which only 32 were polymorphic. Significant stream differentiation was detected for the isolates considered in this study. Analysis of molecular variance revealed that 20% of the genetic variation observed was the result of differences between streams. No correlation between genetic and geographical distances was found but a few multilocus genotypes were observed in different locations. Altogether these results suggest that environ-mental barriers play a role in the population structure of this aquatic fungus. No clear-cut effect of leaf litter composition on genetic variation could be demonstrated. Finally, tests of linkage disequilibrium between the 32 polymorphic AFLP loci as well as simulations did not provide a final answer regarding clonality in T. elegans. Indeed, it was possible to reject linkage equi-librium at different sampling levels and show that full linkage was unlikely.
Keywords: AFLP, aquatic hyphomycetes, Deuteromycota, dispersal, genetic diversity, population
structure
Introduction
A number of different groups of true fungi are present in freshwater and marine habitats, including parasites and decomposers (Alexopoulos et al. 1996). The aquatic
hypho-mycetes, or Ingoldian fungi, of which more than 300 species are known (Goh & Hyde 1996; Descals 1997), typically occur as saprophytes of leaf litter and wood fallen into running waters (Bärlocher 1992). Tetrachaetum elegans Ingold
is a world-wide species commonly encountered as an early coloniser of freshly fallen leaf litter in temperate streams (Webster & Descals 1981; Chauvet 1992; Suberkropp 1992; Gessner et al. 1993). Hyphomycete species are grouped in
the Deuteromycota (or fungi imperfecti) because they typically
reproduce asexually by means of mitotic spores called conidia. However, the absence of a known sexual stage is
Correspondence: Beryl Laitung. ¶Present address: Unité de Génétique et d’Amélioration des Plantes Fourragères, Institut National de la Recherche Agronomique, Centre de Recherche de Poitou-Charentes, Route de Saintes, 86600 Lusignan, France. Fax: + 33 549 556 044; E-mail: laitung@lusignan.inra.fr
not evidence for lack of genetic recombination. Life cycles of many fungi are poorly characterized because of the difficulty of directly assessing the reproductive modes of such cryptic micro-organisms in nature (Alexopoulos et al.
1996; Taylor et al. 1999). Less than 10% of conidial forms (i.e.
anamorphs) of aquatic hyphomycetes are currently connected to sexual forms (i.e. teleomorphs). The majority of the asso-ciated sexual forms belong to unrelated groups of true fungi, mainly Ascomycota and a few Basidiomycota (Webster 1992; Sivichai & Jones 2003).
Aquatic hyphomycetes produce considerable numbers of conidia, which can reach concentrations of 30 000 per litre (Webster & Descals 1981; Gessner et al. 1997). Most
species develop spores underwater, but some will also continue to sporulate on leaves or twigs exposed to air (Webster 1992). Taxonomic identification of T. elegans is
not difficult because this species produces large conidia (span > 200 µm) with a distinctive four-arm (tetraradiate) shape. After contact with, and attachment to, submerged plant material, the conidia germinate and the resulting mycelia rapidly penetrate the substratum and initiate decay. Conidia are important units of dispersal. Water flow continuously carries them downstream (Bärlocher 1992). Long-distance in-stream dispersal is common among aquatic hyphomycetes (Bärlocher 1992) and is viewed as a passive phenomenon that increases the chances that individuals will reach a substrate that is suitable for recruitment. Thus, for organisms such as aquatic hyphomycetes that typically inhabit streams for most of their life cycle, some genetic differentiation would be expected for populations from unconnected rivers, as has been described for macroinver-tebrates (e.g. Hughes et al. 1996) and fishes (e.g. Wenburg
et al. 1998). Such differentiation may be attributed to
lim-ited gene flow, random genetic drift and stream selection for particular alleles or genotypes (Monaghan et al. 2002).
However, information on geographical differentiation, dispersal and gene flow among populations is lacking for aquatic hyphomycetes, with the exception of one study by Peláez et al. (1996). These authors reported on the genetic
diversity of two Ingoldian species along a 1-km stream sec-tion using random amplified polymorphic DNA (RAPD) markers. Distant isolates shared the same RAPD patterns and genotypes appeared to be randomly distributed, which suggested the existence of a relatively uniform pool of geno-types in the section of stream that was studied.
Mosaics of distinctive hyphomycete species colonies and genotypes are often observed on single leaves (Shearer & Lane 1983; Charcosset & Gardes 1999; McArthur et al.
2001). It has been suggested that at early stages of decay, a leaf receives an imprint of the stream spores (Bärlocher & Schweizer 1983). However, beyond the initial colonization of a substrate, competitive as well as synergistic interac-tions between individual mycelia contribute to the patterns of diversity usually observed at various spatial scales, from
a single leaf to a given stream. The fact that species of aquatic hyphomycetes differ in their growth rates, life strategies and sporulation abilities lends support to this idea that such interactions between mycelia may play a role in determining species composition.
Preference towards a substratum is a controversial topic (Bärlocher 1992; Thomas et al. 1992; Gulis 2001). Ingoldian
fungi are considered to be generalists, colonizing a wide range of plant material including eucalyptus leaves and coniferous needles, which may contain high levels of tannins and other phenolics which potentially exhibit inhibitory effects (Bärlocher & Oertli 1978; Chauvet et al. 1997;
Suberkropp 1998; Bärlocher & Graça 2002). It has also been suggested, however, that naturally coexisting assemblages of species (and genotypes) may be the result of long-term evolutionary selection of clones adapted to specific sub-stratum characteristics, at least in some taxa (Gulis 2001). Thus, Charcosset & Gardes (1999) found two common RAPD phenotypes (out of 13) restricted to willow leaves in a study of genetic variation of T. elegans at a single site, although a
similar pattern in genotype distribution was not observed on leaves from other plant species. From these observa-tions, they suggested a possible selection of specialists for willow leaves. However, their study suffers from a limitation of the sampling procedure: all tested isolates were collected at one location during one sampling period. In addition, it is unclear whether the detected polymorphism truly reflects the genetic diversity of T. elegans at that site or was
the result of methodological limitations associated with RAPD markers (Ellsworth et al. 1993; Penner et al. 1993).
Amplified fragment length polymorphism (AFLP) markers are a more robust and powerful alternative to RAPD markers. This multilocus technique is reproducible and can detect similar or higher levels of polymorphism than the RAPD technique, with no requirement for prior knowledge of DNA sequences (Vos et al. 1995; Majer et al. 1996; Jones et al. 1997;
Mueller & Wolfenbarger 1999).
This study reports on the genetic diversity of 97 isolates
of T. elegans obtained from the leaves of three tree genera
and originating from nine woodland streams located within a deciduous forest in southwestern France. The clonal structure and population differentiation were investigated with respect to both geographical distance and leaf litter types and it was considered whether the paradigm of frequent long-distance gene flow by spores in an aquatic system is valid at this geographical scale.
Materials and methods
Population sampling and cultivation of fungal isolates
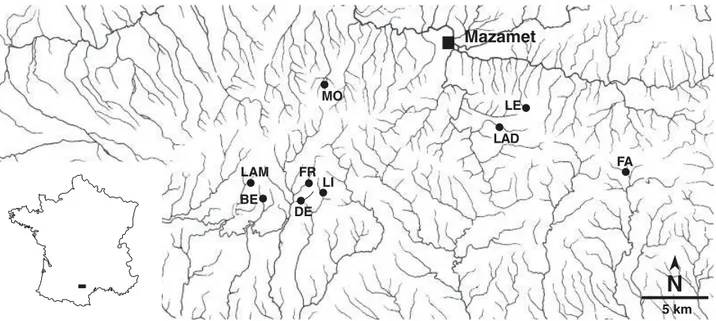
Tetrachaetum elegans isolates originated from nine similar
first-order streams located in a c. 1450-km2 mixed broadleaf
The streams drain independent watersheds, have low nutrient concentrations and are well oxygenated (Table 1). Streams are predominantly supplied with leaves and woody debris from oaks (Quercus robur L., Q. humilis Miller
ssp. humilis, Q. petraea Liebl.), beech (Fagus silvatica L.) and
hazel (Corylus avellana L.). The distance between any two
sampling sites ranged from 0.5 km (Dental and Fraïssègne) to 28 km (Fage and Lampy).
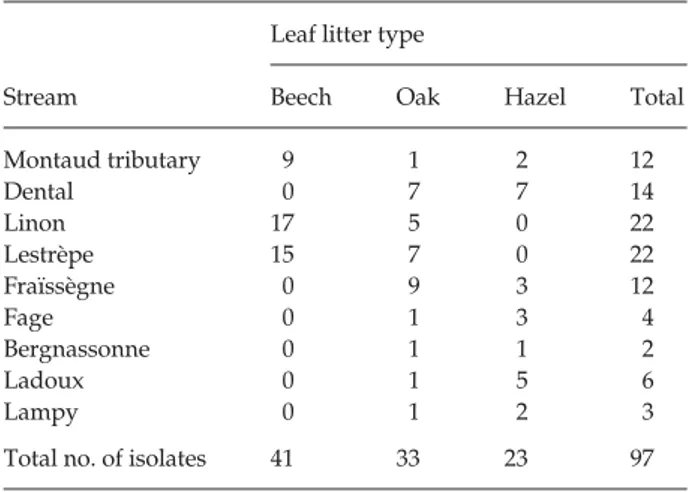
Leaves decomposing in the streams were collected in autumn 1998. Several leaves were collected from an area of a few square metres in each stream (Charcosset & Gardes 1999). Three types of leaf litter were sampled: beech, oak and hazel. In the laboratory, individual leaves from each stream and type of leaf litter were incubated in distilled water for 2 days at 15 °C to induce sporulation (Descals 1997). At least 10 single T. elegans conidia per stream were isolated from
different leaves under a dissecting microscope and grown on MEA medium with antibiotics (1 g/l malt extract, 20 g/ l agar, 90 µg/ml ampicillin and 150 µg/ml streptomycin sulphate), then transferred to 1% MEA medium. A total of 97 cultures were produced and submitted to AFLP analysis (Table 2). Differences in the number of isolates among the three types of litter reflect to some extent the composition of the riparian vegetation along each stream (Tables 1 and 2). To facilitate the removal of the mycelium from the culture medium, the cultures were transferred to a growth medium containing 20 g/l malt extract, 4 g/l Gel-Gro™ gellan gum and 510 mg/l MgSO4, 7 H2O (Doner & Bécard 1991).
DNA extraction
Before DNA extraction, the culture medium was solubilized with a sodium citrate solution (Doner & Bécard 1991) and
the mycelium fragments were transferred with forceps to 1.5 ml tubes containing 300 µl of 2× CTAB extraction buffer (Gardes & Bruns 1996). After three successive freeze–thaw cycles (65 °C), the mycelium was ground with a polypro-pylene micropestle and incubated at 65 °C for 1 h. Three microlitres of a proteinase K solution (10 mg/ml) was then
added and the mycelium was digested for 15 min at 37 °C. DNA was purified with phenol/chloroform (1 : 1, v/v) as described by Raeder & Broda (1985). Next, 300 µl of chloroform/isoamylalcohol (24 : 1, v/v) was added and the solution was emulsified and centrifuged for 15 min at 4 °C. The resultant aqueous phase was incubated with 10 µl RNaseA (20 mg/ml) at 37 °C for 10 min and extracted with an equal volume of chloroform/isoamylalcohol. The DNA was precipitated overnight from the aqueous phase by the addition of an equal volume of cold isopropanol at −20 °C. The pellet was washed with 70% ethanol and the DNA was redissolved in 40 µL of TE buffer (10 mm Tris– HCl, 1 mm ethylene diaminetetraacetic acid, pH 8.0). The DNA concentration was measured by a quantitative fluori-metric assay with the fluorochrome Hoechst 33258 (Labarca & Paigen 1980) using a DNA fluorometer TKO 100 (Hoefer Scientific Instruments).
AFLP analysis
AFLP analysis was performed according to Vos et al. (1995),
with the following modifications. Genomic DNA was restricted with MseI and EcoRI enzymes (New England
Biolabs Inc.), followed by ligation of appropriate adaptors to the restriction fragments. The DNA mixture was pre-amplified using MseI and EcoRI adapted-directed primers
(Gibco™). The preamplification products were then selectively
T ab le 1 Ph ys ic al a nd c he m ic al c ha ra ct er is ti cs a nd c om po si ti on o f t he d om in an t r ip ar ia n ve ge ta ti on o f t he s tu d y st re am s St re am C od e L at it ud e N L on gi tu d e E A lt it ud e a. s. l. (m ) W id th (m ) D ep th (m ) W at er te m p. ( ° C ) W at er p H R ip ar ia n ve ge ta ti on D en ta l D E 43 ° 24 ′ 34 ′′ 2 ° 14 ′ 11 ′′ 71 5 0. 8– 2 0. 05 –0 .2 2. 2– 16 .9 6. 0– 6. 8 Q u er cu s ro bu r, C or yl u s av el la n a, Q u er cu s pe tr ae a, F ag u s si lv at ic a Fr aï ss èg ne FR 43 ° 24 ′ 44 ′′ 2 ° 14 ′ 01 ′′ 70 5 0. 7– 1. 5 0. 05 –0 .2 0. 0– 20 .6 6. 1– 6. 8 Q . r ob u r, Q . p et ra ea , F . s il va ti ca , C . a ve ll an a M on ta ud tr ib ut ar y M O 43 ° 28 ′ 26 ′′ 2 ° 15 ′ 46 ′′ 58 0 1 –3 0. 1– 0. 2 3. 1– 18 .1 5. 9– 6. 9 F . s il va ti ca , C . a ve ll an a Fa ge FA 43 ° 25 ′ 00 ′′ 2 ° 32 ′ 05 ′′ 68 0 0. 6– 3 0. 05 –0 .3 3. 2– 16 .8 5. 7– 7. 0 F ra xi n u s ex ce ls io r, C . a ve ll an a, C as ta n ea s at iv a, F . s il va ti ca L in on L I 43 ° 24 ′ 48 ′′ 2 ° 15 ′ 23 ′′ 71 5 0. 6– 1. 5 0. 05 –0 .2 5. 4– 12 .6 6. 7– 7. 5 F . s il va ti ca L es tr èp e L E 43 ° 27 ′ 31 ′′ 2 ° 26 ′ 57 ′′ 87 0 0. 5– 1 0. 05 –0 .1 2. 5– 16 .1 5. 0– 6. 2 F . s il va ti ca , I le x aq u if ol iu m B er gn as so nn e B E 43 °2 4′ 39 ′′ 2° 11 ′5 9′ ′ 75 0 0. 8– 2 0. 05 –0 .2 3. 9– 16 .6 5. 6– 6. 0 F . s il va ti ca , Q . p et ra ea , I . a qu if ol iu m L ad ou x L A D 43 °2 6′ 67 ′′ 2° 24 ′6 6′ ′ 78 0 1 –3 0. 15 –0 .3 3. 2– 16 .0 5. 7– 6. 5 F . s il va ti ca , F r. e xc el si or , C . a ve ll an a L am py L A M 43 °2 5′ 00 ′′ 2° 32 ′0 5′ ′ 70 5 1 –3 0. 05 –0 .3 5 4. 0– 14 .6 5. 2– 6. 0 C . a ve ll an a, B et u la p u be sc en s, F . s il va ti ca , F r. e xc el si or , Q . p et ra ea W id th a nd d ep th r ef er to m ea su re m en ts o ve r a 50 -m r ea ch . W at er te m pe ra tu re r ef er s to c on ti nu ou s m ea su re m en ts o ve r 1 ye ar . W at er p H w as d et er m in ed b im on th ly o ve r 1 ye ar .
amplified using MseI and EcoRI primers (Gibco™) containing one selective nucleotide at their 3′-end; the EcoRI primer was end-labelled with selective fluorescent markers. For this study, 57 primer pair combinations were first tested on five isolates and the combinations that produced at least five polymorphic bands were selected. Four primer pair combinations (A/MseI-CA, A/MseI-CC, EcoRI-T/MseI-CA and EcoRI-T/MseI-CC; Promega) were selected on that criterion and used throughout the study. Selective polymerase chain reactions were performed with 5 µl (diluted five times) preamplification product, as in the preselective amplification procedure.
Fluorescently labelled amplified fragments were separ-ated on a 6% acrylamide gel containing 6 m urea. Electro-phoresis and data collections were performed on an ABI 373 DNA Sequencer (Perkin-Elmer Applied Biosystems Inc.). Raw data were edited with genescan Analysis Soft-ware, version 3.1 (Perkin-Elmer Corporation, 1998).
Reproducibility tests on AFLP bands
To test the reproducibility of the AFLP profiles, separate DNA extractions, polymerase chain reaction amplifications and AFLP analyses were performed as described above on a subsample of 20 isolates using the four primer combinations. In addition, to the protocol described above, protocol 2 of Redecker et al. (2001) was also followed to generate AFLP fingerprints on a subsample of 42 isolates (including some of the 20 isolates used previously) using two primer combinations. No differences in the AFLP profiles were detected in the duplicates.
Scoring procedures
The data for each primer combination were analysed using genescan Analysis Software, version 3.1 (Perkin-Elmer
Table 2 Number and origin of Tetrachaetum elegans isolates used
in AFLP analyses
Stream
Leaf litter type
Beech Oak Hazel Total
Montaud tributary 9 1 2 12 Dental 0 7 7 14 Linon 17 5 0 22 Lestrèpe 15 7 0 22 Fraïssègne 0 9 3 12 Fage 0 1 3 4 Bergnassonne 0 1 1 2 Ladoux 0 1 5 6 Lampy 0 1 2 3
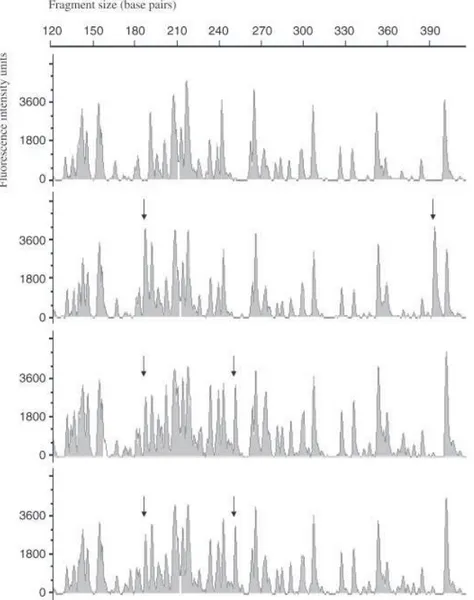
Corporation 1998). For haplotypic AFLP data, bands were considered putative loci, with absence or presence as alleles. Presence or absence of bands was scored manually in a reproducible size range (from 60 to 500 base pairs) and entered as 1 or 0, respectively, in a binary data matrix. Loci that did not show clear presence/absence patterns over the populations were excluded (Fig. 2) and this allowed the definition of 247 potential loci. Results were double scored and unclear bands for a few isolates were scored as missing data.
Intrapopulation variation
The number of genotypes was determined for each stream population. Each multilocus genotype was regarded as representing one individual (or genet) and the number of monosporic isolates per genet was calculated as a measure of clonal diversity. The arlequin software package, version
1.1 (Schneider et al. 2000) was used to calculate the average gene diversity (H ) estimates over loci.
A distance matrix of pairwise comparisons of individu-als was constructed using the binary data matrix, using the genetic distance of Nei & Li (1979). The matrices were used to construct a neighbour-joining tree with the software package treecon 1.4 (Van de Peer & De Wachter 1994). Bootstrap values were calculated as the number of boot-strap trees comprising a cluster of the same composition out of 100 bootstrapped trees.
Population differentiation
Unbiased minimum genetic distances of Nei (1978) were estimated between streams with sample size greater than 10. The matrix of pairwise distances between streams was used to construct a population phenogram using the upgma algorithm in the software package tfpga (Miller 1998).
Fig. 2 AFLPs electropherogram section of
four Tetrachaetum elegans isolates obtained with the primer pair EcoRI-A/MseI-CA. Arrows show the presence of polymorphic markers. For instance, the four individuals represented would be coded as 000, 101, 110 and 110, respectively.
Confidence levels on tree topology were estimated from the percentage of 1000 bootstraps.
The arlequin software package, version 1.1 (Schneider
et al. 2000) was used to calculate population pairwise FST
distances, gene flow (Nem) estimates and analyses of
molecular variance (amova). Pairwise FST distances (e.g. Slatkin 1995) were calculated between streams (FSTs) and subpopulations from leaf substrates (FSTl). amova was applied to infer proportions of variation within and between streams. The significance of variance components and FST values among populations were tested using 1000 per-mutations. To examine whether genetic differences had arisen as a result of geographical isolation, the correlation between the log10 of geographical distance and the log10 of
FSTs/(1 − FSTs) between all stream pairs was investigated
(Rousset 1997). Distances among samples were measured as the shortest distances between sampling sites on a 1/25 000 scale map. The significance of correlations was assessed using a Mantel test, with 1000 permutations, using the r package for Multivariate and Spatial Analysis, version 4.0 d5 (Casgrain & Legendre 2001).
A population-level assignment matrix was constructed with assignment calculator (Paetkau et al. 1995). In this matrix rows represent source populations and columns correspond to populations to which individuals are assigned.
Linkage disequilibrium
To test the clonality of T. elegans, it was decided to apply a series of tests using information on the statistical association between loci. Indeed, in a clonal species, loci would be expected to be transmitted together without recombination. This is expected to generate strong linkage disequilibrium between loci. The first test uses a multilocus index based on Fisher’s exact probability test on contingency tables of the observed haplotype frequencies (implemented in arlequin, version 1.1). The calculation is based on the distribution of allelic mismatches between pairs of genotypes over all loci. A detailed description of formulae and procedures is given in the software manual (Schneider et al. 2000). The second test used the Index of Association, IA, developed by Maynard Smith et al. (1993) to detect clonality in a number of bacteria and protozoa. IA can be calculated as: IA = VO/VE − 1, where
VO is the observed variance of K [where K = ∑(1 − ∑ ); pij being the frequency of the ith allele at the jth locus],
and VE is the expected variance of K. As can be seen from the formula, IA is expected to increase when there is departure from independence across loci. However, as was noted by Maynard Smith et al. (1993) under a number of simplifying assumptions, IA is also expected to increase linearly with the number of loci. Thus, absolute values of
IA are not directly comparable and a permutation approach
can be taken to detect departures from independence. Values
of IA differing significantly from zero indicate a departure from linkage equilibrium and may indicate, in some cases, that the organism is clonal (Maynard-Smith et al. 1993).
Results
Characteristics of AFLP markers
Only four of the 57 primer pair combinations tested on 20 isolates yielded more than five polymorphic bands among isolates (data not shown) and were subsequently selected to analyse the 97 isolates. Of the four primer pairs used, the AFLP primer pair MseI-A/EcoRI-CC generated the greatest number of polymorphic bands (Table 3). The mean number of reliable bands detected for each primer pair varied from 52 to 72, and bands ranged in size from 60 to 500 base pairs (Table 3).
Intrapopulation genetic and haplotypic diversity
Despite the use of the four most polymorphic primer combinations, the level of polymorphism was not very high. Among a total of 247 reproducible bands, only 32 (13%) were polymorphic (a locus was treated as polymorphic if the most common allele frequency was < 0.95). Average gene diversity (H ) was estimated with a mean value of 0.03 (SD 0.02; Table 4), based on the diversity of the revealed loci.
The polymorphic loci allowed the identification of 83– 89 genotypes among the 97 isolates (depending on whether genotypes differing only at missing single-locus genotypes were considered identical or not). Hence, between 86 and 91% of Tetrachaetum elegans isolates had different geno-types, indicating that almost every isolate was represented by one genotype (Table 4). This high percentage of distinct genotypes was observed in all streams (Table 4). The pres-ence of identical genets between streams was also found. For example, isolates 1012 (from Montaud) and 849 (from Fraïssègne), collected 7.2 km apart from each other, had the same genotype (clone B, observed four times alto-gether, Fig. 3).
pi2
Table 3 Polymorphism detected with four AFLP primer pairs in
97 Tetrachaetum elegans isolates originating from three leaf litter types (from three tree genera) and nine streams in the Montagne Noire (France) Primer pair No. of bands No. of poly- morphic bands % poly- morphism MseI-A/EcoRI-CA 69 8 11.6 MseI-T/EcoRI-CA 72 9 12.5 MseI-A/EcoRI-CC 54 10 18.5 MseI-T/EcoRI-CC 52 5 9.6 Total 247 32 12.9
Cluster analysis
Figure 3 displays the relationships among isolates in a dendrogram generated by neighbour-joining clustering based on Nei and Li’s similarity coefficients (Nei & Li 1979). The mean similarity between pairs of isolates was 0.64 (ranging from 0.24 to 1). The tree confirms the absence of any clear subpopulation structure among the 97 isolates of
T. elegans. Confidence estimates on the branching pattern
of the tree were generally poorly supported, with all bootstrap values being below 74%. Genotypes of isolates from different streams were grouped together in various clusters. The same pattern was observed among isolates from different types of leaf litter. In addition, isolates with identical AFLP phenotypes were occasionally, but not always, found from the same litter unit collected in a given stream. Thus, out of seven genets represented by more than one isolate (clones A, B, C, D, E, F and G with three, four, three, two, two, four and three isolates, respectively, Fig. 3), four were found in two and three streams, and five in two and three types of litter. Even for these isolates sharing the same genotype, genetic similarity was only weakly related to spatial proximity, and even less to leaf type.
Population differentiation
One band was fixed exclusively in a single population (Lestrèpe). AFLP analyses performed on the five stream populations with the largest numbers of isolates (n > 10) revealed a low level of polymorphism in all five streams, ranging from 7% in Dental (n = 14) to 11% in Lestrèpe (n = 22) (Table 4). Using amova it was found that the intrapopulation diversity component was around 80%, while the diversity between stream populations was 20%. Thus, the resulting significant FST value of 0.2 suggested large genetic differences between streams. An amova also showed that there was a significant effect of the litter type but with a much lower value (0.05 vs. 0.20, Table 5). These two tests are not independent, as Table 6 shows. Indeed, litters appear to be significantly different from each other only when litter-specific isolates come from different rivers. More complex modelling would be required to disentangle the litter and stream effects.
Values of pairwise FSTs (Table 7) indicated significant differences (P < 0.05) between the five streams with suffi-ciently large samples. The FSTs distances between streams
Table 4 Population variability estimates for 97 Tetrachaetum elegans isolates originating from three leaf litter types and nine streams in the
Montagne Noire (France)
Stream Sample size (n) No. of polymorphic loci % of polymorphism Average gene diversity over over loci (H ± SD) No. of genotypes G % genotype (G/N) MO 12 22 8.91 0.20 ± 0.12 11 91.7 DE 14 18 7.29 0.14 ± 0.8 13 92.8 LI 22 26 10.53 0.24 ± 0.13 20 90.9 LE 22 27 10.93 0.23 ± 0.12 19 86.4 FR 12 23 9.31 0.20 ± 0.11 12 100 FA 4 16 6.48 0.28 ± 0.14 4 100 BE 2 6 2.43 0.20 ± 0.22 2 100 LAM 3 11 4.45 0.23 ± 0.18 3 100 LAD 6 19 7.69 0.24 ± 0.15 5 83.3 All isolates 97 32 12.95 0.03 ± 0.02 83 85.6
Stream abbreviations are as in Table 1.
Table 5 Analysis of molecular variance for 32 AFLP loci assayed in Tetrachaetum elegans originating from three leaf litter types and nine
streams in the Montagne Noire (France)
Origin Source d.f. SS Variance Total variance (%) FST
Stream Among populations 8 85.1 0.75 19.8
Within populations 88 266.7 3.03 80.2 0.20**
Litter Among populations 2 19.1 0.99 5.2
Within populations 94 332.7 3.54 94.8 0.05**
Fig. 3 Neighbour-joining tree constructed for 97 isolates of Tetrachaetum elegans, using the genetic distance of Nei & Li (1979). Bootstrap values are given at the nodes. Isolates are referenced by strain number, stream and leaf-type origin. Seven genets (clones A to G) were represented by more than one isolate.
with low numbers of individuals were mostly not significant, most likely because of small sample sizes. The FST values indicate that the stream catchments in the Montagne Noire forest are highly differentiated and isolated from each other. This points towards the existence of a strong environmental barrier to genetic exchange and suggests that gene flow could only take place through rare events (Table 7).
The general pattern of population genetic structure was also illustrated by the assignment tests (Table 8). In the five streams where n > 10, a majority of individual multilocus genotypes could be reallocated to their population of origin (range from 54 to 68%). Several misassigned individuals were reallocated to popula-tions from geographically distant streams, confirming that despite a large FST value, no clear geographical pat-tern is detectable. Similarly, the population tree had low bootstrap values (between 69 and 79) and thus did not provide a clear picture of their relationships (not shown).
Finally, the relationship between log(FSTs/1 − FSTs) and the logarithm of the geographical distance for all stream population pairs was not significant (Mantel r = −0.083,
P = 0.30), indicating no distinct pattern of
isolation-by-distance at this geographical scale (Fig. 4).
Table 6 Pairwise population FSTl between substrate subpopulations from five streams
Stream Leaf litter type Code MOo MOb MOh DEo DEh LIh LIb LEo LEb FRo FRh
MO oak MOo — MO beech MOb −0.47 — MO hazel MOh −0.50 0.02 — DE oak DEo 0.42 0.26* 0.28 — DE hazel DEh 0.09 0.17* 0.12 −0.09 — LI oak LIh −0.24 0.17* 0.16 0.24* 0.16* — LI beech LIb −0.19 0.12* 0.19 0.27* 0.19* 0.06 — LE oak LEo 0.71 0.44* 0.55 0.36* 0.30* 0.30* 0.38* — LE beech LEb 0.07 0.18* 0.14 0.02 0.00 0.13* 0.19* 0.08 — FR oak FRo 0.21 0.20* 0.05 0.13* 0.15* 0.28* 0.30* 0.37* 0.17* — FR hazel FRh 0.00 0.16* −0.04 0.05 −0.03 0.14 0.20* 0.36 0.06 −0.05 —
Stream abbreviations are as in Table 1. *P < 0.05 (1000 permutations).
Table 7 Pairwise population FSTs (below diagonal) and corresponding Nem value (above diagonal) between streams
Stream MO DE LI LE FR FA BE LAM LAD
Montaud tributary — 1.44 3.37 1.73 2.01 2.28 1.52 3.32 2.31 Dental 0.26* — 1.72 8.89 2.84 4.74 1.57 3.15 1.13 Linon 0.13* 0.23* — 2.09 1.46 2.56 1.64 8.82 1.93 Lestrèpe 0.22* 0.05* 0.19* — 2.55 11.32 3.69 5.38 1.67 Fraïssègne 0.20* 0.15* 0.26* 0.16* — 6.07 — 5.66 5.39 Fage 0.18* 0.10 0.16* 0.04 0.08 — — 147.33 5.21 Bergnassonne 0.25* 0.24 0.23* 0.12 −0.03 −0.02 — 4.71 3.25 Lampy 0.13 0.14 0.05 0.09 0.08 0.00 0.10 — 7.10 Ladoux 0.18* 0.31* 0.21* 0.23* 0.08 0.09 0.13 0.07 —
Populations with the largest sample sizes (i.e. greater than 10, see text) are indicated in italics. Stream abbreviations are as in Table 1.
*P < 0.05 (1000 permutations).
Table 8 Results of the assignment analysis of 82 Tetrachaetum
elegans individuals Stream MO DE LI LE FR MO 7 0 1 1 3 DE 1 9 0 3 1 LI 0 6 15 0 1 LE 1 6 0 12 3 F 2 2 0 1 7
Stream abbreviations are as in Table 1.
The values in bold type represent possible migrants, i.e. the number of individuals sampled in the one stream (row) but assigned to another (column).
Linkage disequilibrium
Significant linkage (P < 0.05) was detected in 81 out of 465 comparisons (17.5%) over all the isolates of the five streams, which is 3.5 times more than expected by chance. Given that linkage disequilibrium is typically difficult to demonstrate with small sample sizes such as these (Lynch & Walsh 1998), this result points towards a large degree of linkage disequilibrium across the markers typed. The percentage of significant pairwise linkage disequilibrium was estimated in each stream to range from 3.5 to 22 (Table 9). The test of pairwise comparisons between putative AFLP loci showed significant linkage disequilibrium for 15% of loci pairs, while the index of association, IA, was significantly higher than expected under random association of alleles at different loci (P < 0.01). As both tests could be influenced by the existence of a substructure between samples (the equivalent of a Wahlund effect for multiple loci), IA was calculated and compared for isolates with a
sample size greater than 20. This calculation was not performed for the smallest samples because of the inherent lack of associated statistical power (Table 9). Overall, the results are very similar whether the subsamples or the whole data set were used. They allowed the null hypothesis of linkage equilibrium to be rejected and suggested that the linkage disequilibrium observed was indeed caused by a linkage between the loci and perhaps by either a lack or a limited level of recombination.
Discussion
Genetic diversity
Despite the expected sensitivity of the AFLP technique, only a limited amount of polymorphism could be revealed in the mitosporic species Tetrachaetum elegans. This confirms and extends the results of Charcosset & Gardes (1999), who used RAPDs on a more limited sampling scheme of the same species (one stream vs. nine streams here). The AFLP analysis in the present study resulted in 13% polymorphic fragments (32 out of the 247 scored), whereas the survey of Charcosset & Gardes (1999), using isolates from the same geographical location, gave a proportion of 21% (11 out of 52) polymorphic fragments. Of course, one could argue that it is difficult to compare levels of genetic diversity obtained with different markers. However, it should be noted that initially 53 primer pairs of the 57 tested were eliminated because of their low levels of polymorphism. A second piece of evidence for this low level of diversity in
T. elegans comes from a preliminary study on the genetic
diversity of another aquatic hyphomycete species,
Articulo-spora tetracladia Ingold, using the same AFLP protocol and
primers. In this study, five isolates of A. tetracladia, also collected in the Montagne Noire streams, exhibited a total of 208 polymorphic fragments out of 286 (73%) (B. Laitung, unpublished results). The basis for the difference in polymorphism between the two species is unknown, but may be related to either different effective population sizes
Fig. 4 Relationship between log10(FSTs/1 − FSTs) and log10 of the
geographical distance (km), Pearson correlation coefficient (r2) and significance of the correlation (P) using a Mantel test (1000 permutations) for pairwise comparisons of streams.
Table 9 Linkage disequilibrium tests in isolates of Tetrachaetum elegans
Stream (n > 10) MO DE LI LE FR All isolates All genotypes
No. of significant linkage 15 9 51 42 6 89 75
disequilibria (P < 0.05)
No. of polymorphic loci 19 14 22 27 19 32 32
Total number of 171 91 231 351 171 496 496
polymorphic loci pairs
% of pairwise linkage 8.77 9.89 22.08 11.97 3.51 17.94 15.12
disequilibrium
Index of association IA NA NA 1.72** 125** NA 0.81** 0.67**
Stream abbreviations are as in Table 1.
or perhaps to the reproductive modes of the two species, given that A. tetracladia has a known sexual stage.
Gene flow and isolation between sampling sites
Significant evidence was found for population differentiation of T. elegans among the different streams. Moreover, the amount of stream differentiation revealed by FST values was very high, given that samples were 0.5–18.5 km apart. On average, the variation among sampled streams accounted for 20% of all observed variation (Table 5), but no single band was strictly indicative of any one stream population.
Despite the high level of genetic differentiation observed, a few shared multilocus genotypes were found. Such geno-types could be the result of (i) shared ancestral polymorph-ism, (ii) newly created genotypes (by recombination, but see below), (iii) long-distance migrants. A two-step approach was used to assess the importance of these factors. In the first step, the probability of observing multilocus genotypes repeatedly by chance was estimated, assuming that loci were either (i) independent or (ii) fully linked. In the second step, data were simulated to determine how many unique genotypes are generated under assumptions (i) and (ii).
Under assumption (i), the probability of observing a par-ticular genotype is the product of genotype frequencies (say p0L1p1L2p0L3p0L4 for genotype 0100), where p0Li and p1Li are the frequencies of genotypes 0 and 1 at locus i, respectively. This gives a probability of 6.1 × 10⁻⁴ for the most probable
geno-type (represented by 11010101000011100000000000001010). This genotype was not observed in our data set. However, it differs at one locus only from clone D (represented by isolates 822 and 938), which had a probability of 5.9 × 10⁻⁴.
Clones A, B and F had a lower probability of occurrence (around 2 × 10⁻⁵), and other clones had even lower
prob-ability values (< 10−6). Thus, it appears that under
assump-tion (i), observing any of these genotypes more than once would be extremely rare (see below). If it were now assumed that all loci were linked [as in assumption (ii)], the probability of observing a particular genotype (i.e. a haplo-type) is simply its observed frequency (i.e. 4 × 10⁻² for
clone F). The repeated occurrence of some genotypes would therefore be higher than in case (i) (for example, in the order of 10−3 instead of 10−10 for clone F).
As a second step, 97 genotypes were simulated under assumptions (i) and (ii), and the number of unique geno-types was calculated for each simulated data set. This pro-duced two distributions against which the observed number of unique genotypes could be compared. Under assump-tion (i) the simulaassump-tions confirmed that it is extremely rare to observe any genotype more than once (only 4% of the simulations had one repeated genotype). Under assumption (ii) the opposite effect was observed: no simulated data
had more than 40 unique genotypes (and some genotypes could be observed up to seven times).
In conclusion, the observed data appear to have too few or too many repeated genotypes in comparison to the expected number under assumption (i) or (ii), respectively. The simulations suggest that gene flow might indeed explain the presence of some of the multiple occurrences such as clone F observed four times. However, recombina-tion or shared ancestral polymorphism cannot be totally rejected because the 32 loci were probably neither fully linked nor independent.
If gene flow occurs as the simulations suggest, it could be the result of aerial or animal dispersal. Indeed, it has been shown that during water turbulence, the conidia are exposed to the air and can occur in riparian environments (Sridhar & Kaveriappa 1987). Foam containing large amounts of spores is also frequently blown onto leaves lying adjacent to the stream (Bärlocher 1992). In addition to wind disper-sal, animals such as filter-feeding insects (Bärlocher 1981) or large animals (deers, wild boars, etc.) may also transport spores as well as mycelium of aquatic hyphomycetes within and between streams.
In addition to population differentiation and high FST values, it was also found that geographical and genetic distances were not correlated among populations. Thus, stream populations at the Montagne Noire forest scale appear to be relatively isolated subunits, perhaps linked by rare long-distance dispersal.
Substrate specificity and selection
A significant level of litter differentiation was found, but the FST value was much lower than the stream differentiation value and could not be separated from it without further modelling. The litter FST value could be explained by covariance of stream and litter types. No clear pattern of substrate specificity was found among the three types of leaf litter for the 97 isolates examined (Fig. 3). For instance, identical genotypes (despite being rare) were found on two or three tree species. Moreover, no significant differences were observed between litter subpopulations within each stream (Table 6). Altogether, this suggests that the litter effect, if real, is probably low. To quantify it, our results indicate that experimental manipulation, such as reciprocal litter transfer between streams, would be needed to separate clearly the litter from other environmental effects.
Conceivably, the distribution of aquatic hyphomycete species over a wide geographical area may promote broadly adapted genotypes with extended ecological toler-ance. Shearer & Lane (1983) found numerous species of aquatic hyphomycete developing on the same leaves. Sim-ilarly to Charcosset & Gardes (1999), this study identified, at the intraspecific level, a co-occurrence of colonies belonging to different genotypes of T. elegans on single
leaves (not shown). Intermingling of mycelia is pronounced most likely because of low inter- and intraspecific com-petition. However, our results, as explained above, do not confirm the hypothesis that selection was responsible for the occurrence of some haplotypes on the leaves of specific plants as suggested by Charcosset & Gardes (1999).
Linkage disequilibrium and clonality
Aquatic hyphomycetes are believed to reproduce clonally (Webster & Descals 1981), but this has never been demonstrated. In the present paper genetic data are pre-sented that suggest that linkage disequilibrium is unusually high in T. elegans. As noted above, and given our relatively limited sample sizes, the observation that on average 15% of tests are significant at the 5% level, is a strong indication that linkage disequilibrium is caused by linkage between the markers. Our results are thus in agreement with low levels of recombination. For instance, Maynard-Smith et al. (1993) suggested that significant IA values could be observed if differentiated samples were analysed together. They noted that in such cases IA values would not be significant for the subsamples. They showed that the high linkage disequilibrium values found in Rhizobium meliloti could actually be attributed to the existence of two genetically isolated divisions. Significant IA across all R. meliloti samples would become nonsignificant within each subdivision. Our results clearly show that IA values are significant for all populations analysed together and for the two populations with large sample sizes (Table 9). While IA absolute values cannot be directly compared across studies and species (the magnitude of IA is indeed dependent on the number of loci analysed), our results are qualitatively comparable to those for species such as Salmonella, for which clonality is likely if not demonstrated. While truly old asexual eukaryotic organisms have been shown to exist, for example in the bdelloid rotifers (Welch & Meselson 2000), the demonstra-tion of clonality in mitosporic fungi (thought to be asexual) has proven difficult. For instance, population studies on the reproductive mode of Cenococcum geophilum Fr., Coccidioides
immitis, or Aspergillus flavus, have all suggested some degree
of genetic exchange in the populations examined (Burt et al. 1996; Geiser et al. 1998; LoBuglio & Taylor 2002). Our simulations showed that under pure clonality, it would be expected to see fewer unique genotypes in T. elegans. Thus our results are in agreement with these studies and the case for clonality in T. elegans is far from being demonstrated. Significant levels of transitory linkage disequilibrium could have been generated by admixture and drift.
Conclusion and perspectives
For the first time it has been shown that within a limited geographical area, high levels of genetic differentiation can
be observed in an aquatic fungus. This differentiation is most likely the result of physical environmental barriers. The lack of correlation between geographical and genetic distances, together with the presence of multilocus genotypes at different locations, indicates that rare gene flow events might also occur. This could be attributed to the long-distance dispersal of fungal propagules (such as spores or mycelium). Future studies should be carried out under a more extensive sampling scheme including multiple sites along different connected and isolated rivers. Another way to address directly the dispersal issue would be to develop selective spore trapping experiments and molecu-lar genotyping methods that do not involve isolation and culturing steps. Regarding clonality, one possible way forward would be to investigate the correlation between linkage disequilibrium and physical distance between genetic markers. In the case of clonality, no correlation should be observed, whereas negative correlation would strongly suggest that recombination is actually taking place.
Acknowledgements
We would like to thank Mark O. Gessner, John W. Taylor, Wieland Meyer and Brigitte Crouau-Roy for providing helpful comments on earlier drafts of this paper. We also thank Martin Bidartondo, Dirk Redecker and Timothy Szaro for critical advice on the AFLP protocol and Hervé Gryta for help with the population genetic software. We are grateful to John W. Taylor and Frédérique Pitel for providing laboratory facilities. Funding was provided by the Programme ‘Dynamique de la Biodiversité et Environnement’ of the Centre National de la Recherche Scientifique to M. Gardes and E. Chauvet, by a travel grant to B. Laitung from the Université Toulouse III to visit John W. Taylor’s laboratory and by the French programme Groupement d’Intérêt Public — ECOsystèmes FORestiers to E. Chauvet. We finally thank the referees and J. Anderson for their constructive and helpful comments, which greatly helped us in clarifying the manuscript.
References
Alexopoulos CJ, Mims CW, Blackwell M (1996) Introductory
Mycology. John Wiley and Sons, New York.
Bärlocher F (1981) Fungi on the food and in the faeces of Gammarus
pulex. Transactions of the British Mycological Society, 76, 160–165.
Bärlocher F (1992) Recent developments in stream ecology and their relevance to aquatic mycology. In: The Ecology of Aquatic
Hyphomycetes (ed. Bärlocher F), pp. 16–32. Springer-Verlag, Berlin.
Bärlocher F, Oertli JJ (1978) Colonization of conifer needles by aquatic hyphomycetes. Canadian Journal of Botany, 56, 57–62. Bärlocher F, Schweizer M (1983) Effect of leaf size and decay rate
on colonization by aquatic hyphomycetes. Oikos, 41, 205–210. Bärlocher F, Graça MA (2002) Exotic riparian vegetation lowers
fungal diversity but not leaf decomposition in Portuguese streams. Freshwater Biology, 47, 1123–1136.
Burt A, Carter DA, Carter GL, White TJ, Taylor JW (1996) Molecular markers reveal cryptic sex in the human pathogen Coccidioides
immitis. Proceedings of the National Academy of Sciences of the USA,
Casgrain P, Legendre P (2001) The R Package for Multivariate and
Spatial Analysis, Users’ Manual, Version 4.0 D5. Département des
Sciences Biologiques, Université de Montréal, Montréal, http:// www.fas.umontreal.ca/BIOL/legendre/.
Charcosset J-Y, Gardes M (1999) Infraspecific genetic diversity and substrate preference in the aquatic hyphomycete
Tetrachae-tum elegans. Mycological Research, 100, 736–742.
Chauvet E (1992) Dynamique saisonnière des spores d’hyphomy-cètes aquatiques de quatre rivières. Nova Hedwigia, 54, 379–395. Chauvet E, Fabre E, Elósegui A, Pozo J (1997) The impact of euca-lyptus on the leaf-associated aquatic hyphomycetes in Spanish streams. Canadian Journal of Botany, 75, 880–887.
Descals E (1997) Ingoldian fungi: some field and laboratory techniques. Bolleti de la Societat d’Historia Natural de les Balears, 40, 169–221.
Doner LW, Bécard G (1991) Solubilization of gellan gels by chelation of cations. Biotechnology Techniques, 5, 25–28.
Ellsworth DL, Rittenhouse KD, Honeycutt RL (1993) Artifactual variation in randomly amplified polymorphic DNA banding patterns. Biotechniques, 14, 214–216.
Gardes M, Bruns TD (1996) ITS-RFLP matching for the identi-fication of fungi. In: Methods in Molecular Biology (ed. Clapp JP), pp. 177–186. Humana Press Inc., Towota, NJ.
Geiser DM, Pitt JI, Taylor JW (1998) Cryptic speciation and recombination in the aflatoxin-producing fungus Aspergillus
flavus. Proceedings of the National Academy of Sciences of the USA,
95, 388–393.
Gessner MO, Thomas M, Jean-Louis A-M, Chauvet E (1993) Stable successional patterns of aquatic hyphomycetes on leaves decay-ing in a summer cool stream. Mycological Research, 97, 163–172. Gessner MO, Suberkropp K, Chauvet E (1997) Decomposition of plant litter by fungi in marine and freshwater ecosystems. In:
The Mycota: a Comprehensive Treatise on Fungi as Experimental Systems
for Basic and Applied Research, Vol. IV: Environmental and Microbial
Relationships (eds Wicklow DT, Söderström B), pp. 303–322.
Springer-Verlag, Berlin.
Goh TK, Hyde KD (1996) Biodiversity of freshwater fungi. Journal
of Industrial Microbiology, 17, 328–345.
Gulis V (2001) Are there any substrate preferences in aquatic hyphomycetes? Mycological Research, 105, 1088–1093.
Hughes JM, Bunn SE, Hurwood DA, Choy S, Pearson RG (1996) Genetic differentiation among populations of Caridina zebra (Decapoda: Atyidae) in tropical rainforest streams, northern Australia. Freshwater Biology, 36, 289–296.
Jones N, Ougham H, Thomas H (1997) Markers and mapping: we are all geneticists now. New Phytologist, 137, 165–177.
Labarca C, Paigen K (1980) A simple, rapid, and sensitive DNA assay procedure. Analytical Biochemistry, 102, 344–352. LoBuglio KF, Taylor JW (2002) Recombination and genetic
dif-ferentiation in the mycorrhizal fungus Cenococcum geophilum Fr. Mycologia, 94, 772–780.
Lynch M, Walsh B (1998) Genetics and Analysis of Quantitative
Traits. Sinauer Associates, Sunderland MD.
Majer D, Mithen R, Lewis BG, Vos P, Oliver RP (1996) The use of AFLP fingerprinting for the detection of genetic variation in fungi. Mycological Research, 100, 1107–1111.
Maynard Smith JN, Smith NH, O’Rourke M, Spratt BG (1993) How clonal are bacteria? Proceedings of the National Academy of
Sciences of the USA, 90, 4384–4388.
McArthur FA, Bärlocher MO, MacLean NAB, Hiltz MD, Bärlocher F (2001) Methods in litter breakdown asking probing questions: can fluorescent in situ hybridization identify and
localise aquatic hyphomycetes on leaf litter? International Review
of Hydrobiology, 86, 429–438.
Miller MP (1998) Tools for Population Genetic Analysis. Northern Arizona State University, Flagstaff, AZ.
Monaghan MT, Spaak P, Robinson CT, Ward JV (2002) Population genetic structure of 3 alpine stream insects: influences of gene flow, demographics, and habitat fragmentation. Journal of the
North American Benthological Society, 21, 114–131.
Mueller UG, Wolfenbarger LL (1999) AFLP genotyping and fingerprinting. Trends in Ecology and Evolution, 14, 389–394. Nei M (1978) Estimation of heterozygosity and genetic distance
from a small number of individuals. Genetics, 89, 583–590. Nei M, Li WH (1979) Mathematical model for studying genetic
variation in terms of restriction endonucleases. Proceedings of the
National Academy of Sciences of the USA, 76, 5269–5273.
Paetkau D, Calvert W, Sterling I, Strobeck C (1995) Microsatellite analysis of population structure in Canadian polar bears.
Mole-cular Ecology, 4, 347–354.
Peláez F, Platas G, Collado J, Díez MT (1996) Infraspecific vari-ation in two species of aquatic hyphomycetes assessed by RAPD analysis. Mycological Research, 100, 831–837.
Penner GA, Bush A, Wise R et al. (1993) Reproducibility of random amplified polymorphic DNA (RAPD) analysis among laboratories.
PCR Methods and Applications, 2, 341–345.
Raeder U, Broda P (1985) Rapid preparation of DNA from fila-mentous fungi. Letters in Applied Microbiology, 1, 17–20. Redecker D, Szaro TM, Bowman RJ, Bruns TD (2001) Small genets
of Lactarius xanthogalactus, Russula cremoricolor and Amanita
francheti in late-stage ectomycorrhizal successions. Molecular
Ecology, 10, 1025–1034.
Rousset F (1997) Genetic differentiation and estimation of gene flow from F-statistics under isolation by distance. Genetics, 145, 1219–1228.
Schneider S, Roessli D, Excoffier L (2000) ARLEQUIN, Version 2.000:
a Software for Population Genetics Data Analysis. Genetics and
Biometry Laboratory, University of Geneva, Geneva. http:// lgb.unige.ch/arlequin/.
Shearer CA, Lane L (1983) Comparison of three techniques for the study of aquatic hyphomycete communities. Mycologia, 75, 498–508.
Sivichai S, Jones EGB (2003) Teleomorphic-anamorphic connections of freshwater fungi. In: Freshwater Mycology (eds Tsui CKM, Hyde KD), pp. 259–274. Fungal Diversity Press, Hong Kong. Slatkin M (1995) A measure of population subdivision based on
microsatellite allele frequencies. Genetics, 139, 457–462. Sridhar KR, Kaveriappa KM (1987) Occurrence and survival of
aquatic hyphomycetes under terrestrial conditions. Transactions
of the British Mycological Society, 89, 606–609.
Suberkropp K (1992) Aquatic hyphomycete communities. In: The
Fungal Community (eds Carroll GC, Wicklow DT), 2nd edn,
pp. 729–747. Marcel Dekker Inc., New-York.
Suberkropp K (1998) Microorganisms and organic matter decomposition. In: River Ecology and Management: Lessons from
the Pacific Coastal Ecoregion (eds Naiman RJ, Bilby RE), 1st edn,
pp. 120–143. Springer-Verlag, New-York.
Taylor JW, Jacobson DJ, Fisher MC (1999) The evolution of asexual fungi: reproduction, speciation and classification. Annual Review
of Phytopathology, 37, 197–246.
Thomas K, Chilvers GA, Norris RH (1992) Aquatic hyphomycetes from different substrates: substrate preference and seasonal occurrence. Australian Journal of Marine and Freshwater Research, 43, 491–509.
Van de Peer Y, De Wachter R (1994) treecon for Windows: a soft-ware package for construction and drawing of evolutionary trees for the Microsoft Windows environment. Computer Applications
in the Biosciences, 10, 569–570.
Vos P, Hogers R, Bleeker M et al. (1995) AFLP: a new technique for DNA fingerprinting. Nucleic Acids Research, 23, 4407– 4414.
Webster J (1992) Anamorph–teleomorph Relationships. In: The
Ecology of Aquatic Hyphomycetes (ed. Bärlocher F), pp. 99–115.
Springer-Verlag, Berlin.
Webster J, Descals E (1981) Morphology, distribution, and ecology of conidial fungi in freshwater habitats. In: Biology of the Conidial
Fungi, Vol. 1 (eds Cole GC, Kendrick B), pp. 295–355. Academic
Press, London.
Welch DM, Meselson M (2000) Evidence for the evolution of bdelloid rotifers without sexual reproduction or genetic exchange.
Science, 228, 1211–1215.
Wenburg JK, Bentzen P, Foote CJ (1998) Microsatellite analysis of genetic population structure in an endangered salmonid: the coastal cutthroat trout (Oncorhynchus clarki clarki). Molecular
Ecology, 7, 733–749.
This study is part of B. Laitung’s PhD thesis dealing with the structure of aquatic hyphomycete populations and communities in relation to riparian vegetation. Eric Chauvet is interested in the ecology of aquatic hyphomycetes, including the factors determining their diversity. N. Feau is a PhD student working on the genetic diversity of Septoria. K. Fève is an INRA research technician. L. Chikhi is interested in the application of population genetics theory to problems related to current and past population structures. Monique Gardes’ interests are fungal communities and populations with a special focus on ectomycorrhizal fungi.