OATAO is an open access repository that collects the work of Toulouse
researchers and makes it freely available over the web where possible
Any correspondence concerning this service should be sent
to the repository administrator:
[email protected]
This is an author’s version published in: http://oatao.univ-toulouse.fr/21859
To cite this version:
Ricaurte, Marvin and Torré, Jean-Philippe
and Asbai, Abdelhalim and Broseta, Daniel and
Dicharry, Christophe Experimental Data, Modeling, and Correlation of Carbon Dioxide
Solubility in Aqueous Solutions Containing Low Concentrations of Clathrate Hydrate
Promoters: Application to CO2–CH4 Gas Mixtures. (2012) Industrial & Engineering Chemistry
Research, 51 (7). 3157-3169. ISSN 0888-5885
Experimental Data, Modeling, and Correlation of Carbon Dioxide
Solubility in Aqueous Solutions Containing Low Concentrations of
Clathrate Hydrate Promoters: Application to CO
2
−CH
4
Gas Mixtures
Marvin Ricaurte, Jean-Philippe Torré,* Abdelhalim Asbai, Daniel Broseta, and Christophe Dicharry
Univ. Pau & Pays Adour, CNRS, TOTAL−UMR 5150−LFC R−Laboratoire des Fluides Complexes et leurs Réservoirs, BP 1155−PAU, F 64013, France
ABSTRACT: This study presents experimental and modeling data of solubility of carbon dioxide (CO2) in aqueous solutions that contain water soluble additives. Low concentration of tetrahydrofuran (THF) and sodium dodecyl sulfate (SDS), which are very commonly used additives in the field of clathrate hydrates research, have been considered here. A simple experimental method is proposed to determine the gas solubility. The measured data, in good agreement with those found in literature, allow developing a straightforward thermodynamic model and an easy to use engineering correlation for the determination of the apparent Henry constant, used to estimate the CO2solubility in aqueous solutions containing SDS, at different temperatures and
THF concentrations. Finally, as a practical application, experimental data and modeling results are compared regarding the equilibrium pressure and the gas composition obtained after solubilization of a typical CO2−CH4gas mixture.
1. INTRODUCTION
Solubility data of carbon dioxide (CO2) in aqueous solutions containing various types of soluble additives are of great interest in many scientific and technological area, e.g., in chemistry, petrophysics, geology, food industry, and environmental sciences. Particularly, the limitation of greenhouse gases release into the atmosphere requires intensive research efforts for both improving current gas separation techniques and developing new process solutions. Among the concepts which have been recently proposed to capture and separate carbon dioxide from various types of gas streams, the use of clathrate hydrates is presented as an attractive technology, potentially more advan tageous economically than conventional approaches.1 In this perspective, experimental data and/or accurate estimation of solubility of CO2 into aqueous solutions containing various
hydrate promoters are required in a broad range of temper atures and pressures.
Clathrate hydrates (hereafter simply called “hydrates”) are icelike solids composed of a lattice structure formed by a network of water molecules stabilized by hydrogen bonding, which, in the cavities formed by the water cages, can trap individual guest molecules of different natures and sizes. Numerous species, including for example, light hydrocarbons, acid gases (such as CO2or H2S), and organic compounds, can
act as guest substances to form hydrates of different structures, the most typical being the structure I (sI), structure II (sII), and structure H (sH).2In suitable conditions, hydrate crystals formed from a gas mixture are enriched with one of the components, leading to a possible way to develop a separation process for CO2 capture.3 Especially, this process could be
interesting for separating CO2from a natural gas stream and it
would be a cost attractive technology when the CO2must be reinjected in a geological formation (for example, Enhanced Oil Recovery (EOR) and/or CO2geological storage), since the gas
separation done under high pressure conditions may avoid a part of the gas recompression costs. However, although the
basic concept is attractive, further research efforts are necessary, particularly to improve hydrate formation kinetics and selec tivity of the separation, and to reduce the energy requirements.4
To make a hydrate based process usable for a practical application, these limitations could be overcome by means of appropriate water soluble additives. Among the various additives that have already been tested by different authors, sodium dodecyl sulfate (SDS) and tetrahydrofuran (THF) are of very common use. SDS is an anionic surfactant known to act as a powerful kinetic hydrate promoter, particularly for hydro carbon guests gases.5,6THF, which is a cyclic aliphatic ether, is one of the most well investigated guest species in the clathrate hydrate systems, because its addition to water must render hydrate formation possible under lower pressure and higher temperature conditions:7for this reason, THF is qualified as a thermodynamic hydrate promoter.8 However, the full miscibility of THF in water under ambient conditions hides the real complexity of this system. This highly nonideal mixture displays low temperature immiscibility and complex liquid phase behavior at high temperature.9 Interestingly, the association of these two additives (THF and SDS) seems to be a promising combination for hydrate formation from pure CO2and for a
typical CO2−CH4gas mixture, particularly in quiescent hydrate
formation conditions.10−12
However, although the solubility of carbon dioxide in pure water has been extensively studied by many authors13,14and for various aqueous solutions of organic compounds,15,16 very few data are available concerning CO2 solubility in aqueous solu
tions containing SDS.17−19 Concerning the CO2−THF−H2O
system, a few high pressure equilibrium data are available,20
but not for mixtures containing low concentrations of THF ([THF] < 10 wt %).
The acquisition of such solubility data is a prerequisite in hydrate based separation experiments and processes for determining the quantity of CO2 that is being trapped in
hydratesand, therefore, the hydrate selectivity toward CO2.
In these experiments, CO2 partitions into the three phases,
namely, the gas phase, the aqueous solution, and the hydrate phase; the quantity of CO2in the latter phase is deduced from
mass balance equations and a precise knowledge of its content in the gas and aqueous solution.
This paper presents a set of CO2solubility data in aqueous
solutions containing SDS ([SDS] = 0.3 wt %) and THF (0 wt %≤ [THF] ≤ 10 wt %) in the temperature interval 274 K≤ T ≤ 303 K and for operating pressures up to 4 MPa. These solubility data, which are presented in the form of apparent Henry’s constants, are inferred from a very simple experimental procedure. This procedure consists of loading the aqueous solutionhere, the H2O−THF−SDS systemand CO2 in a
closed vessel and then in monitoring the evolution of pressure when the temperature is varied. The two following sections (sections 2 and 3) present the experimental apparatuses and procedures, followed by the modeling strategy, which allows converting the measured pressures into apparent Henry’s con stants. In the“Results and Discussion” section, our experimental data are first compared to literature data for CO2 and pure
water. Then, the experimental data of density of water solutions containing THF are presented and used to build a density model usable in the solubility modeling. An easy to use engineering correlation for the apparent Henry constant (HCO2*) is then established to estimate the CO2 solubility in aqueous solutions
THF−SDS at different temperatures and THF concentrations. Finally, as a practical application, the final section illustrates an application of the correlation developed in the present work, using a CO2−CH4typical gas mixture where experimental data
and modeling results are compared regarding the equilibrium pressure and the gas composition obtained after solubilization.
2. EXPERIMENTAL SECTION
2.1. Materials Used. The additives used in this study are THF (purity >99.9%) and SDS (purity >98%), supplied by Sigma−Aldrich and Chem Lab, respectively. Gases used are carbon dioxide (purity >99.995%) from Linde Gas and a gas mixture containing CO2(75.02± 0.50 mol %) and CH4(24.98±
0.50 mol %) from Air Liquide. The aqueous solutions containing additives were prepared using an electronic balance (precision of ±0.001 mg), with ultrapure water (18.2 MΩ cm) produced in the laboratory, using a PureLab Classic from ELGA Labwater, France. 2.2. Experimental Apparatuses. The experimental apparatuses used in this study for solubility and density measurements are detailed in Figure 1.
The apparatus used to carry out the solubility measurements is presented in Figure 1A. The hydrate forming reactor consists of a titanium cylindrical vessel equipped with two see through sapphire windows (20 mm inside diameter), which allowed lighting and made visual observations inside the cell possi ble with a simple webcam (OptiaII camera from Creative Labs). The cell has a capacity of 168.0 cm3 and is designed to be operated at pressures up to 20 MPa. The solution inside the cell can be stirred by means of a magnetic agitator driven by a magnetic stirrer. The cell temperature is controlled by circulating through the cell jacket an aqueous solution of propylene glycol coming from a thermostatic bath (Polystat 37, Fischer Scientific) with a stability of ±0.02 K. The cell temperature is measured with two PT 100 probes immersed in the liquid phase and gas phase, respectively. The uncertainly of the temperature measurements is±0.1 K. The cell pressure is measured by a Keller Model PA23SY pressure transducer (0−10 MPa) with an accuracy of ±0.01 MPa. A high pressure storage tank is used to load gas (pure CO2or
CO2−CH4gas mixture) into the crystallizer cell. The composi tion of the gas phase is obtained using a gas chromatograph (Agilent, Model GC6980) equipped with a thermal con ductivity detector (TCD), and a high pressure valve system directly connected to the hydrate crystallizer cell is used to sample gas for GC measurements. Each gas sampling causes a negligible pressure drop in the cell (<0.001 MPa) and thus causes no perturbation to the system. The data acquisition is done using a PC and a LabView interface.
Density measurements have been carried out using a vibrating tube densimeter from Anton Paar (Models DMA HPM and mPDS 2000). A schematic diagram of the experi mental arrangement is presented in Figure 1B. The principle of the measurement, which can be done up to 473 K, is based on the evaluation of the natural frequency of a U shaped tube (also called the tuning fork) containing 2 cm3of the sample, excited in an undamped harmonic fashion. The entire system is regu lated by the circulation of silicone oil, using a thermostatic bath (Polystat 36 from Fisher Scientific). The temperature of the sample is measured with an accuracy of±0.01 K with a MKT50 Anton Paar thermometer equipped with a PT100 probe inserted in a thimble.
2.3. Experimental Methods. The principle of the solubility experiment is, for a given aqueous solution and gas phase, to measure in the closed high pressure cell the equilib rium pressure reached by the system at various controlled temperatures, knowing the initial quantity of aqueous solution and gas. The experimental procedure is the following:
The aqueous solutions at desired additive concentrations are prepared by first dissolving SDS in 50 cm3of ultrapure water while stirring during 5 min. The appropriate mass of THF is then added to the SDS solution while stirring again for 5 min, the total mass of the solution is adjusted to 200± 0.01 g with ultrapure water and stirred again during 5 min. Then, the high pressure cell is loaded with 65.0 ± 0.1 cm3 of the aqueous solution using glass pipettes. The cell is closed, connected to the rest of the equipment, and purged two times with the appropriate gas (pure CO2 or CO2−CH4 gas mixture) just
before pressurization. Figure 2 shows the variation with elapsed
time of the pressure and temperature inside of the cell during a typical solubility experiment carried out with pure CO2 and
water containing 0.3 wt % of SDS.
At the beginning of each experiment, the initial temperature is fixed at 303.0± 0.3 K and the cell is pressurized at 4.00 ± 0.05 MPa. As the measuring cell is a closed vessel, the initial quantity of gas(es) can be easily determined by using an equation of state (here, the Peng−Robinson equation of state (PR EoS)) with appropriate mixing rules,21as summarized in Appendix 1. One minute after pressurization, the temperature of the gas inside the reactor stabilizes again to the initial tem perature (303 K) and the agitator is started with a rotation speed set to 600 rpm. One can observe that the reactor pressure decreases quickly due to gas solubilization into the aqueous solution. It is noted that, under these conditions, the solubilization is almost done during the first 30 min. Then, the pressure and the temperature stabilize on a plateau which corresponds to the solubilization equilibrium (between the aqueous phase and the gas phase) at this temperature. The stir ring of the reactor is maintained during 2 h on each plateau to allow complete solubilization of the gas in the aqueous solution. At this point, the equilibrium pressure (Peq) is noted and then
the temperature is decreased to reach another equilibrium point.
Sequentially, the temperature is decreased with a cooling rate of 0.9 K/min by steps of 5 K from 303 to 283 K and by steps of 2.5 K from 283 to 274 K. For each temperature studied, the final pressure reached by the system was considered as the solu bilization equilibrium pressure. The experiments carried out with either (pure) water, or with a water + SDS solution, have never showed hydrate formation under the conditions tested in this study. When the aqueous solution contains THF, hydrates can form in the range of temperature studied, depending on the THF concentration. In that case, the temperature is decreased until hydrate formation occurs (which is easily detected both by a sudden increase of the liquid temperature and by visual obser vations though the reactor windows) and then the experiment is stopped. Note that temperatures below or equal to the temperature where hydrate formation occurs are not
considered in the solubility experiments. The observed trends of pressure and temperature recorded into the cell are similar in all experiments. For each condition tested, three independent experiments have been carried out. Each point represented in the following solubility figures (see Figures 3−6, presented later in this work), which corresponds to the average of three measurements and the error bars show the standard deviation.
The density of the aqueous phase was determined using the experimental protocol developed previously in our laboratory with similar equipment.22In short, the system is first calibrated with a double measurement of the vibration period of the tuning fork, at the desired temperature, first under vacuum conditions (at ∼10−8 MPa, obtained with a vacuum pump
connected at the system) and then with ultrapure water as the reference substance. The values of water densities used for calibration were taken from the literature.23 After the calibration was complete, ∼50 cm3 of sample is used for
rinsing. Finally, all the valves are closed, and the density measurement is done when both the temperature and the measured period are stable (temperature at±0.05 K from the temperature target and fluctuation of the period inferior to ±0.002 μs). For this study, all densities were measured at atmospheric pressure. The mean absolute error made on a density measurement, with respect to the temperature accuracy and the method precision, has been estimated at±0.05% with exactly the same equipment.24
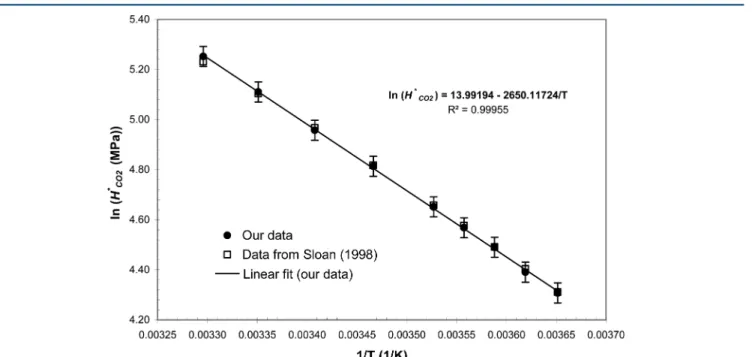
Figure 3.Henry’s constants for CO2in pure water at different temperatures (from T = 274 K to T = 303 K).
Figure 4.Evolution of CO2solubility in pure water and in a SDS aqueous solution during the first step of solubilization at 303 K. Initial and final
3. THERMODYNAMIC MODELING
In this section is presented the modeling strategy used to convert the raw experimental data, namely the measured two phase equilibrium pressures for each temperature (see previous section), into CO2 solubility data expressed in
terms of apparent Henry’s constants. The model developed here is only valid when no hydrate is present. For the final system investigated in this study (an aqueous solution containing low concentrations of THF and SDS in contact with a CO2−CH4gas mixture), this modeling has three main
objectives:
(i) to describe the solubilization process with a simple and realistic model which allows, giving pressure, volume, and temperature of the reactor as inputs (denoted P−V−T in the following), to predict the solubility of CO2 into water + additive(s) solutions at different
temperatures;
(ii) to build an easy to use (“engineering type”) correlation for the apparent Henry’s constant, depending on temperature and additive(s) concentration(s); and
(iii) to predict the equilibrium pressure and the final gas composition after solubilization of a CO2−CH4mixture
into water + additive(s) solutions knowing the initial cell loading conditions (P−V−T and gas composition), the final temperature, and the apparent Henry’s constant. At thermodynamic equilibrium, the fugacity of each componentand particularly of CO2is the same in the
vapor and liquid phases: =
fCOL ( ,P T) fCOV ( ,P T)
2 2 (1)
The CO2fugacity in the vapor phase is expressed as
= ϕ
fCOV ( ,P T) yCO P VCO
2 2 2 (2)
where yCO2 and φCOV 2 are the mole fraction and the fugacity
coefficient of CO2in the vapor phase, respectively. The CO2fugacity in the liquid phase is expressed as
= γ × − = * − ∞ ∞ ⎡ ⎣ ⎢ ⎢ ⎤ ⎦ ⎥ ⎥ ⎡ ⎣ ⎢ ⎢ ⎤ ⎦ ⎥ ⎥ f P T x H v RT P P x H v RT P P ( , ) exp ( ) exp ( ) L CO CO CO CO CO H Osat CO CO CO H Osat 2 2 2 2 2 2 2 2 2 2 (3)
where xCO2is the mole fraction of CO2is in the liquid phase,
γCO2and HCO2are, respectively, the activity coefficient for CO2
in the liquid phase and the Henry’s constant at temperature T, vCO2
∞the partial molar volume of CO
2in pure water at infinite
dilution and PH2Osat the vapor pressure of water at temperature
T. For simplicity, the CO2liquid fugacity expression has been
expressed using an apparent Henry’s constant, denoted HCO2*
in the following, such as HCO* 2 =γCO2HCO2.
The model is built with three main simplifying assumptions, which are expressed as follows:
(i) SDS, which is present in minute amounts in the aqueous phase, effectively accelerates the dissolution process under agitated conditions and does not modify the equilibrium properties, and particularly the amount of CO2 dissolved in the solution, as shown below
experimentally in the case of pure water in section 4.2 and Figure 4 (shown later in this paper). Therefore, the apparent Henry’s constant HCO* 2 is only dependent on temperature and THF concentration: HCO* 2 = HCO* 2(T,
[THF]);
(ii) The molar fraction of CO2in the gas phase, for the case of a CO2−CH4 gas mixture, is expressed by yCO2 =
(nCO2 V )/(n
CO2 V + n
CH4
V ), considering that the amount of
water and THF in the gas phase is negligible(yH2O= yTHF
≈ 0). To justify this premise, the theoretical gas com position has been calculated for the lower pressure and the higher temperature tested in this study, which maximize the amounts of H2O and THF in the gas
phase. The NRTL model,25 with binary interaction coefficients proposed by Matsuda et al.,26had been used at P = 2.0 MPa and T = 303 K with nitrogen as a noncondensable gas. The calculation was done for an
Figure 5. Density of water−THF solutions at P ≈ 0.1 MPa (atmospheric pressure) for [THF] ≤ 10 wt %: (a) comparison at 293 K of our experimental and modeling data to Kiyohara’s experimental data and ideal mixing model; and (b) our experimental and modeling data (symbols and full lines, respectively) at various THF concentrations and temperatures.
initial THF concentration in water equal to 10 wt %. The maximal mole fractions of THF and water in the gas phase are yTHF = 0.037 mol % and yH2O =
0.207 mol %, respectively. Thus, for the conditions tested in this study, it is a reasonable assumption to neglect the volatility of aqueous phase components in the gas.
(iii) The molar fraction of CO2in the liquid is expressed by
xCO2= nCO2 L /(n CO2 L + n H2O L + n THF
L ), considering that both
the solubility of CH4 and the amount of SDS in the liquid phase are negligible (xCH4 = xSDS ≈ 0). This
assumption is motivated by the fact that, in pure water, the solubility of CH4 is typically at least 1 order of
magnitude lower than the solubility of CO2.
27
In addition, Kalogerakis et al.28 found that the solubility of CH4 into water + SDS solutions is practically
unaffected by the presence of this surfactant used at
concentrations close to its critical micelle concentration (CMCSDSat normal P and T≈ 0.23 wt %
29
). Concerning the solubility of CH4 into water + THF solutions, no
reference was found in the literature.
For a CO2−CH4 mixture, by injecting eqs 2 and 3
in eq 1, the apparent Henry’s constant for CO2 is
expressed as * = ϕ − ∞ ⎛ ⎝ ⎜ ⎞ ⎠ ⎟ H y P x exp (P P ) V v RT CO CO CO CO H Osat 2 2 2 2 CO2 2 (4)
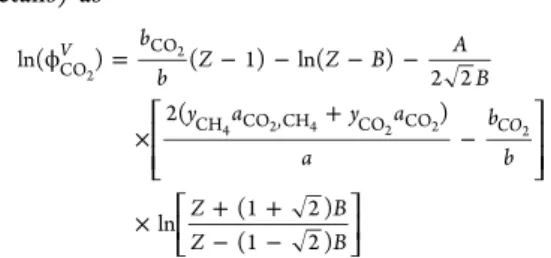
The fugacity coefficient of CO2(φCO2
V ) is expressed by
using the PR EoS and mixing rules (see Appendix 1 for
Figure 6.(a) Apparent Henry’s constant for CO2in THF−SDS aqueous solutions versus temperature; (b) CO2solubility in THF−SDS aqueous
solutions as function of THF concentration at different temperatures (additive concentrations are [SDS] = 0.3 wt % and [THF] from 0 to 10 wt %). Initial conditions are T = 303 K and P = 4.00 MPa.
details) as ϕ = − − − − × + − × + + − − ⎡ ⎣ ⎢ ⎢ ⎤ ⎦ ⎥ ⎥ ⎡ ⎣ ⎢ ⎤⎦⎥ b b Z Z B A B y a y a a b b Z B Z B ln( ) ( 1) ln( ) 2 2 2( ) ln (1 2 ) (1 2 ) V CO CO CO CH CO ,CH CO CO 2 2 4 2 4 2 2 2
where Z = Pvm/RT (with vmbeing the molar volume of the gas
phase), = + + a yCO2 aCO 2yCO CHy aCO ,CH yCH2 aCH 2 2 2 4 2 4 4 4 = + b yCO bCO yCH bCH 2 2 4 4 = − δ aCO ,CH (1 CO ,CH)aCO1/2aCH1/2 2 4 2 4 2 4
The binary interaction parameter was fixed to a constant value ofδCO2,CH4= 0.105 according to Lin,
30
and the values of yCO2and
yCH4are obtained directly via chromatography measurements.
The partial molar volume of CO2in pure water at infinite dilution
(vCO2
∞ ) was estimated in the entire range of temperature and pressure
of this study (274−303 K, and 1.0−4.0 MPa) using the Diamond’s model.13The arithmetic average gives vCO∞2 = 3.32× 10⁻⁵m3/mol
and this value was maintained as a constant in the calculations. The vapor pressure of pure water correlation is calculated as31
= − − + × − ⎡ ⎣⎢ ⎤ ⎦⎥ P T T T exp 73.649 7258.2 7.3037 ln( ) 4.17 10 H Osat 6 2 2
Finally, the remaining mass balance equations that are necessary to calculate all the other unknown variables, with respect to the different assumptions made above, are presented in eqs 5. CO2is present in both the liquid phase (denoted by superscript L) and vapor phase (superscript V), and all other constituents are present either in the liquid phase or in the vapor phase and the number of moles of each constituent (H2O, CO2, CH4, THF) remains constant and equal to its loading value (denoted by superscript“0”).
= + = = ρ = = = = − = + ⎧ ⎨ ⎪ ⎪ ⎪ ⎪ ⎪ ⎪⎪ ⎩ ⎪ ⎪ ⎪ ⎪ ⎪ ⎪ ⎪ n n n n n m v n n m M n n m M n n n [THF] 100 (100 [THF]) 100 V L V L L CO0 CO CO CH0 CH
sol0 sol sol
THF0 THF sol 0 THF H O0 H O sol 0 H O sol0 H O0 THF0 2 2 2 4 4 2 2 2 2 (5)
All parameters used in the model can be obtained easily (either constants found in literature or experimental values obtained during the solubility experiments), except the solution
density (ρsol), which is dependent on the temperature and composition of the liquid. As a predictive solubility correlation requires in input an additional equation for the solution density, a simplified density model (based on the experimental data obtained here) has been proposed in the following.
4. RESULTS AND DISCUSSION
4.1. CO2−H2O System. To test the validity of the approach
proposed above, the pure water−CO2binary system has been
examined first in the temperature interval of 274−303 K. The experimental data obtained from these experiments were used as input parameters for the modeling and allowed us to obtain a set of apparent Henry’s constants for CO2 (HCO* 2) at various temperatures.
Using the PR EoS, the initial number of CO2moles in the
gas phase was determined first and then, for each plateau of pressure reached at given temperature, the number of CO2
moles remaining in the gas phase was obtained. Therefore, the number of moles of CO2dissolved in the pure water was found
by difference, and the apparent Henry’s constant was calculated using eq 4. The apparent Henry’s constants for CO2in pure
water at different temperatures are shown in Figure 3. As can be observed, a linear correlation (R2 = 0.99955) is
obtained between the natural logarithm of the apparent Henry’s constant and the inverse of the temperature, indicating that, in the range of the experimental conditions tested here, the solubility of CO2 in pure water is very well represented with Henry’s law. In addition, our values of HCO* 2 are in very good
agreement with those calculated with the correlation proposed by Sloan in 1998.32 Thus, the fairly good match obtained between the two datasets allows validating and supporting the applicability of the proposed experimental and modeling approaches to determinate apparent Henry’s constants.
4.2. CO2−H2O−SDS System. Experiments were carried out
with aqueous solutions containing SDS in order to evaluate how this surfactant influences the CO2solubility. This point has been investigated at only one SDS concentration (0.3 wt %), because this amount of surfactant has proven to perform well with regard to enhancing CO2 enclathration kinetics in
quiescent hydrate forming conditions.11
Figure 4 compares the evolutions of CO2 solubility as a function of time during the first step of solubilization at 303 K for pure water into the 0.3 wt % SDS aqueous solution.
It is clearly visible that, in the first stage of the solubilization process (typically during the first 50 min), CO2 solubilizes faster in the solution containing SDS than in pure water. Thus, under agitated conditions, the kinetics of solubilization of CO2
is accelerated with the presence of SDS, compared to the case without SDS. However, at the solubility equilibrium (infinite time), the quantity of CO2transferred to the pure water and in the SDS aqueous solutions tends to the same value. Therefore, under agitated conditions, it can be concluded from our measurements that SDS plays only a role on the kinetics of solubilization. These results are consistent with those obtained by Farajzadeh et al.,17who studied the mass transfer of CO2
into water and into aqueous solution of SDS under quiescent conditions and those obtained by Kalogerakis et al.28 on a CH4−water−SDS system under agitated conditions and high SDS
concentration. Likely causes of this enhanced kinetics are 2 fold. First, the gas−liquid interfacial area increases upon the addition of SDS in water, simply because the size of bubbles formed in the aqueous solution decreases as the surface tension of the
solution decreases.33Second, the CO2transfer rate from gas to the water phase remains very high in the presence of SDS, as evidenced for instance from foam film permeability measure ments.34However, other studies18,19carried out with SDS and CTAB used at much higher concentrations (from 2.9 wt % to 11.5 wt %) that we used in our experiments, show that the CO2
solubility increases linearly with the surfactant concentration, indicating micellar solubilization. Similar to our results, Hanwright et al.35 concluded that water soluble surfactants (DTAB, in their case) have no measurable effect on the interfacial mass transfer through the gas/liquid interface for absorption or desorption of CO2 gas. They argued that the
surfactant concentration has a negligible effect and that the CO2solubility is essentially the same for the pure water case
when this surfactant is used in concentration close to its critical micelle concentration (CMC).
In addition, using the experimental apparatus described previously in Figure 1b, the density of an aqueous solution containing 0.3 wt % of SDS has been measured from 278 K to 303 K. The density of pure water was found (as expected) slightly inferior to the aqueous solution containing SDS in the entire range of temperature. However, the difference between the densities of pure water and the water + SDS solution being at maximum of 0.13% in the range of temperature evaluated, the impact of the SDS on density has been considered negligible. Accordingly, the SDS will not be introduced in the solution density model used as an input of the solubility model.
Therefore, because SDS plays a role only in the kinetics of solubilization under agitated conditions and has a negligible effect of the solution density at SDS concentration considered in this study, it has been decided that both the thermodynamic and the solution density models presented in this work would not take into account the presence of SDS.
4.3. CO2−H2O−THF−SDS System. As an input of the
solubility model, densities of solutions containing various concentrations of THF (0 wt % < [THF] ≤ 10 wt %) have been measured experimentally from 278 K to 303 K. As shown in the previous section (section 4.2), the presence of SDS at the concentration used in this study has a negligible impact on the density of the solution. The model used to correlate the density of the solution as a function of THF concentration and temperature is inspired from the literature.36,37The modeling is presented by eqs 6−8.
ρsol= ρe( )T + B1[THF]+B2[THF]2 + B3[THF]3 (6)
whereρe(T) is the water density, [THF] is the concentration of
THF (in wt %), T (in K), and
= + + +
B Ti( ) ei f Ti g Ti 2 h Ti 3 (7)
The water densityρe(T) has been modeled using a correlation
proposed by Takana et al.38 This correlation is valid from 273 K≤ T ≤ 313 K and P = 0.1 MPa and gives deviations to former water density tables obtained in this temperature range of <1 ppm.39 Excellent agreement is also obtained with the experimental used as input for the density experiments.23 In this simplified model, the increase of solution density due to pressurization and CO2solubilization has been neglected.
ρ = × − − + × − + × − + ⎪ ⎪ ⎪ ⎪ ⎧ ⎨ ⎩ ⎫ ⎬ ⎭ T a T a T a a T a ( ) 1 [( 273.15) ] ( 273.15 ) ( 273.15 ) e 5 1 2 2 3 4 (8)
with ρe(T (in g/cm3), T (in K), a
1 = −3.983035 °C, a2 =
301.797 °C, a3 = 522528.9°C2, a4= 69.34881 °C, and a5 =
0.99997495 g/cm3.
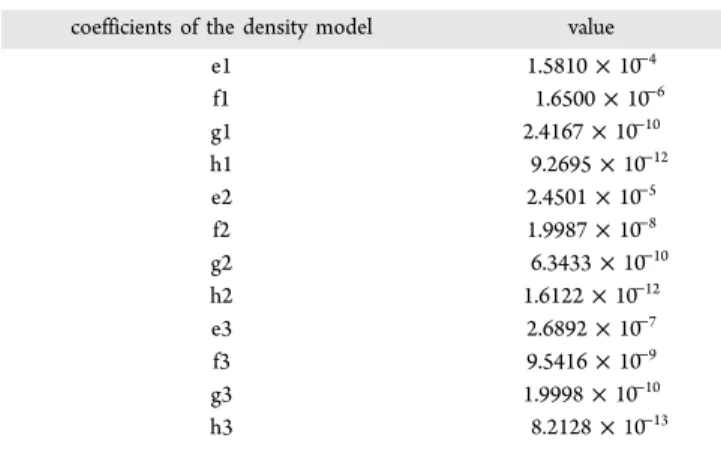
The density model parameters, listed in Table 1, were obtained by multicriteria optimization based on least squares method to fit the model to the experimental data.
Figure 5a compares our data (experimental and modeled) with those of Kiyohara40 at 293 K. The validity of our measurements is illustrated by the good agreement obtained between the two experimental datasets. As shown in Figure 5a, it is noted that an important deviation is obtained, even at low THF concentrations, when an ideal mixing model is considered to calculate the solution density. This result was expected as the THF−water system is known to be strongly nonideal at higher THF concentration.41In the temperature−composition plane, Matous et al.42showed that the regions of high temperature highlight the existence of a closed loop region of limited miscibility where two liquid phases are present (lower critical temperature of 345.0± 0.15 K at 53.5 wt % THF and the upper critical temperature of 410.2± 0.15 K at 48 wt % THF). This miscibility gap can be explained by the presence of complex temperature dependence of the activity coefficient of THF, which increases and then decreases with temperature.43 The complexity is even greater when CO2is added to the water−
THF system as the addition of modest amounts of CO2signif
icantly decreases the temperature in which water and THF forms two liquid phases,20 confirming that CO2 interact
strongly with the THF−H2O system. Concerning the results
presented in the following, the presence of a second liquid phase was not detected visually in the range of THF concentrations and temperatures investigated.
In the range of THF concentrations from 0 to 10 wt % and from 278 K to 303 K, Figure 5b plots our experimental and modeled data together. It is clear that the model matches the experimental data fairly well. Therefore, the good agreement obtained allows using this density model as an input parameter in the solubility modeling.
Figure 6 shows the values of apparent Henry’s constant and of CO2solubility in THF−SDS aqueous solutions at different temperatures and THF concentrations, where each exper imental point of this figure corresponds to the equilibrium pressure reached by the system when solubilization is complete. In the entire range of THF concentrations tested in this study, it is observed in Figure 6a that the natural logarithm of ap parent Henry’s constant varies linearly with the inverse of temperature, denoting that (similar to the CO2−water system)
Table 1. Coefficients of the Model of Solution Density
coefficients of the density model value
e1 1.5810× 10⁻⁴ f1 1.6500× 10⁻⁶ g1 2.4167× 10⁻¹⁰ h1 9.2695× 10⁻¹² e2 2.4501× 10⁻⁵ f2 1.9987× 10⁻⁸ g2 6.3433× 10⁻¹⁰ h2 1.6122× 10⁻¹² e3 2.6892× 10⁻⁷ f3 9.5416× 10⁻⁹ g3 1.9998× 10⁻¹⁰ h3 8.2128× 10⁻¹³
the CO2solubility in THF−SDS aqueous solutions can be well represented with Henry’s law. As shown in Figure 6a and more clearly in Figure 6b, CO2 solubility in liquid phase decreases
with increasing the temperature at the same THF concen tration. In addition, when THF concentration is increased the apparent Henry’s constant is reduced giving evidence of a higher solubilization of CO2 in the solution. This result was expected as pure THF is known to solubilize high amounts of CO2.44 Thus, the presence of THF in the aqueous solution increases the solubility of CO2and this effect is proportional to
the quantity of THF.
It is important to note in Figures 6a and 6b that, above 3 wt % THF and for temperatures below 284 K, hydrate(s) formation occurs within the reactor, making it impossible to determine the solubility of CO2in the liquid phase in these conditions. The liquid−solid equilibrium of the THF−water system has been largely studied in the literature. Water and THF form a stoichiometric (sII) hydrate composed of 19.07 wt % THF (formula: THF·17H2O), which melts incongruently at 278 K
and where THF molecules occupy only the larges cages of this stucture (hexacaidecahedron cavities). For further details of the liquid−solid phase diagram, the reader is invited to consult refs 9, 45, and 46 for hydrate equilibria under high pressures. When CO2 is added to the water−THF system, the solid−
liquid equilibrium is largely modified by the formation of a mixed CO2+ THF hydrate where the CO2molecules partially
occupy the remaining cavities (small cages) of the (sII) THF hydrate.47 For details on the three and four phase hydrate equilibria of the CO2−THF−H2O system, see ref 48. As shown by Delahaye et al.,8the formation pressure of a mixed THF + CO2 hydrate is significantly reduced, compared to
the single CO2hydrate, confirming our observations during
the CO2 solubility experiments with THF−SDS aqueous
solutions.
The experimental values of apparent Henry’s constants of CO2 in THF−SDS aqueous solutions obtained in this study were used to build a solubility correlation, depending on the temperature and the concentration of THF. Figure 7 shows a three dimensional (3D) plot of apparent Henry’s constants of
CO2in THF−SDS aqueous solutions, as a function of temperature and THF concentration.
As mentioned previously, the apparent Henry’s constants increase when temperature increases and THF concentration decreases. In the range of experimental parameters tested in this study, it is shown that the effect of temperature on the apparent Henry’s constant is higher than the concentration of THF. The model has been adjusted to a surface and fitted using the least squares method. Among the various equations which can fit the experimental data, the equation proposed is a product of a quadratic term dependent on the mass concentration of THF and a term proportional to exponential of 1/T, which has a real physical sense regarding the form of Henry’s law. Our correlation is expressed in eq 9. Note that the general form of this equation is in agreement with those proposed previously by others, e.g., by Saha et al.,49who have estimated fairly well the solubility of N2O into aqueous solutions of 2 amino 2 methyl 1 propanol. The coefficient of correlation (R2) and the average absolute deviation (AAD)
between our experimental data and our model are 0.992 and 1.7%, respectively. * = + + ⎜⎛ ⎟ ⎝ ⎞ ⎠ H a b c d T ( [THF] [THF] ) exp CO2 2 (9) where a = 1.525× 10⁶, b =−2.410 × 10⁴, c =−7.044 × 10², and d =−2.718 × 10³.
Equation 9 is valid in the range of temperature and THF concentrations of 278 K≤ T ≤ 303 K and 0 wt % < [THF] ≤ 10 wt %, respectively. Without THF, CO2 solubility in pure water can be measured until water freezes. Under these conditions (without THF), this correlation can be extended to a temperature just above the freezing point of water. Note that the density model used in the modeling is valid from 273 K to 313 K. Accordingly, we have chosen to define the lower limit of temperature of eq 9 to 274 K and the extended model has been tested against the CO2 solubility data in pure water from
Diamond and Akinfiev13and Duan and Sun.50Theses authors have developed models applicable in a wide range of temper ature and pressures (from 271.5 K to 373 K and from 0.1 MPa to 100 MPa for Diamond’s model; from 273 K to 533 K and
from 0 MPa to 200 MPa for Duan’s model). For both models, executable routines (freewares) can easily be found on the Internet. Table 2 compares the results obtained with our model to the models of Diamond and Duan.
The results obtained with our modeling with [THF] = 0 wt % are in very good agreement with the predictions of the two others models. Diamond’s model, which has been built by the compilation of 362 chosen experimental data, reproduces the accepted experimental solubilities with a precision of better than 2.0% over the entire P−T−x range considered. As the AAD (absolute averaged deviation) of our solubility predic tions, compared to those obtained by the two other models, remains inferior to 2.5%, our modeling reproduces the solubility of CO2 in pure water very well and can be used
with [THF] = 0 with good confidence.
Thus, eq 10 extends eq 9 to T = 274 K for [THF] = 0 wt % and can be written as
* = + + ≤ ≤ = ≤ ≤ < ≤ ⎜ ⎟ ⎧ ⎨ ⎪ ⎪ ⎩ ⎪ ⎪ ⎛ ⎝ ⎞ ⎠ H a b c d T T T ( [THF] [THF] ) exp 274 K 303 K for [THF] 0 278 K 303 K for 0 [THF] 10 wt % CO2 2 (10) with a = 1.525× 10⁶, b =−2.410 × 10⁴, c =−7.044 × 10², and d =−2.718 × 10³. This easy to use engineering correlation can
be used for the determination of apparent Henry’s constant to
estimate the CO2solubility in THF−SDS aqueous solutions at
different temperatures, within an AAD between our experimental data (108 experiments) and our modeling inferior to 1.7%.
4.4. Application to CO2−CH4Gas Mixtures. In order to
verify the applicability of the CO2solubility model developed
in this study under the determination of CO2 solubility in
THF−SDS aqueous solutions, we have chosen to test the solubility model with a CH4−CO2typical gas mixture. To carry
out solubility experiments, a CO2−CH4mixture of typical com
position of 75−25 (mol %) has been used. In regions where no hydrate formation occurs, experimental data and modeling results were compared, with regard to the equilibrium pressure and the gas phase composition achieved after solubilization, for different temperatures and THF concentrations.
As can be observed in Figure 8, there is an almost perfect match between the equilibrium pressure obtained during the experiments and the values obtained using our thermodynamic model over the range of THF concentrations and temperatures considered.
In these experiments, the composition of the gas phase has been measured by chromatography analysis and the results are summarized in Table 3.
Similarly, an almost perfect match (ADD = 0.6%) is obtained between the experimental and modeled values, regardless of the THF concentration and temperature considered. The good predictions obtained with this model validate our modeling strategy where the solubility of CH4in the aqueous phase was
Table 2. Prediction of the CO2Solubility in Pure Water with Different Models: Our Correlation (eq 9) with [THF] = 0 wt %,
Diamond’s Model and Duan’s Model
CO2Solubility (mol %) temperature (K) pressure (MPa) our model Diamond model AD (%) Duan model AD (%) 303 4.0 1.601 1.693 5.4 1.644 2.6 3.5 1.451 1.534 5.4 1.490 2.6 3.0 1.288 1.361 5.3 1.322 2.6 2.5 1.111 1.172 5.2 1.140 2.5 2.0 0.920 0.969 5.0 0.943 2.5 1.5 0.713 0.749 4.9 0.731 2.5 1.0 0.492 0.515 4.4 0.504 2.3 298 4.0 1.827 1.886 3.1 1.824 0.2 3.5 1.661 1.715 3.1 1.656 0.3 3.0 1.477 1.525 3.2 1.473 0.3 2.5 1.276 1.317 3.1 1.273 0.2 2.0 1.058 1.091 3.0 1.056 0.2 1.5 0.822 0.846 2.9 0.820 0.2 1.0 0.568 0.583 2.5 0.566 0.4 293 4.0 2.095 2.116 1.0 2.037 2.8 3.5 1.908 1.931 1.2 1.855 2.9 3.0 1.701 1.723 1.3 1.653 2.9 2.5 1.473 1.493 1.4 1.432 2.9 2.0 1.223 1.240 1.4 1.190 2.8 1.5 0.952 0.965 1.3 0.927 2.7 1.0 0.658 0.666 1.2 0.641 2.7 288 4.0 2.410 2.390 0.8 2.356 2.3 3.5 2.201 2.190 0.5 2.151 2.3 3.0 1.967 1.963 0.2 1.923 2.3 2.5 1.707 1.708 0.0 1.670 2.2 2.0 1.421 1.424 0.2 1.392 2.1 CO2Solubility (mol %) temperature (K) pressure (MPa) our model Diamond model AD (%) Duan model AD (%) 1.5 1.108 1.111 0.3 1.087 2.0 1.0 0.767 0.769 0.2 0.754 1.8 283 4.0 2.785 2.715 2.6 2.702 3.1 3.5 2.551 2.502 2.0 2.475 3.1 3.0 2.285 2.254 1.4 2.219 3.0 2.5 1.988 1.970 0.9 1.932 2.9 2.0 1.659 1.650 0.5 1.615 2.7 1.5 1.296 1.293 0.2 1.264 2.5 1.0 0.900 0.898 0.2 0.879 2.3 278 4.0 3.231 3.082 4.8 3.5 2.970 2.872 3.4 3.0 2.669 2.606 2.4 2.5 2.328 2.293 1.5 2.0 1.947 1.932 0.7 1.897 2.6 1.5 1.524 1.522 0.2 1.489 2.4 1.0 1.060 1.062 0.2 1.039 2.1 274 4.0 3.440 3.258 5.6 3.5 3.365 3.212 4.8 3.0 3.032 2.936 3.3 2.5 2.651 2.602 1.9 2.0 2.221 2.207 0.7 1.5 1.743 1.748 0.3 1.0 1.214 1.226 0.9 1.198 1.3 AAD (%) 2.2 2.1
(31) Perry, R.; Green, W. Perry’s Chemical Engineering Handbook; McGraw−Hill: New York, 1999.
(32) Sloan, E. D. Clathrate Hydrates of Natural Gases, 2nd ed.; Marcel Dekker: New York, 1998.
(33) Chen, H. W.; Ku, Y.; Lin, S. Y.; Chang, C. Y. Effect of Sodium Dodecyl Sulfate (SDS) on Bubble Characteristics and Ozone Transfer in a Bubble Column. J. Chin. Inst. Chem. Eng. 2007, 30, 155−161.
(34) Farajzadeh, R.; Muruganathan, R. M.; Rossen, W. R.; Krastev, R. Effect of Gas Type on Foam Film Permeability and its Implications for Foam Flow in Porous Media. Adv. Colloid Interfaces 2011, 168, 71−78. (35) Hanwright, J.; Zhou, J.; Evans, G. M.; Galvin, K. P. Influence of Surfactant on Gas Bubble Stability. Langmuir 2005, 21, 4912−4920.
(36) Chen, L. F.; Soriano, A. N.; Li, M. H. Vapour Pressures and Densities of the Mixed Solvent Desiccants (Glycols + Water + Salts). J. Chem. Thermodyn. 2009, 41, 724−730.
(37) Novotny, P; Söhnel, O. Densities of Binary Aqueous Solutions of 306 Inorganic Substances. J. Chem. Eng. Data 1988, 33, 49−55.
(38) Tanaka, M.; Girard, G.; Davis, R.; Peuto, A.; Bignell, N. Recommended Table for the Density of Water between 0 and 40°C based on Recent Experimental Reports. Metrologia 2001, 38, 301−309. (39) Wolf, H.; Bettin, H.; Gluschko, A. Density of Pure Liquid Water at Normal Pressure Measured at the ppm level. In Proceedings of ICPWS XV, Berlin, September 8−11, 2008.
(40) Kiyohara, O.; D’Arcy, P. J.; Benson, G. C. Thermal Expansivities of Water + Tetrahydrofuran Mixtures at 298.15 K. Can. J. Chem. 1978, 56, 2803−2807.
(41) Belandria, V.; Mohammadi, A. H.; Richon, D. Volumetric Properties of the (Tetrahydrofuran + Water) and (Tetra n butyl Ammonium Bromide + Water) Systems: Experimental Measurements and Correlations. J. Chem. Thermodyn. 2009, 41, 1382−1386.
(42) Matous, J.; Hrncirik, J.; Novak, J. P.; Sobr, J. Liquid−Liquid Equilibrium in the System Water−Tetrahydrofuran. Czech. Chem. Commun. 1970, 35, 1904−1905.
(43) Gmehling, J.; Krentscher, B. The Excess Enthalpy of Tetrahydrofuran (Oxolane) + Water, a Binary Liquid Mixture with Closed Limiting Miscibility Curve, below (343.15 K), between (383.15 K), and above (416.29 K) the Consolute Temperatures. Int. Electron. J. Phys. Chem. Data 1995, 1, 291−296.
(44) Gennaro, A.; Isse, A. A.; Vianello, E. Solubility and Electrochemical Determination of CO2 in Some Dipolar Aprotic
Solvents. J. Electroanal. Chem. 1990, 289, 203−215.
(45) Anderson, R.; Chapoy, A.; Tohidi., B. Phase Relations and Binary Clathrate Hydrate Formation in the System H2−THF−H2O.
Langmuir 2007, 23, 3440−3444.
(46) Manakov, A. Y.; Goryainov, S. V.; Kurnosov, A. V.; Likhacheva, A. Y.; Dyadin, Y. A.; Larionov, E. G. Clathrate Nature of the High Pressure Tetrahydrofuran Hydrate Phase and Some New Data on the Phase Diagram of the Tetrahydrofuran−Water System at Pressures up to 3 GPa. J. Phys. Chem. B 2003, 107, 7861−7866.
(47) Martinez, M. C; Dalmazzone, D.; Fürst, W.; Delahaye, A.; Fournaison, L. Thermodynamic Properties of THF + CO2Hydrates in
Relation with Refrigeration Applications. AIChE J. 2008, 54 (4), 1088−1095.
(48) Sabil, K. M.; Witkamp, G. J.; Peters, C. J. Phase Equilibria in Ternary (Carbon Dioxide + Tetrahydrofuran + Water) System in Hydrate Forming Region: Effects of Carbon Dioxide Concentration and the Occurrence of Pseudo Retrograde Hydrate Phenomenon. J. Chem. Thermodyn. 2010, 42, 8−16.
(49) Saha, A. K.; Bandyopadhyay, S. S.; Biswas, A. K. Solubility and Diffusivity of N2O and CO2 in Aqueous Solutions of 2 Amino
2 methyl 1 propanol. J. Chem. Eng. Data 1993, 38, 78−82.
(50) Duan, Z.; Sun, R. An Improved Model Calculating CO2
Solubility in Pure Water and Aqueous NaCl Solutions from 273 to 533 K and from 0 to 2000 bar. Chem. Geol. 2003, 193, 257−271.