POLYTECHNIQUE MONTRÉAL
affiliée à l’Université de Montréal
Effect of Regrind Content on PP-EVOH Sheets Properties and
Effect of Orientation on Permeability of EVOH Multilayer Films
LILI WANG
Département de génie chimique
Mémoire présenté en vue de l’obtention du diplôme de Maîtrise ès sciences appliquées Génie chimique
Août 2019
POLYTECHNIQUE MONTRÉAL
affiliée à l’Université de Montréal
Ce mémoire intitulé :
Effect of Regrind Content on PP-EVOH Sheets Properties and
Effect of Orientation on Permeability of EVOH Multilayer Films
présenté par Lili WANG
en vue de l’obtention du diplôme de Maîtrise ès sciences appliquées a été dûment accepté par le jury d’examen constitué de :
Gregory PATIENCE, président
Abdellah AJJI, membre et directeur de recherche
Ebrahim JALALI DIL, membre et codirecteur de recherche Amir SAFFAR, membre
ACKNOWLEDGEMENTS
Firstly, I would like to express my sincere gratitude to my supervisor, Pro. Abdellah Ajji. It is my honour to work with this professor of wisdom who gives me supports not only in the project research but also in my master study life. I have gone through some difficulties during these two years, but Professor Ajji always showed his trust to encourage me with patience.
Secondly, my sincere thanks are also shown to my co-supervisor, Dr Ebrahim Jalali Dil. He always helped me with practical solutions and useful advice when I encountered problems. His abundant knowledge and brilliant charism inspired me to be a better one.
Thirdly, I really appreciate the technical support from my colleagues: Ms Claire Cerclé helped me a lot in film characterisation; Mr Richard Silverwood guided me patiently in film preparation; Mr Redouane Boutrouka gave me helpful suggestions and technical support; Mr Matthieu Gauthier provided me with training at the start of my project; Ms Fatma Ben Dhieb offered me kind assistance in film orientation; Dr Galyna Shul and Mr Jean-Philippe Masse gave me technical support in XRD.
Many thanks to all of my colleagues who always cared for me and encouraged me.
I also need to offer my gratitude to all of my friends who companied me all the time; special thanks go to Mr Bohao Ning and Ms Léa Montégut who answered my request of translating the abstract into French without hesitation as usual. Bohao and his partner gave me many valuable moments in my master’s studying period.
Also, many thanks go to Ms Salima Adrar, Mr Shuyang Zhang, Mr Luc Michéa and Ms Endy Usen. Salima and Richard helped me check the French translation carefully and professionally. Shuyang is always there whenever I need his suggestions, and he can always give me effective solutions when I have some questions. Luc and Endy assisted me at checking and polishing some parts of this thesis even though they were busy.
Lastly, from the bottom of my heart, I would like to say thank you to my beloved parents and my boyfriend. They gave me the strength to face the difficulties in my life, and they also offered their pure and sincere love to me all the time. There are not enough words to show my appreciation to them; they are my treasures and the ones I will love forever.
RÉSUMÉ
Les emballages alimentaires jouent un rôle clé dans la fraîcheur et la conservation des aliments. Une des fonctions principales des emballages alimentaires est d’empêcher le passage de l’oxygène à travers l’emballage. Ainsi, il est nécessaire d’utiliser des matériaux hautement étanches à l’oxygène pour cet usage. Parmi les différents polymères, Le copolymère éthylène-alcool vinylique (EVOH) a une perméabilité très faible à l’oxygène, c’est pourquoi il est largement utilisé pour les emballages hautement étanches. Cependant, EVOH est sensible à l’humidité et coûteux. Des films multicouches sont utilisés pour diminuer les coûts, et EVOH est habituellement inséré entre deux couches résistantes à l’humidité. L’objectif de ce projet de recherche est de déterminer des méthodes pour réduire les coûts liés à l’EVOH dans les films multicouches.
La première partie de ce mémoire est dédiée à une revue de littérature. Tout d’abord, l’importance et les contraintes des emballages alimentaires sont présentés, incluant leurs propriétés barrières, mécaniques, thermiques et optiques. La section suivante de la revue de littérature discute les aspects importants de l’utilisation d’EVOH, incluant sa cristallisation, ses bonnes propriétés d’étanchéité à l’oxygène, sa sensibilité à l’humidité. De précédentes études concernant les limitations de l’EVOH ainsi que des applications d’emballages multicouches à base d’EVOH sont revues. L’originalité et les objectifs de ce projet de recherche sont aussi présentés à la fin de la revue de littérature.
Le chapitre 3 présente les méthodes expérimentales, résultats et propose une discussion sur les effets de l’ajout de matière rebroyée sur les propriétés finales des structures à trois couches PP/matière rebroyée/PP. Les matériaux rebroyée utilisée dans cette partie est matériaux recyclée post-industrielle (RPI) qui contient de l’EVOH, du PP et materiaux liants (PP-g-MA). Dans l’intervalle 10 % - 40 % de matériaux rebroyés, la transmission d’oxygène, les propriétés thermiques et les propriétés mécaniques ont été testées pour comparer les propriétés obtenues pour différentes proportions. Le procédé de thermoformage a ensuite été utilisé pour déterminer les différences entre des films produits avec différentes proportions de matériaux rebroyés. Les résultats obtenus montrent que, jusqu’à une proportion massique de 40 %, l’ajout de matières rebroyées n’a pas d’effet majeur sur les propriétés mécaniques et la perméabilité à l’oxygène. Dans une troisième partie, les effets de l’orientation de l’EVOH sur la perméabilité à l’oxygène dans les films multicouches ont été étudiés. Des films multicouches avec différents taux de
gonflement (BUR = 1 et 3) ont été préparés suivant le procédé de gonflement de film puis étirés à la vitesse de 50 mm/min à 100°C. La relation entre l’orientation de l’EVOH et la perméabilité à l’oxygène dans les films multicouches, intérêt principal de notre recherche, a été démontrée par l’analyse détaillée de tests de perméabilité ainsi que par spectroscopie infrarouge à transformée de Fourier (FTIR). La microscopie électronique à balayage (SEM) a été employée pour déterminer la variation d’épaisseur du film avant et après étirement. Les techniques de diffraction à rayons X à grand angle (WAXD) et d’analyse calorimétrique différentielle (DSC) ont aussi été utilisées pour étudier l’effet de l’étirement sur la structure cristalline et la cristallinité de l’EVOH. Les propriétés de barrière à l’oxygène du film BUR = 3 après étirement ont été significativement améliorées, alors que l’étirement a provoqué une amélioration mineure pour le film BUR = 1. Les résultats obtenus sont discutés en détails à la fin de la section, et une attention particulière a été portée aux effets de l’étirement sur l’orientation et la structure cristalline.
ABSTRACT
Food Packaging keeps food fresh and extends shelf life. One of the most important functions of food packaging is preventing oxygen transmission through the package. Therefore, it is necessary to use high oxygen barrier materials in food packaging. Among different polymers, Ethylene vinyl alcohol (EVOH) has a very low oxygen permeability and is widely used in high barrier packaging, however, EVOH is an expensive material and sensitive to moisture. Multilayer films are used to decrease the cost and EVOH is usually sandwiched between two moisture barrier layers. The objective of this research was to find the ways to decrease the cost of multilayer films.
This thesis begins with reviewing literature. Firstly, the importance and requirements of food packaging, including barrier properties, mechanical properties, thermal properties and optical properties are introduced. The next section in the literature review discusses important aspects of EVOH including its crystallization, nature of good oxygen barrier properties and its moisture sensitivity. Previous studies on EVOH drawbacks and some applications of EVOH multilayer packages are also reviewed. Originality and objectives of this research are presented at the end of literature review.
Chapter 3 presents the experimental methods, results and discussion on examining effects of regrind content on the final properties of three-layer sheets with PP/regrind/PP structures. Regrind materials used in this part were Post Industrial Recycled (PIR) materials, containing EVOH, PP and tie materials (PP-g-MA). At the range of 10%-40% regrind materials, the oxygen transmission, thermal properties and mechanical properties were tested to see the differences in properties with different regrind material proportions. The thermoforming process was then used to determine the differences of producing process with different regrind material proportions.
In the third part, the effect of EVOH orientation on the oxygen permeability in multilayer films was studied. Multilayer films with different blow-up ratios (1 and 3) were prepared using a film blowing process and then stretched at 50 mm/min and the temperature of 100℃ in the INSTRON machine. The relation between EVOH orientation and its oxygen permeability in multilayer films was the focus in this research that examined with the help of permeability test and Fourier transform infrared (FTIR) spectroscopy. Scanning electron microscopy (SEM) was used to determine the variation in the film thickness before and after stretching. Wide angle X-ray diffraction (WAXD) and differential scanning calorimetry (DSC) were also used to examine the effect of stretching on
crystalline structure and crystallinity of EVOH. The oxygen barrier properties of BUR=3 film after stretching were significantly improved while stretching slightly improved oxygen barrier properties of the films at blow-up ratio of 1. The obtained results were discussed in detail by considering the effect of stretching on orientation and crystalline structure.
TABLE OF CONTENTS
Acknowledgements ... iii
Résumé ... iv
Abstract ... vi
Table OF CONTENTS ... viii
List OF TABLES ... xi
List OF figures ... xii
List of symbols and abbreviations ... xiv
Chapter 1 Introduction ... 1
Chapter 2 LITERATURE REVIEW ... 3
2.1 Food packaging ... 3
2.1.1 The importance of food packaging ... 3
2.1.2 The requirements of food packaging ... 4
2.1.3 Common materials used in packaging ... 9
2.2 EVOH ... 10
2.2.1 What is EVOH ... 10
2.2.2 Crystallisation of EVOH ... 12
2.2.3 Good barrier properties ... 15
2.2.4 Moisture sensitivity ... 16
2.2.5 Solutions ... 18
2.3 Originality ... 21
2.4 Objectives ... 22
3.1 Experimental ... 24
3.1.1 Materials ... 24
3.1.2 Sheets preparation ... 24
3.1.3 Sheets characterisation ... 25
3.2 Results and discussion ... 27
3.2.1 Appearances ... 27 3.2.2 Thickness ... 27 3.2.3 The uniformity ... 29 3.2.4 Morphology ... 31 3.2.5 Thermal analysis ... 33 3.2.6 Oxygen transmission ... 35 3.2.7 Mechanical analysis ... 36 3.2.8 Thermoforming ... 38 3.3 Conclusions ... 40
Chapter 4 The effect of orientation on permeability of EVOH multilayer films ... 42
4.1 Introduction ... 42
4.2 Experimental ... 43
4.2.1 Materials ... 43
4.2.2 Films preparation ... 43
4.2.3 Films characterisation ... 45
4.3 Results and discussion ... 46
4.3.1 Thickness ... 46
4.3.2 Crystallinity ... 48
4.3.4 Crystal type ... 54
4.3.5 Oxygen transmission ... 57
4.4 Conclusions ... 58
Chapter 5 Conclusions and recommendations ... 59
5.1 Conclusions ... 59
5.1.1 The conclusions of the effect of regrind content on PP sheet properties ... 59
5.1.2 The conclusions of the effect of EVOH orientation on the oxygen permeability in multilayer films ... 60
5.2 Recommendations ... 60
LIST OF TABLES
Table 2.1 Effect of crystallinity on oxygen permeability of polymers ... 15
Table 2.2 Applications of flexible multilayer barrier structures incorporating EVOH layer ... 19
Table 2.3 Applications of rigid multilayer barrier structures incorporating EVOH layer ... 20
Table 3.1 Different extruder screw speeds to get different regrind material content ... 24
Table 3.2 Thickness of regrind layer and PP layer in seven groups ... 28
Table 3.3 Regrind materials proportion calculation results with different sheets position ... 30
Table 3.4 Melting temperature and heat fusion of EVOH and PP in seven groups ... 34
Table 3.5 Oxygen permeation of seven groups ... 35
Table 4.1 Parameters for films at BUR=1 and BUR=3 ... 44
Table 4.2 Thickness and DDR of BUR=1 film and BUR=3 film ... 48
Table 4.3 Crystallinity of EVOH in multilayer films before and after stretching ... 50
Table 4.4 The results of the orientation index of multilayer films before and after stretching ... 54
LIST OF FIGURES
Figure 1.1 Molecular structure of EVOH [2] ... 1 Figure 2.1 General mechanism of gas or vapour permeation through a plastic film or vapour permeation through a plastic film [9]. ... 4 Figure 2.2 Typical Water Vapour Transmission Rates of Regular Packaging Polymers [11] ... 5 Figure 2.3 Typical Oxygen Transmission Rates of Regular Packaging Polymers [11] ... 6 Figure 2.4 Measured permeability coefficients, P, in 10-17m2/(s·Pa) for various polymers and gases at 25-30℃ [17] ... 7 Figure 2.5 Permeability of polymers commonly used in packaging [24] ... 9 Figure 2.6 The process of EVOH synthesis [30] ... 11 Figure 2.7 Oxygen permeability and thickness normalised water vapour transmission (WVTR) as a function of ethylene content for EVOH copolymers. (Data from EVAL Americas) ... 12 Figure 2.8 Illustration of the transformation of the crystal structure of EVOH samples with different VA content [17] ... 13 Figure 2.9 EVOH pseudohexagonal crystal structure models of 0-73 mol.% ethylene content [3]
... 14 Figure 2.10 EVOH orthorhombic crystal structure models of 86 mol.% and 94 mol.% ethylene content [3] ... 14 Figure 2.11 Variation of the oxygen permeability (OTR: oxygen transmission rate) for
ethylene-vinyl alcohol copolymer, EVOH, as a function of ethylene unit content, xe ... 16
Figure 2.12 Equilibrium moisture absorption of EVOH at different RH [46] ... 17 Figure 2.13 Experimental and fitted values for O2TR of nonoriented EVOH film with 32 mol.%
ethylene content at 1 atm oxygen [48] ... 18 Figure 2.14 Illustration of a multilayer structure [4] ... 19 Figure 2.15 Schematic illustration of the permeability of a blend of a high-barrier material in a
Figure 3.1 The appearance of seven groups of sheets ... 27
Figure 3.2 Microscope images for seven groups (at 4× magnification) ... 28
Figure 3.3 Optical microscope images for 10% to 40% regrind materials ... 30
Figure 3.4 SEM micrographs of 7 groups of materials ... 33
Figure 3.5 DSC curves of seven groups ... 34
Figure 3.6 Tensile strain at break for seven groups ... 36
Figure 3.7 Modulus test results of seven groups ... 36
Figure 3.8 Tensile strain at break for seven groups at 50 mm/min ... 37
Figure 3.9 Modulus test results for seven groups at 50mm/min ... 38
Figure 3.10 Appearances of thermoformed cups ... 39
Figure 3.11 SEM micrographs of the 40% regrind materials at the magnification of 200×,300× and 500× ... 39
Figure 4.1 Stretching process of the film ... 44
Figure 4.2 SEM images of the films before stretching and after stretching ... 47
Figure 4.3 DSC spectrum of the film at BUR=1 and the one at BUR=3 before and after stretching ... 49
Figure 4.4 FTIR spectrum of EVOH sheets before and after stretching ... 51
Figure 4.5 FTIR spectrums of multilayer films before and after stretching in parallel and perpendicular direction ... 53
Figure 4.6 XRD spectrum of EVOH sheets before and after stretching ... 55
LIST OF SYMBOLS AND ABBREVIATIONS
BUR Blow-up ratio
CO2PC Carbon dioxide permeability coefficient
DDR Draw down ratio
DSC Differential scanning calorimetry EVOH Ethylene vinyl alcohol
FTIR Fourier-transform infrared spectroscopy GNP Gross national product
LDPE Low-density polyethylene MD Machine direction
OTR Oxygen transmission rate OPP Oriented polypropylene PA Polyamide
PE Polyethylene
PET Polyethylene terephthalate PIR Post Industrial Recycle PP Polypropylene
PP-g-MA Polypropylene grafted with maleic anhydride PS Polystyrene
PVA Poly (vinyl alcohol) PVC Polyvinyl Chloride PVDC Polyvinylidene chloride PVOH Poly (vinyl alcohol) RH Relative humidity
SEM Scanning Electron Microscope WAXD Wide-angle X-ray scattering WPO World Packaging Organisation WVP Water vapour permeability
WVPC Water vapour permeability coefficients WVTR Water Vapour Transmission Rate XRD X-ray Diffractometer
CHAPTER 1
INTRODUCTION
Based on World Packaging Organization (WPO) report, more than 25% of food is wasted because of poor packaging or no packaging. Thus, optimal packaging can be a promising approach to reduce food waste [1]. One of the most basic functions of food packaging is protecting food from the environment. Due to the sensitivity of food products to oxygen, barrier property of food packaging against oxygen are especially essential to extend food shelf life. Using high barrier materials against oxygen in plastic packaging has been a common method to achieve this target.
Among different polymer materials in the market, ethylene vinyl alcohol (EVOH) is a good candidate as it has high oxygen barrier properties and, at the same time, it is easy to process. EVOH is a semi-crystalline random copolymer of ethylene and vinyl alcohol, which is obtained from hydrolysis of ethylene vinyl acetate (EVA) [2] (Fig 1.1).
Figure 1.1 Molecular structure of EVOH [2]
The final properties of EVOH depend on the copolymer composition. In most commercial grades of EVOH, ethylene content is between 24-48 mol%. Copolymers with high ethylene fraction behave similar to PE, and conversely, copolymers with low ethylene fraction have properties similar to polyvinyl alcohol (PVOH) [4].
Two main drawbacks of EVOH are its water sensitivity and high cost. Films with multilayer structure in which EVOH is sandwiched between two moisture barrier layers [4] are a common strategy to reduce the cost and protect EVOH from moisture. The moisture barrier materials are usually polypropylene (PP) and polyethylene (PE). PE and PP are also cheap, meanwhile they can provide excellent sealing properties. PP based structures are widely used for food tray applications. Coffee capsules are one of these food tray applications, which are produced by thermoforming of sheets with a single layer of PP or five-layer barrier structure of PP/adhesive/EVOH/adhesive/PP. In E.Hofmann Plastic, the amount of PP in this five-layer structure is around 93% of all materials
and EVOH and adhesive materials account for about 4% and 3% respectively. In thermoforming of these sheet materials, about 40% of the material is wasted. Regrinding and re-processing of the wasted material result in a significant cost reduction of the final product. In addition, re-using of the wasted plastic reduces the environmental impact of the thermoforming process. However, processing of regrind material has its challenges as re-processing may cause degradation and reduce the final properties compared to virgin material. Therefore, examining the effect of regrind material content on the properties of the ultimate sheet is essential in designing an economical and environmentally friendly product.
Despite the fact that multilayer film structures reduce the cost and increase the functionality of EVOH barrier package, the price of EVOH compared to the whole structure is still considerable. For example, in a five-layer sheet structure of PP/adhesive/EVOH/adhesive/PP used for food trays, EVOH content is about 5% of the package, but it costs about 30-40 % of the cost of the package. Therefore, research had focused on finding solutions to reduce the EVOH content while maintaining final properties, especially the high oxygen barrier property. Blending EVOH with other cheaper polymers is an effective way of reducing the cost, but previous studies showed that blending dramatically lowers the barrier properties. It has been shown that the orientation of polymer films reduces their permeability considerably. Therefore, it is an interesting potential to investigate the effect of EVOH orientation on the permeability of multilayer films as a new solution to reduce the high cost of multilayer films by stretching the films.
Based on what has been mentioned, the main objective of this research is to reduce the high cost of multilayer film which can be achieved through two ways: one is to replace part of PP with regrind materials and another is to use oriented EVOH in multilayer structure.
In this thesis, necessary information about EVOH as well as some previous studies are first introduced in the literature review. The effect of regrind content on sheets properties and the effect of EVOH orientation on multilayer film oxygen permeability are presented in Chapter 3 and Chapter 4 separately. The methodologies are also included in Chapter 3 and Chapter 4. The conclusions and future work are discussed in the last chapter.
CHAPTER 2
LITERATURE REVIEW
Nowadays, people are having much better life than before. The need for food rises in a drastic speed accordingly. The current need for healthy and convenient food products has developed the food packaging. The World Packaging Organization (WPO) evaluates that more than 25% of food is wasted because of poor packaging or no packaging [1]. Therefore, the packaging of food is important to keep food fresh with a long shelf life.
It is a significant challenge to tailor packaging material to meet specific requirements: good oxygen and water vapour barrier properties promise some food (for example: meat) not to go bad in a short period; the excellent optical property attracts the customers and the acceptable mechanical properties protect the food inside the packaging. Among these characteristics, barrier property was highly demanded through simple and low-cost processing methods. The multilayer film is a great option to meet the demand of high barrier properties, which could increase the food shelf life. EVOH is usually used in multilayer packages as oxygen barrier materials, so this review will mainly introduce the synthesis and properties of EVOH. The requirements of food packaging and the comparison of different barrier materials in multilayer films are discussed as well.
2.1 Food packaging
2.1.1 The importance of food packaging
In 2009, the value of the global packaging market exceeded 560 billion USD and increased to 812 billion USD in 2014 [5]. Among the consumption, around 50-60% are led by food and beverage, which are the primary sectors, and after that is cosmetics and health care [6]. Packaging of food plays a crucial role to separate food from bacteria, oxygen and any source that decay and spoil food, while it keeps the flavour of the food and extends the shelf life.
For designing or producing food packaging, three essential functions are needed: It preserves the food, improve the product, and attract buyers. Besides, packaging should also be convenient while this property is almost the same as ‘promotion’ since people tend to be drawn by convenience [7]. As discussed in 1985 in the Codex Alimentarius Commission, “Food is packaged to preserve its quality and freshness, add appeal to consumers and to facilitate storage and distribution.” Food packaging should be safe to bodies with high barrier properties, mechanical strength, chemical and
heat resistance, among which, high barrier properties promise maintain food fresh and with a longer shelf life.
2.1.2 The requirements of food packaging
To fulfill of the customers’ satisfaction, the final food products need to be in the best. Based on this goal, the packaging needs to achieve three targets: protection, containment and preservation [7], which require the corresponding properties, such as mechanical strength, optical transparency, scalability, and more crucially, barrier property.
2.1.2.1 Barrier properties
In packaged food, tiny molecules pass through packaging (in Fig. 2.1) [8]. Water vapour and gases are most studied, among which, oxygen and water vapour are two important permeants because they pass through packaging from inside or outside, causing a continuous exchange in both product shelf life and quality [8]. Therefore, packages should have good barrier properties to extend the product shelf life.
Figure 2.1 General mechanism of gas or vapour permeation through a plastic film or vapour permeation through a plastic film [8].
2.1.2.1.1 Water Vapour Transmission Rate (WVTR)
Enough water guarantee food stuff (for instance, vegetables and fruit) fresh and satisfied texture, which calls for the qualified water vapour barrier property in packaging [9]. Water Vapour Transmission Rate (WVTR) indicates the amount of water vapour that permeates the material during a specific time. WVTR is associated with water vapour permeability coefficients (WVPC), which can be expressed in equation (1) where PT is the total permeability, lT is total thickness, l1
and l2 mean different layer thickness, P1 and P2 are different layer permeability, and the unit of
WVPC is (kg·m/(m2·s·Pa)) [9]. 𝑃𝑇 = 𝑙𝑇 [(𝑙1 𝑃1 ⁄ )+(𝑙2 𝑃2 ⁄ )] (1)
Water vapour permeability (WVP) is affected by polymer water interaction, which is hydrophilicity or hydrophobicity of the polymer. Water vapour is generally in preference to pass through the hydrophilic area of the packaging. Nevertheless, the hydrophilic does not ensure a greater water vapour transmission rate [10]. For example, water vapour transmission rate (WVTR) for PVC is lower compared with PS (in Figure 2.2), despite that PVC is more hydrophilic than PS [11]. Furthermore, Fig.2.2 shows that the OPP had the best resistance to water vapour permeability [12] [13].
For various types of food, the WVP is designed to behave differently, for example, it is considered to prevent water permeation for potato chips and pastry while maintain water vapour of fresh vegetables and fruit.
2.1.2.1.2 Oxygen Transmission Rate (OTR)
While oxygen is necessary for people, it has major influence on vitamins and fats. Oxygen spoil food in terms of deterioration of odour, colour, flavour, and nutrients. Due to the sensitivity of food products to oxygen, barrier property of food packaging against oxygen are especially essential to extend food shelf life. Using high barrier materials against oxygen in plastic packaging has been a common method in achieving this target.
The oxygen barrier property can be measured with oxygen transmission rate (OTR), which indicates the amount of oxygen transferring through the packaging over a given period. This transportation is usually in the way of diffusion and is mostly tested on non-porous substance. The typical OTR trend for commonly used packaging polymers is illustrated in the Fig.2.3 [10] [14]. We could see that PVA has the best oxygen barrier property and PS the worst in the Fig.2.3.
Figure 2.3 Typical Oxygen Transmission Rates of Regular Packaging Polymers [10] Theoretically, there are two methods to achieve good oxygen barrier property in polymer packaging, one is sandwiching good oxygen barrier material into multilayer packages in which PP
is used most in industrial field, considering the balance between cost and quality. The other is blending with excellent oxygen barrier components.
Blending with high-barrier material could increase the tortuosity of the oxygen transport path, which is the promise of the improvement in barrier capability. By controlling the blending system’s morphology, we could also obtain different barrier properties if the system is immiscible.
High barrier performance could be achieved through co-injection for rigid packaging and lamination or co-extrusion for flexible materials, while for both types of materials, it is always a practical way to add a layer of good oxygen barrier material sandwiched between water vapour barrier materials.
2.1.2.1.3 Other small molecules barrier properties
Theoretically, permeability coefficients for semiconductors or metals are from 10-20 and 10-22
m2/(s·Pa), for potteries and glasses are from 10-19 to 10-17 m2/(s·Pa), but for polymers, the
coefficients increase from 10-17 to 10-11 m2/(s·Pa) [15]. This increase is because when dissolving gas, a small portion could not be absorbed and go out from another side, so polymers used in the packaging should have low gas permeability. Some researchers measured the permeability coefficients with different polymers in different gas in Fig. 2.4
Figure 2.4 Measured permeability coefficients, P, in 10-17m2/(s·Pa) for various polymers and gases at 25-30℃ [15]
As shown in Fig. 2.4, carbon dioxide (CO2) is another significant parameter affecting food in
packaging. Beer and sparkling wines require specific characteristics for the packaging as they are not only oxygen-sensitive but also contain a high level of CO2. The same as oxygen and water
coefficient (CO2PC), representing the amount of carbon dioxide that is transferred through the
packaging in a given area and time, and the unit is (kg·m/(m2·s·Pa)) [9].
The other gas permeability researched in the polymer food packaging area has limited results. Rocculi et al. [16][17]. studied the permeability of carbon monoxide, nitrogen, nitrous oxide and argon with fruit and Kofinas et al. [18] researched the permeability coefficient of methane and helium but no experiment was taken with actual food.
2.1.2.2 Other requirements
2.1.2.2.1 Mechanical properties
One of the most basic functions of packaging is to protect the food inside. Mechanical properties are necessary because the food should be in perfect shape during the transportation process and daily usage. Packaging should be strong enough to bear the physical force as well as circumstantial modification such as air pressure and temperature [19]. Basically, several mechanical tests should be taken to ensure the mechanical properties of packaging materials, such as modulus test, compression test, tensile test, bursting test and impact test. [19].
2.1.2.2.2 Thermal properties
The thermodynamic properties of polymers determine their performance during the procedure to heat from a crystalline state or solid amorphous to a molten state. Thermal properties of polymers, including heat distortion temperature and glass transition temperature, effect the mechanical performance of the polymer and thus, are favourable for the applicability of the polymer for specific packaging usage area [18]. The glass transition temperature is crucial when storing packaged materials in a cryogenic environment. In this case, it must be ensured that the freezing temperature cannot outreach glass transition temperature of the packaging material [19]. Otherwise, the packaging material may become fragile or even break. The fusion heat is another thermal property that plays a vital role in determining packaging materials [18]. If the polymer obtains heat greater than its heat of fusion from the external environment, the structure of the polymer may experience damage which leads to packaging failure[19].
2.1.2.2.3 Optical Properties
Optical properties involving colour, clarity, haze and gloss are determined by both the actual polymer structure and the degree of crystallinity [19]. Through colour, the quality of packaging could be seen by eyes directly and basically. The clarity of the packaging means how the item changes when observing through the package. It can be enhanced by random copolymerization or quenching for crystalline polymers [20]. Haze is usually used to test thin films to check the surface defects with the method ASTM D1003 and ISO 14782. Haze meter is frequently employed, but spectrophotometer can also work. The gloss means how well a surface which is mostly resembling a mirror reflects light. It could decline due to surface marks, raggedness and unevenness. Gloss meter is usually used to test the gloss of the object, often at the angle of 60°, sometimes at 20° or 45° according to the method ASTM D523 and ASTM D2457 [20]. The portion of light of the gloss meter indicates the gloss of the packaging, the smaller the specular reflectance is, the more matte the surface is.
2.1.3 Common materials used in packaging
The most popular materials used in food packaging are metal oxide, aluminium foil, ethylene vinyl alcohol (EVOH) and polyvinylidene chloride (PVDC), while the packaging with aluminium or metal cannot be heated in a microwave oven which is inconvenient for fast-paced life today. Besides, the application of aluminium foil or metal is not environmentally friendly. As a result, polymers are becoming increasingly popular in the packaging field. Fig. 2.5 demonstrates the water vapour transmission rate (WVTR) and the oxygen transmission rate (OTR) of some commonly used polymers [21].
From Fig. 2.5, we could see that PVDC and EVOH have better oxygen barrier properties than other polymers. PVDC is a good choice with an excellent water vapour barrier property. However, there are some disadvantages that we cannot ignore: It is expensive and not environmentally friendly. More crucially, the processing window of PVDC is very narrow, only around 10℃ [4]. This small processing window makes the process hard as well as challenging when co-extrusion with other polymers, like nylon and PET [22]. Moreover, PVDC experiences thermally induced dehydrochlorination at temperatures near its processing temperature, which results in the emission of hazardous by-products such as hydrogen chloride during incineration [23]. EVOH, compared with PVDC, has a broader processing window, which makes it much easier to process, although it is sensitive to humidity, it has an excellent oxygen barrier property, for example, EVOH polymer from Kuraray (L171B grade) has an oxygen permeability of 0.2 cc·mil/m2·day·atm at 23 ℃ and
0% RH, which is about an order of magnitude lower than PVDC [24]. EVOH has a perfect gas barrier against not only oxygen but also carbon dioxide, nitrogen and helium, hence keeping the food freshness. Besides, unlike PVDC being harmful to the environment, EVOH does not include metals, chlorine, dioxins or other items which could lead to endocrinological disorders [25] and it is recyclable. Another good reason why EVOH is commonly used is that it has a high gloss and outstanding transparency.
2.2 EVOH
2.2.1 What is EVOH
EVOH is a semi-crystalline copolymer of ethylene and vinyl alcohol in a random unit showing as follows [2]:
EVOH has two sorts of monomer units, PVOH and PE. PVOH has good oxygen barrier property, but it is hard to process and easily dissolved in water. Another monomer, PE, behaves very poorly at gas barrier but it has approachable capability to process. So, EVOH, as copolymers of PVOH and PE, could have an excellent gas barrier property while, easy to process [25].
Iwanami et al. found that synthesis can be finished by two steps: free radical polymerisation and then saponification when producing EVOH in companies [2]. Blackwell et al. [26] studied that vinyl acetate and ethylene are used in the polymerisation due to the instability of vinyl alcohol. The reaction is shown below:
Figure 2.6 The process of EVOH synthesis [26]
In this saponification process, the acetate functional groups in polyvinyl acetate copolymer are converted into alcohol (hydroxyl) groups [4].
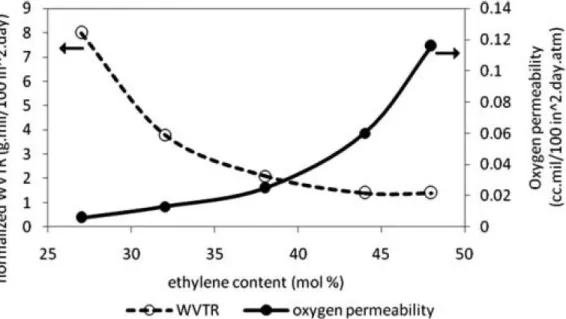
The final properties of EVOH are determined on the copolymer composition, and the commercial ethylene content is between 24-48 mol.%. Copolymers with high ethylene fraction behave similarly to PE, and conversely, copolymers with low ethylene fraction are expected to be more like PVOH. Kuraray et al. [27] found that an EVOH with 44 mol.% ethylene has almost ten times higher oxygen permeability compared with an EVOH with 27 mol.% ethylene, and the water vapour transmission of EVOH with 44mol.% ethylene is around eight times lower than EVOH with 27 mol.%, as shown in Fig 2.7.
Figure 2.7 Oxygen permeability and thickness normalised water vapour transmission (WVTR) as a function of ethylene content for EVOH copolymers. (Data from EVAL Americas)
2.2.2 Crystallisation of EVOH
There are three types of EVOH crystal structures: monoclinic crystal, pseudohexagonal crystal and orthorhombic crystal. As mentioned above, EVOH is the copolymer of PVOH and PE. The crystal structure of PVOH is monoclinic [28] while PE has two crystal structure types, known as pseudohexagonal and orthorhombic [29][30]. A series of EVOH copolymers with different components can crystallise with different crystal structures since the melting point shifts with different contents [30]. The crystal structures of EVOH vary with the degree of ethylene content. Takahashi et al. researched the structure change between 73-86 mol.% (in Fig. 2.8). This change is possibly because of a sustained shift in the setting angle of the zigzag chains [3], but it is still needed to simulate to verify.
Figure 2.8 Illustration of the transformation of the crystal structure of EVOH samples with different VA content [3]
The structure of the EVOH27 sample can be assumed as either (c) or (d) [15].
EVOH with 86-94 mol.% ethylene content, which behaves more like PE has an orthorhombic crystal structure while EVOH with ethylene content between 0-73 mol.% is more like pseudohexagonal crystal structure, which is similar with PVOH [31]. However, the boundaries for monoclinic crystals of ethylene content in EVOH copolymers are not so clear. For example, Takahashi et al. [3] indicated that EVOH copolymers with 73-86 mol.% ethylene content are monoclinic crystals, but Cerrada et al. [32] showed that monoclinic crystals should be below 40 mol.%.
The figure of pseudohexagonal EVOH crystals is shown in Fig. 2.9. Takahashi et al. [3] assumed that this chain should be rigid, and the space for the C-O bond is 1.398 Å, whereas the C-C bond is 1.531 Å. As for the setting angles, which means the angles between the C-C zigzag plane and the a-axis, it should be 110°for∠C-C-C, 109.4° for∠C-C-O and 109.3° for∠O-C-O.
Figure 2.9 EVOH pseudohexagonal crystal structure models of 0-73 mol.% ethylene content [3] As shown in Fig. 2.9, on both faces of the planar-zigzag, there are OH groups positioned unsystematically, but the amount of OH groups at each side are the same. There are four parameters to alter when two zigzags in one chain: the interchain distance, the setting angle, the isotropic temperature and the proportion of the reflection intensities [3].
Another EVOH orthorhombic crystal structure is shown in Fig. 2.10, whose chain has similar intramolecular appearances with pseudohexagonal EVOH crystals [3]. But the difference is in the EVOH orthorhombic crystals, the proportion of the OH groups positioned each side is half of that in pseudohexagonal EVOH crystals under the hypothesis of regularity conditions.
Figure 2.10 EVOH orthorhombic crystal structure models of 86 mol.% and 94 mol.% ethylene content [3]
2.2.3 Good barrier properties
Michael et al. found that the amorphous phase is the leading region where the transport and diffusion of a great majority of low gas molecules take place [33], which means the crystallised areas block the permeation of such gases like carbon dioxide, water vapour and oxygen. With the increase of the crystallinity, oxygen permeability decreases accordingly (in Table 2.1), the drop of oxygen permeability is significant even if the crystalline of EVOH only increased 12% and for LDPE, the oxygen permeability fell more than four times with the growth of crystallinity from 50% to 75%. The same as PET and PP.
Table 2.1 Effect of crystallinity on oxygen permeability of polymers
(a Data from Armstrong (2002), oxygen permeability measured at 20°C, 100% RH for EVOH with 32 mol.% ethylene. b Data from Salame (1986), oxygen permeability measured at 23°C, 50% RH.)
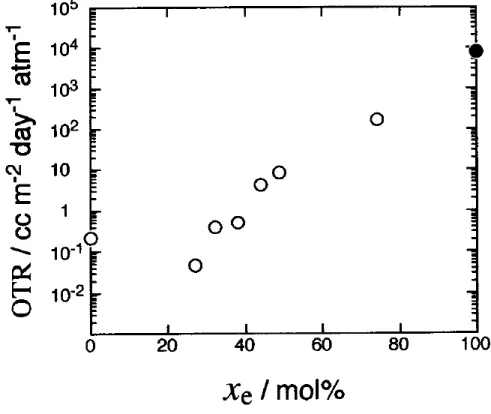
EVOH has the lowest oxygen permeability, compared with other polymers. Because EVOH, as a polymer with high crystallinity, has a large number of crystalline regions that make the passage of gas molecules to be longer and more tortuous, thereby effectively reducing the permeability of the gas [34]. Although the fact that the lack of stereoregularity in the EVOH structure does affect the crystallinity of EVOH, researchers found that the size of the hydroxyl group is too small to influence the EVOH crystal structure [34]. From other perspectives, these -OH groups significantly increase the cohesion between the EVOH chains, further increasing the crystallinity of EVOH [34]. Another critical factor affecting oxygen permeability of EVOH is the ethylene content (in Fig 2.11), EVOH with 27 mol.% ethylene obtains around 10,000 times lower oxygen barrier properties compared with an EVOH with 74 mol.% ethylene [35]. This difference is because the growth of
ethylene content in EVOH makes the intermolecular forces lower, which decrease the crystallisation rate, and as a result, the oxygen barrier property of EVOH becomes worse.
Figure 2.11 Variation of the oxygen permeability (OTR: oxygen transmission rate) for ethylene-vinyl alcohol copolymer, EVOH, as a function of ethylene unit content, xe
OTR was determined in the conditions as the following: sample thickness, seven μm; temperature, 20 °C. The open circle denotes the value measured using the apparatuses (OXTRAN 10/20 or 10/50, MOCON/Modern Control Inc.) [35], while the
closed loop represents that quoted from the literature [36].
2.2.4 Moisture sensitivity
EVOH is a hydrophilic polymer containing hydroxyl groups which absorb moisture at high relative humidity (RH) [38], thereby increasing the permeability of the gas. Fig. 2.12 shows that the moisture content of the EVOH polymer rises with time. The increase of high RH not only reduces the oxygen barrier performance but also lowers the glass transition temperature (Tg) of EVOH and changes the yield strength and tensile modulus of EVOH [38]. These results are because the hydroxyl group of EVOH interact with water molecules, which makes the hydrogen bonding worse
between the EVOH chains [39]. As a result, this promotes the segmental motion of the chains and further affecting the physical properties of EVOH [37][39][40].
Figure 2.12 Equilibrium moisture absorption of EVOH at different RH [41]
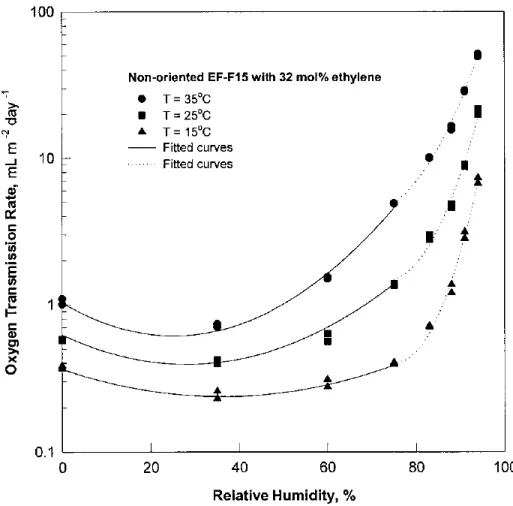
Muramatsu et al. [42] found that compared with oxygen molecules, water molecules effortlessly combine with hydroxyl groups to form hydrogen bonds in EVOH molecules, which are powerful intramolecular forces. These water molecules occupy free volume, which reduces the oxygen permeation path, thereby increasing the oxygen barrier properties of EVOH [42]. On the other hand, the interaction of water molecules with hydroxyl groups make the hydrogen bonds weaker within the molecule. As a result, this promoted oxygen diffusion and segmental motion. In the high RH condition, this weakening effect is stronger, and thus the oxygen permeability of EVOH is enhanced. Figure 2.13 clearly shows the relationship between RH and EVOH oxygen permeability at different temperatures. Muramatsu et al. [42] also studied the relation between free volume and oxygen transport properties of EVOH (29 mol.% ethylene) and found a correlation coefficient of 0.99.
Another interesting phenomenon is the active energy rise with increasing RH, which also shows that with increasing RH, the path of oxygen in EVOH become tortuous, which limits the oxygen barrier property in EVOH [43].
Figure 2.13 Experimental and fitted values for O2TR of nonoriented EVOH film with 32 mol.%
ethylene content at 1 atm oxygen [43]
2.2.5 Solutions
Since EVOH is very sensitive to the moisture, it has excellent oxygen barrier property. It is often used in multilayer packages to reach the goal of protecting the food effectively, and another way is blending with other polymers.
2.2.5.1 Multilayer packages
EVOH is usually sandwiched between two moisture barrier layers in multilayer packages (in Fig 2.14). The most popular moisture barrier layer is PP. The normalised water vapour transmission rates of oriented PP measured at 40°C and 90% RH is 0.38 g·mil/100 in2·day compared to 1.4–8.0 g·mil/100 in2·day for EVOH copolymers [44]. Besides, PP behaves well on heat sealing capability
and mechanical properties. Another appealing moisture barrier material is PET, known as its strong printability, abrasion resistance and excellent strength [4].
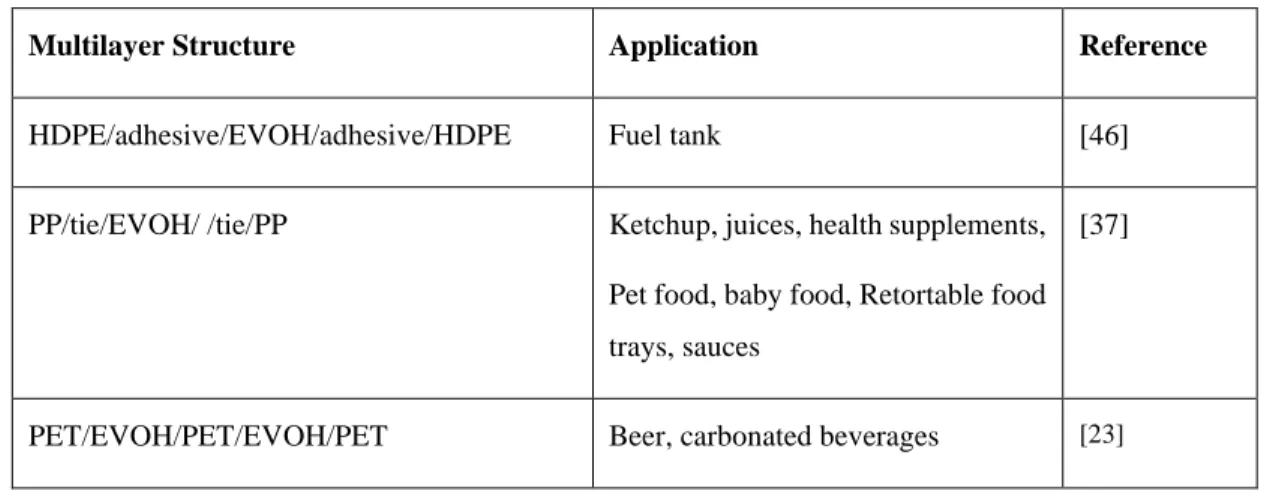
Table 2.2 and Table 2.3 list several common flexible and rigid multilayer structures with an oxygen barrier EVOH layer and their final applications.
Figure 2.14 Illustration of a multilayer structure [4]
Table 2.2 Applications of flexible multilayer barrier structures incorporating EVOH layer
Multilayer Structure Applications Reference
OPP/tie/EVOH/tie/PE Dried Bonito flakes
Miso paste and bouillon
[23]
PET/PE/tie/EVOH/tie/PE Standup pouch (beef jerky, trail mix, mayonnaise)
[45]
PET/PE/tie/EVOH/tie/EVA High-barrier laminate pouch/package [37]
Table 2.3 Applications of rigid multilayer barrier structures incorporating EVOH layer
Multilayer Structure Application Reference
HDPE/adhesive/EVOH/adhesive/HDPE Fuel tank [46]
PP/tie/EVOH/ /tie/PP Ketchup, juices, health supplements, Pet food, baby food, Retortable food trays, sauces
[37]
PET/EVOH/PET/EVOH/PET Beer, carbonated beverages [23]
2.2.5.2 Blending of EVOH
Blending is a production method in which the cost of production is reduced by mixing highly-priced materials with cheap matrix materials by co-injection or coextrusion to minimize the number of expensive materials [47]. The properties of the blend can be enhanced due to the synergistic effect in the blending process [48]. Due to the high moisture resistance and low cost of polyolefins, EVOH/polyolefins are widely used in a wide range of applications. However, polyolefin/EVOH is an immiscible polymer blend. It is well known that the final properties of immiscible polymer blends are controlled by their morphology. Meanwhile, OTR is not an exception [49][50]. Fig 2.15 illustrates the morphological function of the barrier properties of the blend.
Figure 2.15 Schematic illustration of the permeability of a blend of a high-barrier material in a low-barrier matrix as a function of the morphology [51]
Blending with polyolefins is fairly a practical way for EVOH, but further research is still needed. Kamal et al. [52] developed a process to produce PP/EVOH blending with laminar morphology. There are also other researches on EVOH in PE, PP, PA and PET.
It is also a good way to apply nanocomposites into blending, which could significantly increase tortuosity of the diffusion path, as a result the oxygen barrier property could be enhanced.
2.3 Originality
As mentioned above, two ways are commonly used to reduce the high cost of multilayer films and improve its moisture sensitivity: multilayer packages are applied to reach the goal of protecting the food effectively, and another way is blending with other polymers.
In thermoforming of multilayer packages, about 40% of the material is wasted. Regrinding and re-processing of the wasted material reduce cost of the final product. In addition, re-using of the waste plastic reduces the environmental impact of the thermoforming process. However, processing of regrind material has its challenges as re-processing may degradate and reduce the final properties compared to the virgin material. Examining the effect of regrind material content on the properties of the ultimate sheet is essential in designing an economical and environmentally friendly product. Blending of EVOH with other cheaper polymers is an effective approach of reducing the cost, but previous studies showed that blending dramatically lowers the barrier properties. It has been shown that the orientation of polymer films reduces their permeability considerably, but there are limited results on EVOH orientation since the results are primarily affected by the ethylene content and humidity.
To evaluate the effect of regrind content on PP-EVOH sheets and investigate the effect of EVOH orientation, this work contains two parts: one was to replace part of PP with regrind materials. The other was to research the effect of EVOH orientation on oxygen barrier property of the films. Both projects were cooperated with E. Hofmann Plastic. For regrind part, the conclusions were obtained through analysing and comparing the property test results at the range from 10% to 40% regrind material proportion.
As for the other project, there is little research on the effect of EVOH orientation on the oxygen barrier property of multilayer films. The results were interesting because not only few results
existed, but also it is crucial that film oxygen barrier property is improved just through film stretching, which is not a difficult or complicated process. The thermal properties and crystal structure were also studied in this work.
2.4 Objectives
The main objective of this work was to decrease the high cost of multilayer films through the replacement of part of PP with regrind materials and EVOH orientation. To achieve this objective, the following sub-objectives were defined:
⚫ Firstly, processing of regrind material has its challenges because re-processing may cause degradation and reduce the final properties compare to the pure material, thus it is important to examine the effect of 10% to 40% regrind materials on the property differences of the sheets; ⚫ Secondly, because the final product is coffee capsule which is always thermoformed, as mentioned above. It is necessary to check the impact of 10% to 40% regrind materials on sheets thermoforming producing process.;
⚫ Lastly, it will be interesting to study the influence of EVOH orientation on the oxygen barrier property of multilayer film.
CHAPTER 3
EFFECT OF REGRIND CONTENT ON PP-EVOH
SHEETS PROPERTIES
Packaging is essential to keep food fresh and to extend the food shelf life because of its excellent barrier properties to small molecules such as oxygen, water vapour and carbon dioxide. For example, meat tends to turn metamorphic if the packages have weak oxygen barrier properties. Due to the sensitivity of food products to oxygen, barrier property of food packaging against oxygen are especially essential to extend food shelf life. Using high barrier materials against oxygen in plastic packaging has been a common method in achieving this target. Ethylene vinyl alcohol (EVOH) is a good candidate in packaging since it has really practical oxygen barrier properties. EVOH is a copolymer of ethylene and vinyl alcohol, and its final features depend on ethylene content. Besides the high-quality oxygen barrier property, EVOH has a broader processing temperature window to make the process easier, and it is friendly to the environment.
However, the application of EVOH is somehow limited due to its sensitivity to moisture and high price. Films with multilayer structures in which EVOH is sandwiched between two moisture barrier layers [4] are a common strategy to reduce the cost and protect EVOH from moisture. The moisture barrier materials are polypropylene (PP) which is cheap, meanwhile they can provide excellent sealing properties. PP based structures are widely used for food tray applications, about 40% of the material is wasted. Regrinding and re-processing of the wasted material results in a significant cost reduction of the final product. In addition, re-using of the waste plastic reduces the environmental impact of the thermoforming process. However, processing of regrind material has its challenges as re-processing may degradate and reduce the final properties compare to the virgin material, therefore examining the effect of regrind material content on the properties of the ultimate sheet is essential in designing an economical and environmentally friendly product.
Regrind materials mean that the used materials are post-industrial recycled to replace neat raw materials. For instance, in this research, the multilayer packages containing PP, EVOH and PP-g-MA are industrial collected to regrind. Sheets were produced by these regrind materials and then the sheets’ properties were analyzed, such as mechanical properties and oxygen barrier properties.
3.1 Experimental
3.1.1 Materials
Virgin Polypropylene (Ineos H02C) and Regrind material (containing EVOH, tie and PP) were provided by E. Hofmann Plastics.
Regrind material was post-industrial recycled, containing PP, 5% EVOH and adhesive material. Since PP and EVOH were incompatible, it was necessary to use adhesive materials, also known as tie layer, while the adhesive material used here was PP-g-MA. The regrind material was kept in the sealed package to promise its properties not to be affected by moisture.
3.1.2 Sheets preparation
Multilayer structures were cast using a three-layer extrusion line. A temperature profile of 210-220℃ for the extruders was adapted in the experiments. And the temperature of the die was 210-220℃. The samples were 24 cm wide, 0.8 mm-1mm thick. The extruders and dies were from Lab Tech Engineering. Four extruders were used to make a three-layer structure: PP/regrind/PP. Seven groups of sheets with different regrind percentage were produced for comparison, and the contents were controlled by different extruder screw speeds of regrind material and PP which are shown in Table 3.1. The specific proportion of regrind material would be calculated by thickness measured by optical microscope.
Table 3.1 Different extruder screw speeds to get different regrind material content
Group numbers Extruder screw speeds (rpm)
Group 1 Dry regrind 100
PP 3*150
Group 2 Dry regrind 100
(cont’d) Table 3.1 Different extruder screw speeds to get different regrind material content
3.1.3 Sheets characterisation
3.1.3.1 Optical microscope
The thickness of sheets was measured by the optical microscope from NIKON. The samples were cut with the blades at the cross-section and then observed at 4× magnification.
3.1.3.2 Mechanical analysis
Modulus test, as well as the tensile test, was done with the INSTRON 5500R. The modulus test was based on the standard of ASTM D638; the samples were first pressed to type V according to ASTM D638 standard, and then broken at the rate of grip separation of 100 mm/min. The tensile test was also based on ASTM D638 standard, same as the modulus test, the samples were broken at the rate of grip separation of 100 mm/min.
3.1.3.3 Differential scanning calorimetry (DSC)
Thermal properties, including melting point as well as crystallinity, were tested with Differential Scanning Calorimeter (DSC) Q 2000. The test was carried in 1 cycle for crystallisation, heating to
Group 3 Dry regrind 4*150
Group 4 PP 4*150+2*150
Group 5 Dry regrind 50+100
PP 2*150
Group 6 Dry regrind 2*100
PP 2*150
Group 7 Dry regrind 2*150
200℃ at 10℃/min. The crystallinity was obtained based on the heat fusion and calculated in the following way:
The heat fusion of EVOH was first measured in DSC and then divided by the mass fraction of EVOH. Lastly, the crystallinity of EVOH can be achieved by the ratio of the obtained heat fusion and the heat fusion of 100% virgin EVOH. The mass fraction of EVOH was the result of the regrind material proportion multiplied by around 5% EVOH in regrind materials. Meanwhile, the heat fusion of 100% virgin EVOH with 32% ethylene content was 157.8 J/g [53]. This value was taken to estimate the crystallinity of EVOH with 29% ethylene content because no reliable information was found on EVOH with 29% ethylene content. However, the difference of heat fusion of EVOH with 29% ethylene content and 32% is negligible, so 157.8 J/g can be used for crystallinity calculation here.
The calculation of PP crystallinity is the same as EVOH, and the enthalpy of PP was taken as 207 J/g [54].
3.1.3.4 Oxygen transmission
Oxygen transmission was analysed with OX-TRAN MODEL 2/21 OXYGEN PERMEABILITY from MOCON; the oxygen permeability properties were tested at MD mode for seven groups at the condition of the temperature of 23℃ and pressure of 740±6 mmHg. The testing area was 50 cm2 without masks and condition hour was 10 hours. Exam minutes were set as 30 minutes and the parameters for oxygen, N2+ H2 are 20 ml/min and 10 ml/min separately.
3.1.3.5 Thermoforming
The thermoformed cups were obtained from regrind materials above at a vacuum condition with Formech 450 thermoforming machine. The heating time varied with different regrind material proportion and the cooling time was around 45s.
3.1.3.6 Scanning Electron Microscope (SEM)
Morphology was observed with TM3030Plus Scanning Electron Microscope from HITACHI at the magnification of 200×,500× and 1500×. Samples were first cut with blades and then were coated for better images.
3.2 Results and discussion
3.2.1 Appearances
If only observed by naked eyes, there was no evident difference in appearances (Fig 3.1). Group 4 is PP which is the most transparent one, while Group 3 is 100% regrind material which is the cloudiest one. Regrind materials are mixed materials; there might be some impurity in it. In addition, EVOH is milkier than PP, so this result is reasonable. The difference in transparency is not apparent for other groups.
In conclusion, there is almost no difference in transparency as well as no gels in all seven groups.
Figure 3.1 The appearance of seven groups of sheets
3.2.2 Thickness
The thickness of the regrind layer and the total thickness were measured with a microscope and then the regrind proportion of each group was calculated, as shown in Fig 3.2 and Table 3.2. In the Fig.3.2, the dark banding in Group 1, 2, 4, 5, and 6 are regrind materials.
Figure 3.2 Microscope images for seven groups (at 4× magnification) Table 3.2 Thickness of regrind layer and PP layer in seven groups
Sample group Thickness of regrind layer (mm) Thickness of the sample (mm) Proportion of regrind ( % ) Group 1 0.18 0.90 20
3
4
5
6
7
(cont’d) Table 3.2 Thickness of regrind layer and PP layer in seven groups Group 2 0.09 0.95 10 Group 3 0 0.92 100 Group 4 0 0.87 0 Group 5 0.29 0.97 30 Group 6 0.14 0.92 15 Group 7 0.32 0.80 40
In the following discussion, we ranged each group by proportion of regrind materials instead of group numbers shown above, from PP, then 10% regrind material to 40% regrind material, followed by 100% regrind material.
3.2.3 The uniformity
Due to the effect of extrusion, the uniformity of 10% regrind materials to 40% regrind materials need to check. The results are demonstrated in Fig 3.3, and the calculation results are shown in Table 3.3. It can be seen in all groups, the middle parts have more regrind materials than edge parts. This may be caused by the different viscosity of regrind materials and virgin PP in the casting process. The effect of the flow field of die needs to be considered as well.
When choosing edge part, it was cut 1 inch away from the actual edge to avoid the edge effect since, during extrusion process, the distribution of materials at edge part would be thicker than materials in other positions.
a b c
Figure 3.3 Optical microscope images for 10% to 40% regrind materials
(Column a is chosen from right edge of the samples, Column b is chosen from middle part, and Column c is chosen from left edge, Row 1 is 10% regrind material, Row 2 is 15% regrind material, Row 3 is 20% regrind material, Row 4 is 30% regrind
material, and Row 5 is 40% regrind material)
Table 3.3 Regrind materials proportion calculation results with different sheets position
Left edge Middle part Right edge Average content
(cont’d) Table 3.3 Regrind materials proportion calculation results with different sheets position
15% regrind 14.6% 38.1% 13.7% 22.1%
20% regrind 20.3% 24.8% 17.2% 20.8%
30% regrind 30.0% 48.5% 30.2% 36.2%
40% regrind 42.0% 63.2% 41.8% 49.0%
The regrind material content is different with virous location which means the sheets are not uniform, but if we calculate the average values of both edges and middle part in each regrind materiel content, the difference is not that big.
Since the samples were not uniform, the samples chosen for other characterisations were picked at the same position, near right edge but all cases were away at 1inch distance from the actual edge.
3.2.4 Morphology
The distribution of regrind materials was observed with SEM at the magnification of around 200 ×, 500× and 1500×, as shown in Fig 3.4. At the magnification of 200×, the distribution of PP and EVOH could be seen. PP is on both edges and EVOH is in the middle. When zooming in the middle part to 500×, the microstructure of the regrind layer could be observed, and the shapes of EVOH materials were noticed when the magnification reached 1500×.
a b c
Figure 3.4 SEM micrographs of 7 groups of materials
(Column a is at 200× magnification, Column b is at 500× magnification, and Column c is at 1.5k× magnification, Row 1 is PP, Row 2 is 10% regrind material, Row 3 is 15% regrind material, Row 4 is 20% regrind material, Row 5 is 30%
regrind material, Row 6 is 40% regrind material, and Row 7 is 100% dried regrind material)
3.2.5 Thermal analysis
DSC figures (Fig. 3.5) indicate that except for the group of 100% PP, all have EVOH crystalline. The small peaks at around 180°C were of EVOH, and it could be seen that the EVOH amount is small. Nevertheless, as the proportion of regrind materials increased, the area of peak expanded meaning that more EVOH materials were contained.
The melting temperature and crystallinity of PP and EVOH are shown in Table 3.4. When compared among different proportion regrind materials, melting temperature of PP had a little shift but no obvious differences in all groups, so is the melting temperature of EVOH. The crystallinity of PP is close to each other, while it should be noticed that the crystallinity of EVOH differed a lot among these seven groups. It is because the amount of EVOH in the sheets is too small. Taking an example of 20% regrind material, there is only 1% EVOH in the sheets and DSC machine is not so sensitive. Even 100% regrind material, there is only 5% EVOH in the sheets. Considering the crystallinity of EVOH granule is 27.3%, we could conclude that only the crystallinity of EVOH in 100% regrind material is reliable and frankly, it is meaningless to compare the crystallinity of EVOH in other regrind material content.
Figure 3.5 DSC curves of seven groups
Table 3.4 Melting temperature and heat fusion of EVOH and PP in seven groups PP melting temperature (℃) EVOH melting temperature (℃) Crystallinity of PP (%) Crystallinity of EVOH (%) PP 160±1 - 46.42±2 - 10% 160±1 183±1 45.44±2 - 15% 160±1 183±1 46.27±2 - 20% 160±1 183±1 44.62±2 26.96 30% 160±1 183±1 45.91±2 18.36
(cont’d) Table 3.4 melting temperature and heat fusion of EVOH and PP in seven groups
40% 161±1 183±1 45.63±2 32.07
100% dry 162±1 183±1 47.59±2 23.47
3.2.6 Oxygen transmission
Oxygen transmission was tested to check whether microbubbles exited in the sheets since they are hard to detect. While if there are microbubbles in the sheets, the oxygen permeation will get higher, thus oxygen transmission is a good way to detect microbubbles in the sheets.
When comparing the effect of different regrind material proportion to oxygen barrier properties, Table 3.5 shows that the oxygen barrier properties are slightly better with proportion from 10% to 40% of regrind materials, but if the deviation was taken into consideration, the results were similar to each other, there was almost no difference.
Among these seven groups, 100% regrind material has the lowest oxygen barrier permeation values, and virgin PP behaves worst on oxygen barrier property, but in the acceptable range of error, it can be concluded that there is no visible change with different regrind material proportion. Table 3.5 Oxygen permeation of seven groups
0 500 1000 1500 2000 2500 3000 3500 PP 10% 15% 20% 30% 40% 100% Permeation (cc -mil/[m2 -day] regrind percentage
3.2.7 Mechanical analysis
The samples were first pressed to type V according to ASTM D638 standard and then broken at the rate of grip separation of 100 mm/min.
By considering the values of results and standard deviation, the results of tensile strain at break and modulus tests are comparable. The regrind content does not have a significant effect on mechanical properties. The data and error are illustrated in Figure 3.6 and Figure 3.7.
(error bar shows standard deviation)
Figure 3.6 Tensile strain at break for seven groups
(error bar shows standard deviation)
Figure 3.7 Modulus test results of seven groups
0 200 400 600 800 1000 1200 1400 1600 1800 2000 PP 10 15 20 30 40 100 Te n sile s tra in a t b re ak (s ta n d ar d ) (% ) Regrind percentage 0 100 200 300 400 500 600 PP 10% 15% 20% 30% 40% 100% Mo d u lu s (Au to m at ic yo u n g’s ) (MPa ) regrind percentage
The data from Figure 3.6 and Figure 3.7 were obtained at the rate of grip separation of 100 mm/min according to ASTM D638 standard. But usually dog-bone samples are tested at the rate of grip separation of 50 mm/min in industry field, so the mechanical tests were also done at the rate of 50mm/min as shown in Figure 3.8 and Figure 3.9. The error of 40% regrind material is large, it is due to different break location, but the error is in the range of 20%. If we only take the samples which break at the centre, the error is around 5%. In general, the trends of both the tensile test and the modulus test at 50 mm/min are almost the same as 100 mm/min.
It can be concluded that regrind proportion have no significant effect on mechanical properties.
(error bar shows standard deviation)
Figure 3.8 Tensile strain at break for seven groups at 50 mm/min
0 200 400 600 800 1000 1200 1400 1600 1800 2000 PP 10% 15% 20% 30% 40% 100% ten sile s tra in a t b re ak (s ta n d ar d ) (% ) regrind percentage
(error bar shows standard deviation)
Figure 3.9 Modulus test results for seven groups at 50 mm/min
3.2.8 Thermoforming
Our final product is coffee capsule which is usually produced by thermoforming, therefore examining the effect of regrind material content on the thermoforming producing process is essential in designing an economical and environmentally friendly product.
As was shown in Fig 3.10 concerning the thermoformed cups, the appearances of all samples are comparable. During the producing process, it is noticed that with the increase of regrind material proportion, the heating time experienced a rise. PP and 10% regrind material only 1 minute, and the group of 40% regrind material, the heating time was around 2 minutes. As for 100% regrind material which needed around 10 minutes, which doe not make sense. The possible reason was that I did 100% regrind content as my first sample and maybe I did not let the heaters to warm up, so it would take much more time for warming up.
It can be deduced that the producing process became harder with the increase of regrind material percentage, but in the range of 10% to 40% regrind material, the effect on producing process was not that apparent.
0 100 200 300 400 500 600 PP 10% 15% 20% 30% 40% 100% Mo d u lu s (Au to mat ic Yo u n g' s) (MPa) regrind percentage
![Figure 2.2 Typical Water Vapour Transmission Rates of Regular Packaging Polymers [10]](https://thumb-eu.123doks.com/thumbv2/123doknet/2351650.36417/20.918.184.744.665.947/figure-typical-water-vapour-transmission-regular-packaging-polymers.webp)
![Figure 2.3 Typical Oxygen Transmission Rates of Regular Packaging Polymers [10] Theoretically, there are two methods to achieve good oxygen barrier property in polymer packaging, one is sandwiching good oxygen barrier material into multilaye](https://thumb-eu.123doks.com/thumbv2/123doknet/2351650.36417/21.918.148.769.588.930/transmission-packaging-polymers-theoretically-property-packaging-sandwiching-multilaye.webp)
![Figure 2.4 Measured permeability coefficients, P, in 10 -17 m 2 /(s·Pa) for various polymers and gases at 25-30℃ [15]](https://thumb-eu.123doks.com/thumbv2/123doknet/2351650.36417/22.918.155.762.661.826/figure-measured-permeability-coefficients-pa-various-polymers-gases.webp)
![Figure 2.5 Permeability of polymers commonly used in packaging [21]](https://thumb-eu.123doks.com/thumbv2/123doknet/2351650.36417/24.918.137.792.806.1012/figure-permeability-polymers-commonly-used-packaging.webp)
![Figure 2.8 Illustration of the transformation of the crystal structure of EVOH samples with different VA content [3]](https://thumb-eu.123doks.com/thumbv2/123doknet/2351650.36417/28.918.157.741.109.568/figure-illustration-transformation-crystal-structure-samples-different-content.webp)
![Figure 2.10 EVOH orthorhombic crystal structure models of 86 mol.% and 94 mol.% ethylene content [3]](https://thumb-eu.123doks.com/thumbv2/123doknet/2351650.36417/29.918.360.566.747.1000/figure-evoh-orthorhombic-crystal-structure-models-ethylene-content.webp)